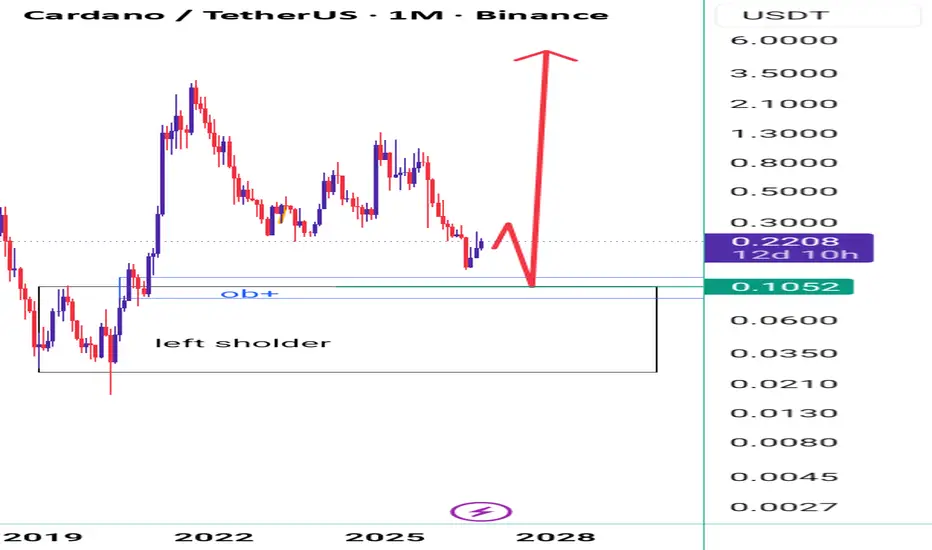
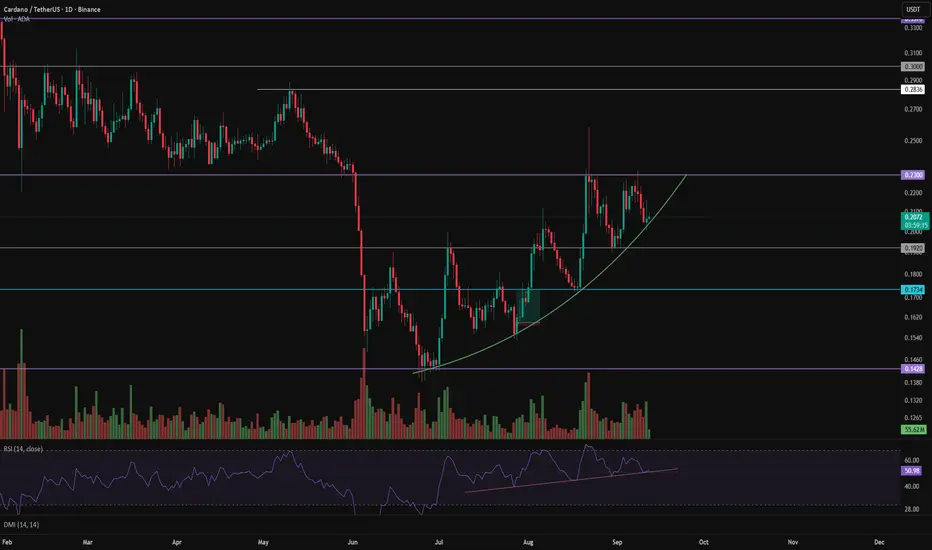
Cardano Bullish RetestCardano is currently trading around a key daily support level after briefly deviating below the established range low. This type of price action is often viewed as a bullish deviation, where liquidity is swept beneath support before buyers step back into the market. The strong reaction from this region suggests demand is beginning to build, making this an important area to monitor over the coming sessions.
As long as ADA continues to hold above the $0.15 support level, the technical outlook remains constructive. Holding this level would confirm the deviation as a successful bullish retest rather than the beginning of a deeper breakdown. This significantly increases the probability of price rotating higher as buyers regain confidence.
The first major upside objective sits around the $0.23 region. This level represents a strong area of technical confluence, combining the Value Area Low from the previous trading range, the VWAP, and historical price acceptance. When multiple technical levels align within the same region, they often become magnets for price during recovery phases.
From a market structure perspective, Cardano appears to be attempting to establish a regional reversal after an extended period of weakness. Although confirmation is still required, the current price action suggests sellers are losing control while buyers gradually absorb supply around support.
If ADA maintains acceptance above the $0.15 support and momentum continues to improve, the probability increases for a rotational move towards the higher levels of the current range, with $0.23 becoming the primary upside target for the next phase of the recovery.
In-depth trading ideas
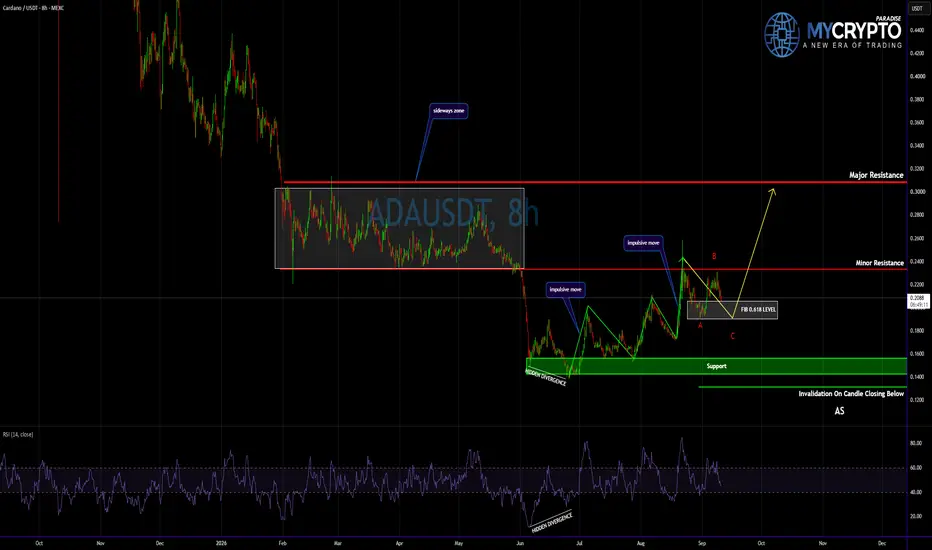
ADA is still trading within a complex corrective pattern (4H)Cardano is still trading within a complex corrective pattern. The recent decline appears to have formed Wave A, followed by the completion of Wave B. The price now seems to be developing the lower-degree Wave C, which is expected to be bearish.
It is worth noting that the higher time frame trend remains bearish.
We are looking for sell/short opportunities within the highlighted supply zone.
The targets are marked on the chart. At the first target, secure partial profits and then move your stop loss to break-even.
Let's see how it plays out.
If you have a coin or altcoin you want analyzed, first hit the like button and then comment its name so I can review it for you.
Do you also think CARDANO is bullish?
#ADAUSDT 1 H Spot LONG#ADA
The price is moving within a descending channel on the 1-hour timeframe and has reached the lower boundary. It is now poised for a bounce and is expected to retest this boundary.
The Relative Strength Index (RSI) indicates a downward trend, which is likely to continue given the overbought conditions.
There is a key support zone (in green) at 0.1510, and the price has bounced off this zone several times, making it a strong support level.
The price is trending towards the 100-period moving average, which we are approaching. This trend supports an upward move.
Entry Price: 0.1630
Target 1: 0.1663
Target 2: 0.1708
Target 3: 0.1756
Stop Loss: At the resistance zone (in green)
Remember this simple rule: Money management.
Any questions? Please leave a comment.
Thank you.
NeuPortal | ADA - dip below the core, then a three-week climbThe view: a drop through the lower edge of the measured zone first, then a sustained climb that runs well past the horizon this band actually covers. Both halves of that sentence matter.
MEASURED, 24-bar horizon (about four days on this 4H chart):
Median 0.1551
Core 50% 0.1486 - 0.1625
Wide 80% 0.1416 - 0.1701
125 independent windows, not the 3,001 overlapping ones
FIRST, THE HORIZON MISMATCH, BECAUSE IT IS VISIBLE AND I WOULD RATHER NAME IT THAN LET SOMEONE ELSE: the shaded band ends around Jul 29. The drawn path runs to mid-August. So most of that arrow travels through territory the printed band says nothing about. The endpoint sitting above the band's ceiling is NOT a claim that price beats the 80% zone - it is a claim about a date three weeks past where the zone stops. Anyone reading the picture as "we expect a break of the band" is reading it wrong, and that is my fault for drawing across the edge.
THE PART THAT IS A REAL CLAIM: the dip. The path goes below the 50% core floor at 0.1486 before turning. That is inside the band's own horizon and it is a genuine directional assertion - the model's sealed read for today is a SHORT lean with a median at 0.1569, so the down leg agrees with the engine while the recovery is my own.
WHERE THIS BAND IS WEAK, AND WE FOUND OUT HOW WEAK THIS WEEK: out-of-sample coverage here reads 58.5% in the core against a 50% target and 89.3% wide against 80%. Too wide, not too narrow.
That is not a footnote today. We audited our whole live board this week and found the same defect at scale: 31 of 36 resolved 24-hour forecasts landed inside a stated 50% band. Eighty-six percent. A walk-forward test over 20,058 observations showed the cause was not history length but the absence of regime conditioning - an unconditional band carries an allowance for turbulence that a quiet market has not earned. Conditioning the sample on today's volatility brings coverage to 50.8%.
Our forecast engine now does that. The band you see plotted here still comes from the unconditional script, so read these zones as generous. Fixing the chart is next.
Also on the panel: empirical width is 0.93x the sigma-root-t band, so the textbook formula is too wide on this instrument as well, and the tails are fat (excess kurtosis 1.95) with a mild left skew (-0.14).
Invalidation for the down leg: acceptance back above the core top at 0.1625 before the dip happens.
The forecast is the band. The drawn path is one illustration of a route, and a band is scored on coverage across many calls - which, as of this week, is a number we have publicly failed and publicly fixed.
Educational content - not financial advice, and not a betting tip.
ADA: Buying the FOMC PullbackToday's FOMC decision injected volatility across both traditional and crypto markets, triggering a broad pullback shortly after the announcement.
Rather than viewing this reaction as a reason to panic, I saw it as an opportunity.
I decided to initiate a long position in **Cardano (ADA)**, not because of the news itself, but because the correction occurred exactly where multiple technical factors began to align.
This is not a prediction. It is simply a trade based on probabilities, market structure, and risk management.
---
## Why I Bought Here
My thesis is based on technical confluence rather than a single indicator.
Following today's selloff, ADA retraced into a previously defended demand zone while continuing to hold above recent support.
At the same time, price remains well below the previous swing high, creating an attractive asymmetric opportunity.
When price pulls back into support without breaking the overall structure, I prefer looking for buying opportunities rather than chasing breakouts.
---
## Reading the Current Structure
Looking at the 4-hour chart, buyers continue to defend the current demand area.
Despite the volatility created by the FOMC announcement, sellers failed to push price below the recent lows.
As long as this support remains intact, I believe the current move is simply a pullback within the broader short-term structure rather than the beginning of a new bearish trend.
Sometimes the best entries come when the market reacts emotionally to macroeconomic events.
---
## Risk vs. Reward
Every trade begins with one simple question:
**Does the potential reward justify the risk?**
In this case, I believe the answer is yes.
My risk is clearly defined below today's support.
If price loses this level, my trade thesis is invalidated and I'll simply accept the loss.
On the other hand, my first objective is the previous swing high around **$0.19**, where sellers previously regained control.
If buyers manage to reclaim that level, it would represent the first meaningful structural shift in favor of the bulls.
The objective isn't to predict the next major rally.
The objective is to consistently position myself where the reward is greater than the risk.
---
## What Needs to Happen Next?
This trade still requires confirmation.
The bullish scenario becomes increasingly attractive if ADA can:
- Hold above the current support zone.
- Continue printing higher lows.
- Break the recent local highs.
- Close above the previous swing high around **$0.19**.
- Successfully retest that level as new support.
If those conditions develop, today's FOMC pullback may simply become another liquidity event before the next impulsive move.
---
## What Invalidates the Trade?
Every trade needs a clear invalidation.
For me, the thesis becomes invalid if ADA loses the current support zone and closes below today's reaction low.
If that happens, the market has proven my idea wrong.
There is no reason to argue with price.
Professional trading is not about being right every time.
It's about managing risk when you're wrong and allowing winners to develop when you're right.
---
## Final Thoughts
The market often overreacts to macroeconomic events.
While many participants focus on the news itself, I prefer focusing on where price reacts.
Today's correction brought ADA back into a technically significant area while offering a clearly defined level for risk management.
Whether this becomes the beginning of the next impulsive move remains uncertain.
The market will decide.
For me, however, the current setup offers an attractive combination of structure, location, and risk-to-reward.
That is enough to justify taking the trade.
---
*This publication reflects my personal interpretation of the market and should not be considered financial advice. Always conduct your own research before making investment decisions.*
---
### What do you think?
**Was today's FOMC pullback a buying opportunity, or do you believe ADA is likely to revisit lower prices before moving higher?**
I'd love to hear your thoughts in the comments.
ADA Analyses-13, [July 21, 2026]Welcome to my page! I share daily technical analyses of crypto assets and other charts here.
BINANCE:ADAUSDT
💡Market Analysis:
ADA has broken above the descending trendline and key resistance level with a strong bullish momentum candle. A successful retest of this key level will confirm the continuation of the upward trend toward the next resistance targets.
Key Support & Resistance:
Key Resistance: 0.1943 - 0.2262
Key Support Area: 0.1735 (Key Level) / 0.1560
🎯 Trade Entry & Exit Plan:
Entry : Breakout/Pullback of trendline or key zones with >80% candle body and two waves outside.
Stop Loss : Behind the last wave or the last strong breakout candle.
Take Profit : Minimum R:R 2, with further targets at major horizontal levels (0.1943 & 0.2262).
⚠️Risk Management:
Maximum 1% risk per trade.
❤️Please share your thoughts and comments on this analysis!
#ADAUSDT 1 H Spot LONG#ADA
The price is moving within a descending channel on the 1-hour timeframe and has reached the lower boundary. It is now poised for a bounce and is expected to retest this boundary.
The Relative Strength Index (RSI) indicates a downward trend, which is likely to continue given the overbought conditions.
There is a key support zone in green at 0.1500, and the price has bounced off this zone several times, making it a strong support level.
The price is trending towards the 100-period moving average, which we are approaching. This trend supports an upward move.
Entry Price: 0.1636
Target 1: 0.1669
Target 2: 0.1704
Target 3: 0.1751
Stop Loss: At the resistance zone in green
Remember this simple rule: Money management.
Any questions? Please leave a comment.
Thank you.
#ADAUSDT 1 H Spot LONG#ADA
The price is moving within a descending channel on the 1-hour timeframe and has reached the lower boundary. It is now poised for a bounce and is expected to retest this boundary.
The Relative Strength Index (RSI) indicates a downward trend, which is likely to continue given the overbought conditions.
A key support zone has been identified in green at 0.1550. The price has bounced off this zone several times, making it a strong support level.
The price is trending towards the 100-period moving average, which we are approaching. This trend supports an upward move.
Entry Price: 0.1626
Target 1: 0.1647
Target 2: 0.1667
Target 3: 0.1693
You can close at the second target or wait for the third target. The choice is yours.
Stop Loss: At the resistance zone in green.
Remember this simple rule: Money Management.
Any questions? Please leave a comment.
Thank you.
FOX Journal #13 | ADAUSDT.PAnother trade added to the FOX Journal.
Every position documented here reflects the same approach: patience, discipline, and consistent execution based on objective market structure.
The goal of this journal isn't to showcase individual winners or losers. It's to document the journey, refine the methodology, and build a transparent track record over time.
One trade means very little.
The complete journal tells the real story.
🦊 Structure. Discipline. Execution.
ADA: local squeeze with $0.2109 destinationThe Macro Picture 🗺️
ADA unwound from the $0.2886 macro ceiling into a summer base and has reclaimed $0.1743, holding above the $0.1484 local low. Price is rotating in the middle of the range with the floor intact — a base rebuilding, not a breakdown.
The Setup ⚙️
The Range Floor 🟢
$0.1484 (Local Low) is the demand shelf, with $0.1380 (Macro Support) as the deeper backstop. Both have held through July, and that's the base this range pivots on.
The Decision Point 🔴
$0.1999 (Local High) is the gate. A daily close above it flips the local structure bullish and opens the path to the $0.2109 measured-move target.
The Roadmap 🛣️
Hold above $0.1484 → break $0.1999 → run toward $0.2109. Invalidation is a clean daily close below $0.1380 — that breaks the range.
This is a GRID Range Play: a defined band to rotate, buying the lower half and scaling out into the breakout.
More setups in profile.
#ADA #Cardano #crypto #trading #TA #3Commas #GRID
ADAUSDT - Potential Inverse Head & ShouldersAfter a prolonged downtrend, ADA appears to be forming a potential Inverse Head and Shoulders pattern on this timeframe.
The Left Shoulder, Head, and Right Shoulder are beginning to take shape, suggesting a possible shift in market sentiment from bearish to bullish.
However, the pattern has not yet been confirmed, as the price remains below both the neckline and the medium-term descending trendline.
The $0.19–$0.20 area is a key resistance zone. A breakout above this level, supported by strong trading volume, would provide confirmation that buyers have gained control of the momentum.
Until a confirmed breakout occurs, I consider this a potential setup rather than a buy signal.
If the breakout is followed by a successful retest of the neckline as support, the next upside target could be projected using the measured move of the Inverse Head and Shoulders pattern.
ADA USDT LONG SIGNAL#85. ADA/USDT – Trade Setup (LONG)
📈 Position Type: LONG
🕒 Timeframe: 1H
📊 Market: Futures
💰 Entry Zone:
0.1610
0.1550
🛑 Stop-Loss:
0.1520
🎯 Take-Profit Targets:
• TP1: 0.1650
• TP2: 0.1704
• TP3: 0.1789
• TP4: 0.1868
⚙️ Leverage:
5
▫️ After TP1, move SL to Entry + 0.2%.
▪️ Exit Plan:
• 40% at TP1
• 20% at TP2
• 20% at TP3
20% at. TP4
📌 Risk Management:
Risk only 1–2% of your capital per trade.
⚠️ Always check and confirm the setup on your chart before entering the trade
Key Supply Zone: 0.1679 ~ 0.1973
Hello, traders.
Follow for more ADA analysis, trade setups, and crypto market insights.
--------------------------------------------------
📈 ADA Monthly Chart (1M) Outlook
ADA is currently trading at a critical price zone that could determine whether a long-term trend reversal is underway.
The 0.1679 ~ 0.1973 range is a major supply zone where a strong bullish rally previously began after a successful breakout.
Going forward, the most important factor is whether ADA can break above this range and flip it into support.
On the other hand, as long as price remains below 0.1679, ADA is still considered to be trading within a long-term accumulation/investment zone. This means aggressive FOMO entries should be avoided, and a more patient approach is recommended.
--------------------------------------------------
📊 ADA Trading Strategy
In conclusion, the ideal trading opportunity for ADA comes when the market confirms support within the 0.1679 ~ 0.1973 range.
A key high-volume node (Volume Profile) is located around 0.1813.
Therefore, a bullish setup becomes more valid only after ADA establishes acceptance above 0.1813 and successfully confirms it as support.
At the moment, however, a full trend reversal has not been confirmed yet.
A stronger bullish trend is more likely to develop once the monthly (1M) candle breaks above the upper M-Signal level and sustains price action above it.
Until then, short-term trading and active day-trading strategies may offer better opportunities than longer swing positions.
--------------------------------------------------
🟢 Bullish Entry Checkpoints
The HA-Low zone stretches from 0.1456 on the 1D chart up to 0.1971 on the 1W chart.
If ADA confirms support within this area, traders can consider scaling into positions through staggered entries.
A successful support flip above 0.1813 would provide an even stronger bullish entry signal.
--------------------------------------------------
🚀 Conditions for Trend Continuation
For ADA to maintain bullish momentum after breaking key resistance levels, the following conditions should be met:
① StochRSI
- Must continue trending higher without becoming excessively overbought.
② OBV (On-Balance Volume)
- Must remain above the High Line with sustained volume inflows.
③ BSSC
- Must stay above the zero line, confirming trend strength.
If these conditions are met, ADA could have a higher probability of extending its rally after breaking above 0.1973.
--------------------------------------------------
💡 Trading Perspective
The market never moves exactly according to anyone's prediction.
Blindly buying based on someone else's outlook is extremely risky.
The goal is not to predict the market, but to identify tradable zones and wait for actual confirmation from price action.
Avoid FOMO entries and focus on high-probability setups. That's how traders protect their capital over the long run.
--------------------------------------------------
🎯 Mid-to-Long-Term Investment Strategy
For investors looking to hold ADA over the medium to long term, continuously injecting new capital simply to increase position size may not be the most efficient approach.
Instead, consider using trading profits to accumulate additional ADA.
One effective strategy is to scale in based on average entry prices, then partially take profit during rallies by withdrawing the principal amount and leaving only profit-generated holdings in the market.
This allows investors to gradually increase their ADA holdings while managing risk more effectively.
--------------------------------------------------
Always wait for the chart to confirm your setup before entering and let the market signals guide your decisions.
-----
Wishing you successful trading and profitable investments. 🚀
-----------------------------------------------
#ADAUSDT D / QM Pattern / long#ADAUSDT D
Cardano is showing the potential for a 40% upside move.
A very clean QM pattern has formed, and if price finds support at either of the blue demand zones, it could move toward our projected target.
In my opinion, this setup offers an attractive risk-to-reward opportunity.
We'll keep you updated.
#ADA
CRYPTOCAP:ADA
LONG Cardano (ADAUSDT) with 10X (3,360% Profits Potential)Cardano is now moving within a huge falling wedge pattern and unavoidable bottom recovery signal. As the end of the pattern, long-term support, has been hit, we can see volatility go up and a change in price dynamics, revealing the market is about to turn/change course.
A bullish wave on this chart setup can last several months, it can be 3 months just as it can be 6 months. It cannot be 2 weeks or 1 month. This is a long-term market phase that is starting to develop now. The bear market and bottom recovery took years to fully unravel. Any type of bullish action is set to go for a while. It will be long lasting.
Full trade-numbers below:
_____
LONG ADAUSDT
Leverage: 10X
Potential: 3360%
Allocation: 5%
Entry zone: $0.1450 - $0.1620
Targets:
1) $0.2222
2) $0.2768
3) $0.3164
4) $0.3560
5) $0.4124
6) $0.4842
7) $0.5634
8) $0.6124
9) $0.6916
Stop: Close weekly below $0.1440
_____
Trading strategy: Buy and hold then wait patiently for the market to take care of the rest. Take profits as the market starts to rise. Avoid the temptation to buy and rebuy as the bullish wave unfolds. Keep your initial entry position and hold strong. An easy call, there is high chance for success.
Thank you for reading.
Namaste.
$ADAUSDT Descending Channel StructureADAUSDT is trading on the 1D timeframe within a well-defined descending channel, with price respecting both the upper and lower trendlines visible on the chart.
The current price is trading around the 0.1603 area after rebounding from the lower boundary of the channel. This keeps price inside the existing bearish structure while testing whether buyers can build enough momentum for a trend change.
Key levels to watch:
Support: around 0.1382–0.1342, near the lower channel boundary.
Resistance: the descending channel resistance near 0.19–0.20, followed by the horizontal level around 0.2188.
A confirmed breakout above the upper channel trendline could signal improving bullish momentum. If that breakout is confirmed, the chart projects a potential move toward 0.2677, representing approximately 109% from the marked low on the chart.
If price fails to break the channel resistance and loses the 0.1382–0.1342 support zone, the bullish scenario may become invalid, and the current downtrend structure could remain in effect.
This chart is shared for educational purposes. Watch for confirmation before considering any directional bias.
ADA - 1H - 13.07.2026🔍 Key Levels & Market Structure Analysis
The Active Demand Zone ($0.1578 – $0.1587):
This blue horizontal band is the immediate point of interest. It marks a historical launchpad where buyers previously stepped in aggressively to absorb supply.
The Breakout Invalidation Line ($0.1558):
This lower support line protects the trade structure. A 1-hour candle body closing completely below this level fully invalidates the bullish thesis.
Overhead Target Resistance ($0.1647):
This pink supply roof is the ultimate destination for a long trade. It lines up with the multi-day consolidation ceiling that capped prices across July 12th.
Buying zone at these FVGs This is the underlying narrative in future that price will forecast as we can se clearly price is in a strong downtrend and not willing to go up but these are the deep zones that can smash price and send higher , these are the deep discount zone that are based on Monthly weekly and on daily analysis.
ada usdt short signal#49. ADA/USDT – Trade Setup (SHORT)
📈 Position Type: SHORT
🕒 Timeframe: 1 H
📊 Market: Futures
💰 Entry Zone:
0.1635
🛑 Stop-Loss:
0.1671
🎯 Take-Profit Targets:
• TP1: 0.1613
• TP2: 0.1587
• TP3: 0.1561
• TP4: 0.1530
TP5:
TP6:
⚙️ Leverage:
5- 10
⚠️ After reaching TP1, move Stop-Loss to Entry Price.
📌 Risk Management:
Risk only 1–2% of your capital per trade.
Always confirm the setup on your chart before entry
ADA: support retest while BTC sleeps — reversion or beta drag?🧭 Where we are
ADA is pressing the lower edge of its 4H range (~0.162 support zone),
not the middle. BTC is ranging — correlation ~0.55, so this is NOT pure beta.
📊 What flow is saying (qualitative)
• CVD trending up near support — buyers absorbing, not panic selling
• OI inflow weak — move lacks leverage fuel; confirmation matters
• Funding slightly negative — shorts paying; tailwind for longs IF level holds
• Stablecoin dominance easing — mild risk-on, helps alts vs pure BTC chop
• Macro fear elevated (cheap + fear) — counter-trend longs need structure, not hope
🔍 Scenarios (a plan, not an order)
Scenario A — Reversion:
Hold ~0.162 zone + buyer aggression in volume/CVD → long interest FROM the level.
Invalidation: acceptance below support — thesis off.
Scenario B — Breakdown / BTC drag:
Clean break below support OR BTC range breaks down with correlation kick-in
→ long off; watch failed retest only if flow confirms.
PASS if: price sits mid-range, OI stays dead, or BTC breaks without alt confirmation.
🎯 Note
This is shadow observation in our alt flow pipeline — NOT a live trade.
We journal the read before any execution. Process > signal.
Follow for flow-based crypto journals — BTC primary, alts when structure aligns.
⚠️ Not financial advice. Scenario map and education — no entries, stops or targets.