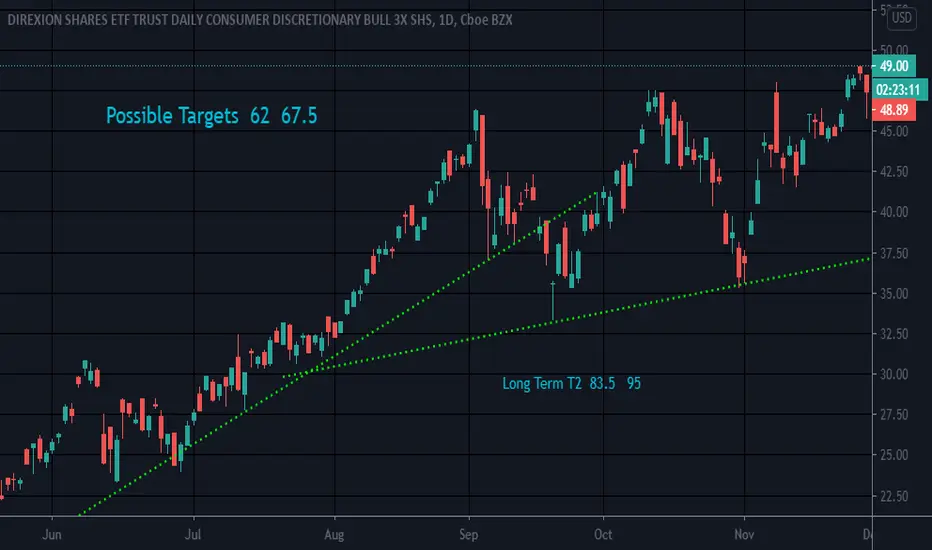
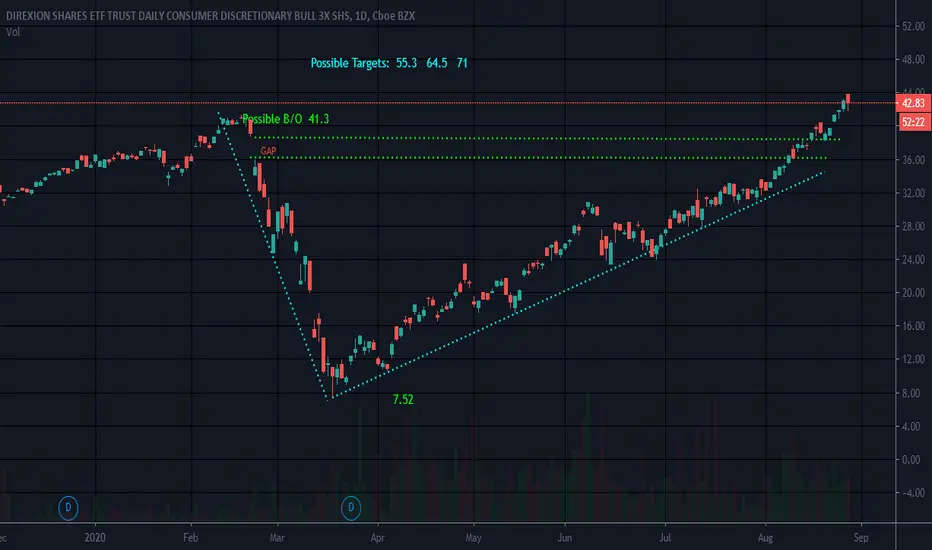
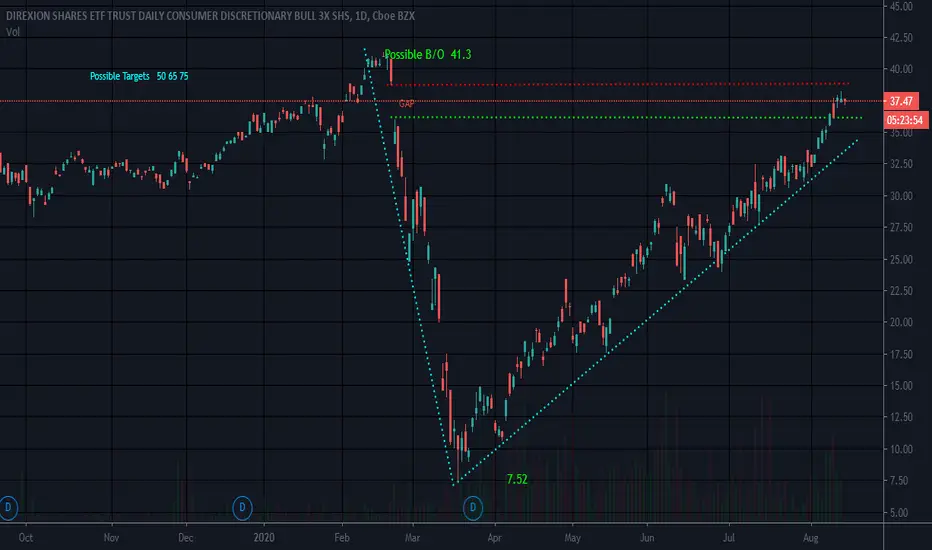
WANT | Consumer Discretionary | BullishThe Advisor employs a replication strategy. The fund generally invests substantially all, but at least 95%, of its total assets in the securities comprising the index. The index includes securities of companies from the following industries: retail; hotels, restaurants and leisure; textiles, apparel
Peers for comparison
Key stats
Fund info
Home page
Inception date
Nov 29, 2018
Structure
Open-Ended Fund
Replication method
Synthetic
Dividend treatment
Distributes
Distribution tax treatment
Ordinary income
Income tax type
Capital Gains
Max ST capital gains rate
39.60%
Max LT capital gains rate
20.00%
Primary advisor
Rafferty Asset Management LLC
Distributor
ALPS Distributors, Inc.
ISIN
US25459Y8012
CUSIP
25459Y801
FIGI
BBG00MP0LJM4
Identifiers
ISIN US25459Y8012
WANT is a daily 3x leveraged bet on the S&P Consumer Discretionary Select Industry Index. WANT does this through a portfolio of swaps contracts that gets rebalanced at the end of each trading day. Because of this rebalancing, the funds return for periods longer than a day becomes path dependent, and is likely to be different from three times the return of the index for the same period. This makes WANT suitable primarily for short-term traders. The expense ratio has minimal impact on the cost of holding these funds for a short period of time, and would matter little to someone who is speculating on the short-term movements of consumer discretionary companies. Trading costs as reflected in spreads, and potential premium/discounts are the predominant consideration here.3 Effective February 27, 2026, the fund replaced the term Shares in its name with ETF.
Classification
What's in the fund
Exposure type
Retail Trade
Consumer Services
Consumer Durables
Cash
Breakdown by region
Top 10 holdings
Trade Idea - WANTWANT has triggered 3 entry signals on a strong backtested squeeze based strategy. Through the options market we believe that want will be trading around 117.67 by Feb 18.
First entry @ 89.10
Second entry @ 92.93
Third entry @ 95.93
Strategy: Long Stock
Trade management: Use a daily adjusted traili
Bullish set up on WANTBullish opportunity on WANT
Sectoral focus gives you a traders edge and with the correct indicator and strategy you can minimize the amount of time in front of a screen and still trade profitably.
Our custom squeeze trigger has printed entry signals on 23, 27, 28 Dec and we have a MA strategy entr
WANT - Spiking above prior channel - Breakout or Crash imminentRSI Spiking, Out of Channel on Range....
Seems like a 20% drop could happen, or we could see a big run.
Discretionary spending, still way up. I've been adding down near the bottom of Channel
* NOT FINANCIAL ADVICE * NOT A FINANCIAL ADVISOR *
WANT, Aroon Indicator entered an Uptrend on January 25, 2021.Over the last three days, Tickeron's A.I.dvisor has detected that WANT's AroonUp green line (see chart) is above 70, while the AroonDown red line is below 30. When the green line goes above 70 while the red line stays below 30, this is an indicator that the stock could be poised for a strong Uptrend
V BottomLeveraged
Trading leveraged securities can be high risk
Not a recommendation
Top 10 Holdings
Consumer Discretionary Select Sector Tr Index Swap
32.81%
Dreyfus Government Secs Cash Mgmt Admin
15.58%
Goldman Sachs FS Treasury Intms Instl
14.86%
Amazon.com Inc
12.44%
The Home Depot Inc
6.56%
Nike In
V bottomLEVERAGED Has gotten through first resistance level at bottom of prior gap down
Top 10 Holdings
AMZN - Amazon.com Inc16.80%
HD - The Home Depot Inc7.03%
MCD - McDonald's Corp4.39%
NKE - Nike Inc B3.73%
SBUX - Starbucks Corp3.07%
LOW - Lowe's Companies Inc2.71%
BKNG - Booking Holdings Inc2.55%
TJX -
See all ideas
Summarizing what the indicators are suggesting.
Oscillators
Neutral
Oscillators
Neutral
Summary
Neutral
Summary
Neutral
Summary
Neutral
Moving Averages
Neutral
Moving Averages
Neutral
Displays a symbol's price movements over previous years to identify recurring trends.
Frequently asked questions
An exchange-traded fund (ETF) is an investment product that holds a basket of assets such as stocks, bonds, futures, or other instruments, and trades on an exchange like a regular stock.
Why investors use ETFs:
– Easy way to gain exposure to sectors like stocks, bonds, real estate, or crypto
– Lower barrier to entry compared to buying individual assets
– Can help reduce volatility through diversification
Explore the largest ETFs: they are considered the most trusted and secure and will help you start your journey on the ETF markets.
Why investors use ETFs:
– Easy way to gain exposure to sectors like stocks, bonds, real estate, or crypto
– Lower barrier to entry compared to buying individual assets
– Can help reduce volatility through diversification
Explore the largest ETFs: they are considered the most trusted and secure and will help you start your journey on the ETF markets.
Markets don't sleep, here's what's going on with WANT at the moment:
– 5 Best Leveraged ETFs of 2024
– 5 Best Leveraged ETFs of Q4
– 4 Best Leveraged ETFs of Last Week
See more updates in real-time with our News Flow.
– 5 Best Leveraged ETFs of 2024
– 5 Best Leveraged ETFs of Q4
– 4 Best Leveraged ETFs of Last Week
See more updates in real-time with our News Flow.
WANT net asset value (NAV) is 39.98 USD. It represents the total value of the fund's assets less liabilities.
Other key metrics:
– WANT AUM — 20.04 M USD
– WANT discount/premium to NAV — 0.07%
– WANT expense ratio — 1.00%
Explore more funds in our list of largest ETFs.
Other key metrics:
– WANT AUM — 20.04 M USD
– WANT discount/premium to NAV — 0.07%
– WANT expense ratio — 1.00%
Explore more funds in our list of largest ETFs.
To put today's price into context, compare WANT's performance across different time periods:
– 1 day — +0.39%
– 1 week — +6.29%
– 1 month — +15.96%
WANT's all-time low was 7.52 USD on Mar 18, 2020, while its all-time high was 111.46 USD on Nov 22, 2021.
For a deeper look at market activity, explore the ETF Heatmap and the WANT price chart.
– 1 day — +0.39%
– 1 week — +6.29%
– 1 month — +15.96%
WANT's all-time low was 7.52 USD on Mar 18, 2020, while its all-time high was 111.46 USD on Nov 22, 2021.
For a deeper look at market activity, explore the ETF Heatmap and the WANT price chart.
The safest way to buy WANT is through a reliable broker. Create an account, fund it, and place a buy order.
You can trade WANT directly from TradingView:
– Choose a broker: Explore our supported trading partners and pick one that fits your needs
– Compare options: View available brokers side by side to evaluate fees and features
– Connect your account: Open Supercharts, click “Trade”, select your exchange, and log in
– Start trading: Place orders directly from the chart
Tip: If you’re new to trading, try paper trading first — it lets you practice strategies in real market conditions without risking funds.
You can trade WANT directly from TradingView:
– Choose a broker: Explore our supported trading partners and pick one that fits your needs
– Compare options: View available brokers side by side to evaluate fees and features
– Connect your account: Open Supercharts, click “Trade”, select your exchange, and log in
– Start trading: Place orders directly from the chart
Tip: If you’re new to trading, try paper trading first — it lets you practice strategies in real market conditions without risking funds.
Direxion Daily Consumer Discretionary Bull 3X ETF expense ratio is 1.00%. It represents the annual cost of managing the fund, expressed as a percentage of its assets.
Other key metrics:
– WANT AUM — 20.04 M USD
– WANT NAV — 39.98 USD
– WANT discount/premium to NAV — 0.07%
Explore more ETFs with highest expense ratio and find even more stats in the ETF Screener.
Other key metrics:
– WANT AUM — 20.04 M USD
– WANT NAV — 39.98 USD
– WANT discount/premium to NAV — 0.07%
Explore more ETFs with highest expense ratio and find even more stats in the ETF Screener.
Before making an investment decision, it's important to understand how the ETF works and whether it aligns with your goals and risk tolerance. Consider factors such as:
– The ETF's holdings
– Whether it is passively or actively managed
– Whether it uses leverage
– Its costs, performance, and other characteristics relevant to your strategy
You can also use technical analysis to assess current market conditions. Our summary Technical Ratings for WANT are:
– Today — strong buy
– 1 week — buy
– 1 month — buy
For a deeper analysis, explore other WANT technicals and follow the latest ETF news.
– The ETF's holdings
– Whether it is passively or actively managed
– Whether it uses leverage
– Its costs, performance, and other characteristics relevant to your strategy
You can also use technical analysis to assess current market conditions. Our summary Technical Ratings for WANT are:
– Today — strong buy
– 1 week — buy
– 1 month — buy
For a deeper analysis, explore other WANT technicals and follow the latest ETF news.
WANT trades at a premium (0.07%).
Premium/discount to net asset value (NAV) expresses the difference between the ETF's price and its NAV value.
– A positive percentage indicates a premium, meaning the fund trades at a higher price than the calculated NAV.
– A negative percentage indicates a discount, suggesting the ETF trades at a lower price than NAV.
You can find more funds in the list of highest premium to NAV.
Premium/discount to net asset value (NAV) expresses the difference between the ETF's price and its NAV value.
– A positive percentage indicates a premium, meaning the fund trades at a higher price than the calculated NAV.
– A negative percentage indicates a discount, suggesting the ETF trades at a lower price than NAV.
You can find more funds in the list of highest premium to NAV.
WANT follows the S&P Consumer Discretionary Select Sector.
ETFs usually track some benchmark seeking to replicate its performance and guide asset selection and objectives.
Indices usually act as such benchmarks by tracking a group of companies or specific sectors, giving a broad view of market performance.
ETFs usually track some benchmark seeking to replicate its performance and guide asset selection and objectives.
Indices usually act as such benchmarks by tracking a group of companies or specific sectors, giving a broad view of market performance.
The fund's management style is passive, aiming to replicate the performance of the S&P Consumer Discretionary Select Sector by holding the same assets in similar proportions.
What it means:
– Index tracking: Mirrors the composition and weight of the underlying index
– Low turnover: Fewer trades compared to active funds
– May be more cost-efficient: Passive approach typically results in lower fees (expense ratio)
Combine this knowledge with other metrics:
– WANT AUM — 20.04 M USD
– WANT NAV — 39.98 USD
– WANT expense ratio — 1.00%
Explore more details in the Profile section.
What it means:
– Index tracking: Mirrors the composition and weight of the underlying index
– Low turnover: Fewer trades compared to active funds
– May be more cost-efficient: Passive approach typically results in lower fees (expense ratio)
Combine this knowledge with other metrics:
– WANT AUM — 20.04 M USD
– WANT NAV — 39.98 USD
– WANT expense ratio — 1.00%
Explore more details in the Profile section.
Today, WANT trades at 43.53 USD.
For broader market analysis, dive into the technicals on the WANT price chart and read the latest WANT news:
– 5 Best Leveraged ETFs of 2024
– 5 Best Leveraged ETFs of Q4
– 4 Best Leveraged ETFs of Last Week
For broader market analysis, dive into the technicals on the WANT price chart and read the latest WANT news:
– 5 Best Leveraged ETFs of 2024
– 5 Best Leveraged ETFs of Q4
– 4 Best Leveraged ETFs of Last Week
WANT assets under management (AUM) is 20.04 M USD. It represents the total market value of all assets held by the fund.
Other key metrics:
– WANT NAV — 39.98 USD
– WANT expense ratio — 1.00%
– WANT premium/discount to NAV — 0.07%
Explore more funds in our list of largest ETFs. For deeper analysis, check the ETF Screener.
Other key metrics:
– WANT NAV — 39.98 USD
– WANT expense ratio — 1.00%
– WANT premium/discount to NAV — 0.07%
Explore more funds in our list of largest ETFs. For deeper analysis, check the ETF Screener.
WANT fund flows account for 801.80 K USD, showing the net amount of money entering or leaving the fund over 1 year. Many traders use it to get insight into investors' sentiment and evaluate whether it's time to buy or sell the fund.
Other key metrics:
– WANT AUM — 20.04 M USD
– WANT discount/premium to NAV — 0.07%
– WANT expense ratio — 1.00%
For broader market analysis, read the latest market news and read the ETF trading ideas.
Other key metrics:
– WANT AUM — 20.04 M USD
– WANT discount/premium to NAV — 0.07%
– WANT expense ratio — 1.00%
For broader market analysis, read the latest market news and read the ETF trading ideas.
WANT invests in stocks. See more details in our Profile section.
Yes, WANT is a leveraged ETF, meaning it uses borrowings or financial derivatives to magnify the performance of the underlying assets or index it follows.
See the list of leveraged ETFs and find the one that correlates with your trading strategy.
Yes, WANT pays dividends to its holders with the dividend yield of 0.79%.
The dividends come from the underlying assets in WANT and are distributed periodically to investors.
Explore more in the dividend-paying ETFs list and follow dividend updates in the Dividend Calendar.
The dividends come from the underlying assets in WANT and are distributed periodically to investors.
Explore more in the dividend-paying ETFs list and follow dividend updates in the Dividend Calendar.
WANT shares are issued by Rafferty Asset Management LLC.
WANT started trading on Nov 29, 2018. The launch date marks the fund's first day on the exchange and the start of its publicly available price history.
The age of a fund can be useful when evaluating its track record, as older funds typically provide more historical data for analyzing performance across different market conditions.