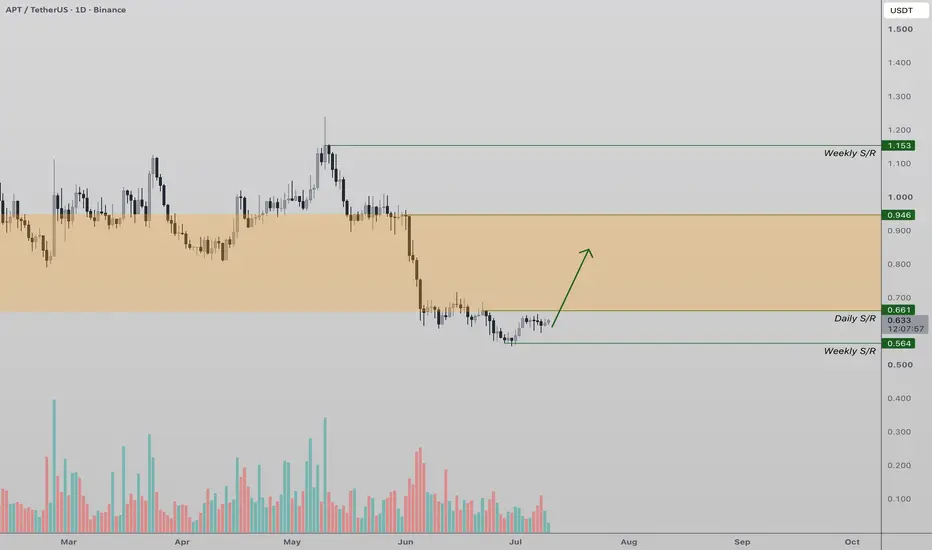
Aptos Builds Momentum, Bullish H&S Pattern Aptos (APT) continues to show signs of accumulation after establishing support above the key high timeframe level around $0.57.
This region is supported by multiple technical confluences, including the Value Area Low of the current range and the 0.618 Fibonacci retracement, making it a significant
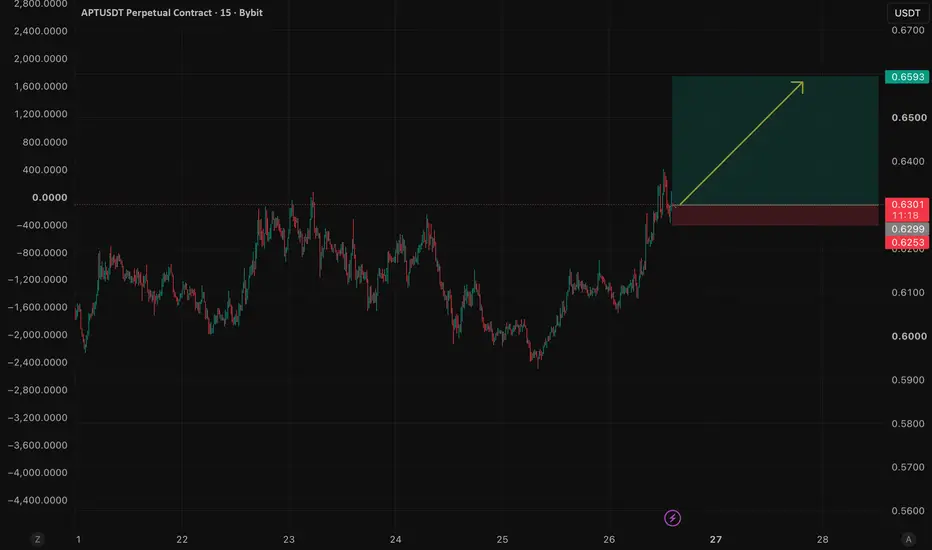
APTUSDT: Bullish Breakout Signals Potential for Further UpsideAPTUSDT has broken above its recent consolidation range with strong bullish momentum, suggesting buyers are regaining control. The impulsive move higher, followed by price holding above the breakout area, indicates the previous resistance has the potential to act as new support.
As long as 0.6253 h
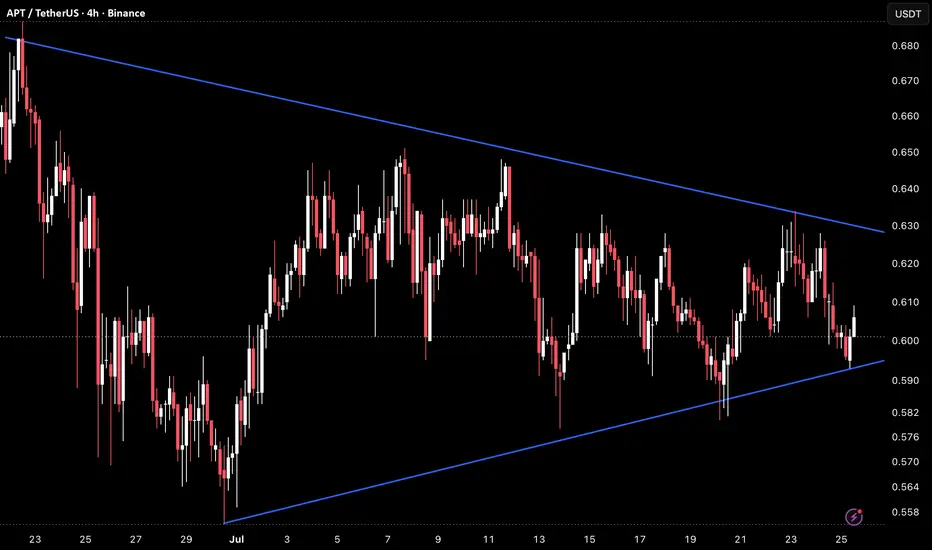
APT 4H – Symmetrical Triangle Compressing at ApexAPT on the 4H timeframe is currently trading around 0.661 after oscillating inside a symmetrical triangle since late June, with the descending upper trendline and rising lower trendline now converging tightly as the structure approaches its apex and the 0.600–0.607 horizontal pivot continues to defi
APT 1D – Descending Channel at Lower BoundaryAPT on the 1D timeframe is currently trading around 1.766 after a sustained decline from the January high near 2.000, with price now pressing into the lower boundary of a descending channel that has defined the macro structure across the entire visible chart, currently sitting near 0.540–0.570.
The
APTUSDT 3D Bullish Reversal Setuphi traders
This technical analysis outlines a highly compelling bullish reversal setup for APTUSDT on the macro 3-Day (3D) time frame. The asset has been grinding down in a corrective structure, but several major technical indicators suggest that a bottom is either in or extremely close to forming.
#APTUSDT is currently strongly bullish#APT
The price is moving within a descending channel on the 1-hour timeframe and has reached the lower boundary. It is now poised for a bounce and is expected to retest this boundary.
The Relative Strength Index (RSI) indicates a downward trend, which is likely to continue given the overbought con
Aptos Tests Critical ResistanceAptos (APT) is currently trading just below a major daily resistance, placing price at a pivotal technical level that could determine the next directional move. Following the recent decline, the market is attempting to stabilize, but buyers must reclaim this overhead resistance before any meaningful
APT / USDT — Market StructureAPT continues to consolidate beneath resistance while buyers continue to defend higher lows.
Selling pressure has gradually weakened, while demand remains resilient during pullbacks, suggesting improving absorption around current levels.
Liquidity continues to build as price approaches a key decis
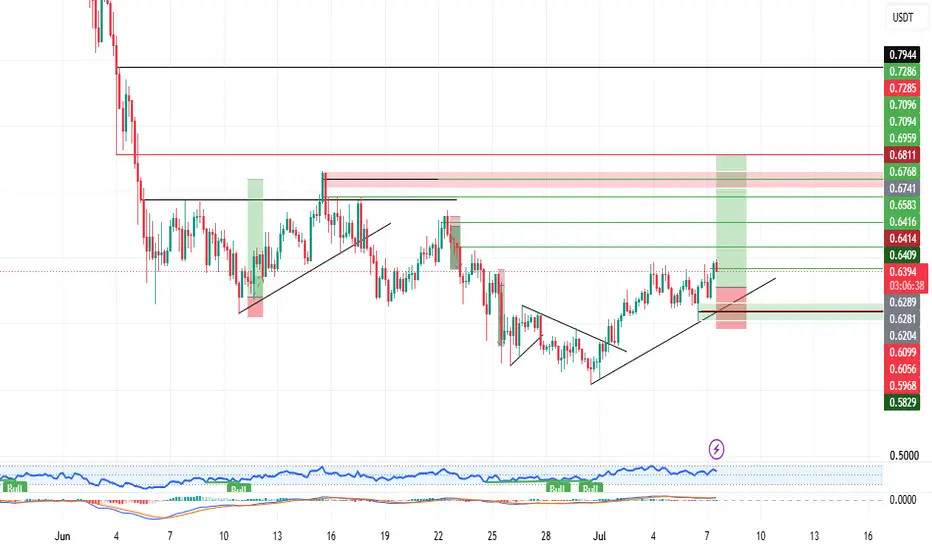
APT: recovery base eyeing the $0.70 decisionThe Macro Picture 🗺️
APT broke down hard through June, collapsing from the $0.95 shelf into a $0.55 liquidity sweep that dragged RSI into deep oversold and flushed the over-leveraged longs. Buyers stepped in at the lows and have since rebuilt a base above $0.58, curling up from the $0.62 equilibri
See all ideas
Summarizing what the indicators are suggesting.
Oscillators
Neutral
SellBuy
Strong sellStrong buy
Strong sellSellNeutralBuyStrong buy
Oscillators
Neutral
SellBuy
Strong sellStrong buy
Strong sellSellNeutralBuyStrong buy
Summary
Neutral
SellBuy
Strong sellStrong buy
Strong sellSellNeutralBuyStrong buy
Summary
Neutral
SellBuy
Strong sellStrong buy
Strong sellSellNeutralBuyStrong buy
Summary
Neutral
SellBuy
Strong sellStrong buy
Strong sellSellNeutralBuyStrong buy
Moving Averages
Neutral
SellBuy
Strong sellStrong buy
Strong sellSellNeutralBuyStrong buy
Moving Averages
Neutral
SellBuy
Strong sellStrong buy
Strong sellSellNeutralBuyStrong buy
Displays a symbol's price movements over previous years to identify recurring trends.