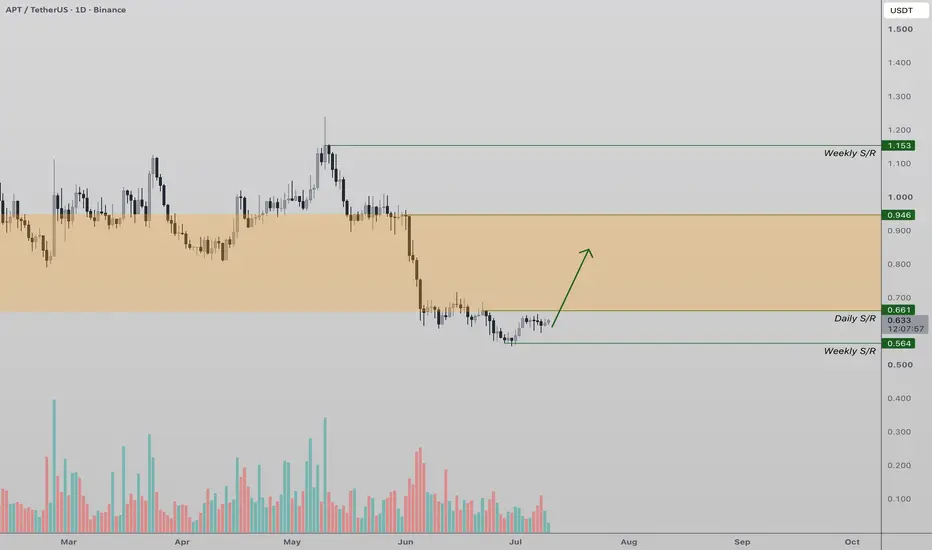
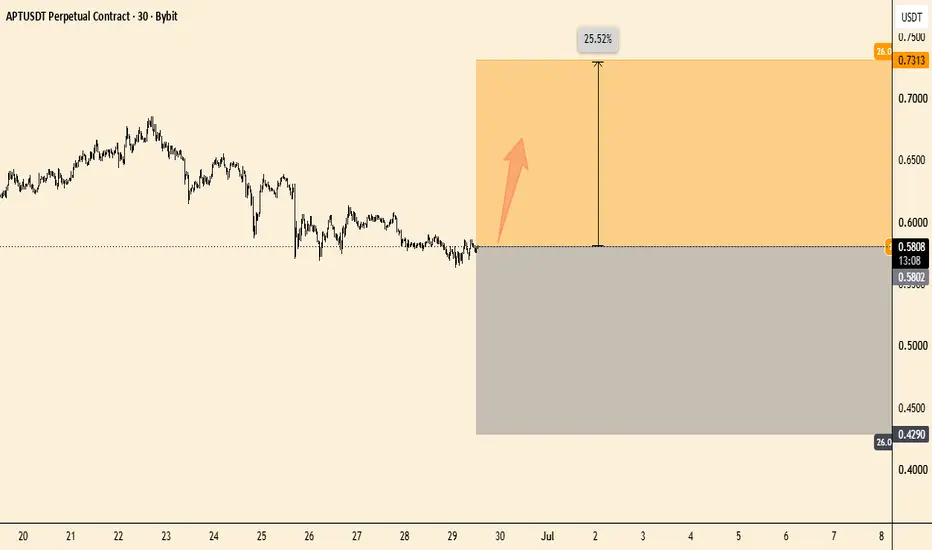
Aptos Builds Momentum, Bullish H&S Pattern Aptos (APT) continues to show signs of accumulation after establishing support above the key high timeframe level around $0.57.
This region is supported by multiple technical confluences, including the Value Area Low of the current range and the 0.618 Fibonacci retracement, making it a significant demand zone where buyers have consistently stepped in to defend price.
Price action is now beginning to form what appears to be a potential inverse head and shoulders pattern, a classic bullish reversal structure that often develops after an extended corrective phase. While the pattern is not yet confirmed, the continued defence of support increases the probability that buyers are quietly accumulating positions before the next expansion higher.
The key level to monitor is the neckline resistance.
A decisive breakout accompanied by strong bullish volume would confirm the pattern and signal a shift in market structure. Such a move would likely attract momentum traders while forcing sidelined buyers back into the market, increasing the probability of a sustained rally.
If the neckline is successfully reclaimed, the next major upside objective sits around the $0.94 region, representing the next significant area of high timeframe resistance. Until then, maintaining support above $0.57 remains critical. As long as this level continues to hold, the bullish structure stays intact and the probability of a breakout continues to build.
In-depth trading ideas
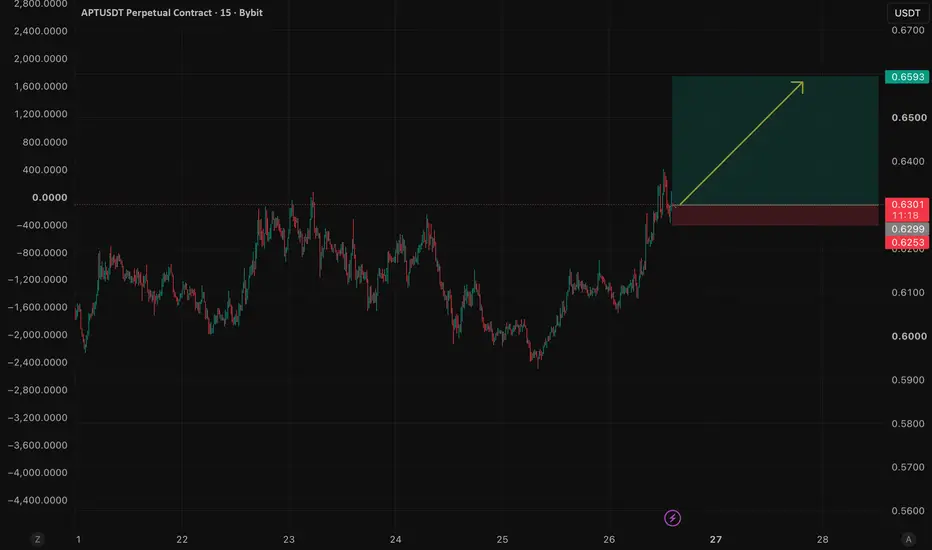
APTUSDT: Bullish Breakout Signals Potential for Further UpsideAPTUSDT has broken above its recent consolidation range with strong bullish momentum, suggesting buyers are regaining control. The impulsive move higher, followed by price holding above the breakout area, indicates the previous resistance has the potential to act as new support.
As long as 0.6253 holds, the bullish structure remains intact. A continuation of buying pressure could see price extend toward 0.6593, while a decisive break below support would invalidate the current bullish setup and increase the risk of a deeper pullback.
Trade Setup
Entry: 0.6299
Target: 0.6593
Stop Loss: 0.6253
I'll remain bullish while price trades above 0.6253, targeting a continuation toward 0.6593. A confirmed close below the stop-loss level would invalidate this trade idea.
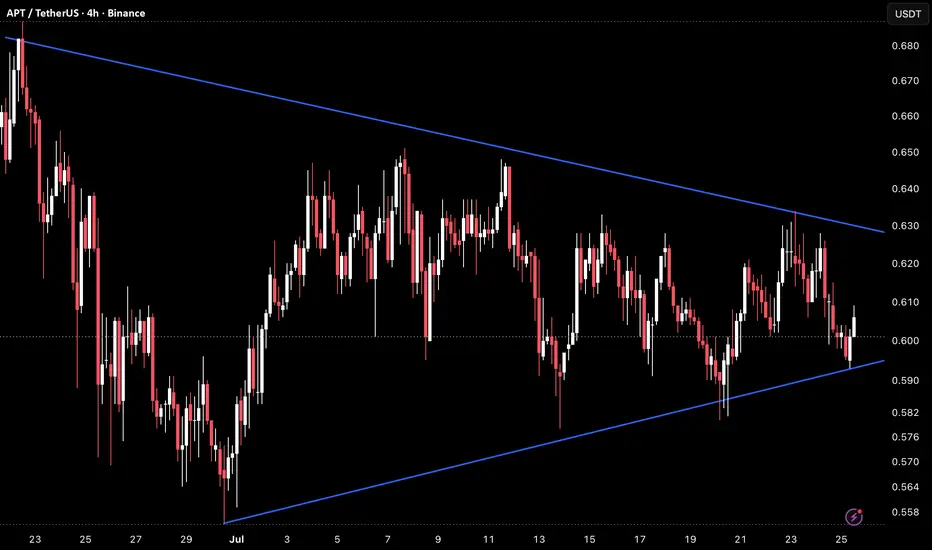
APT 4H – Symmetrical Triangle Compressing at ApexAPT on the 4H timeframe is currently trading around 0.661 after oscillating inside a symmetrical triangle since late June, with the descending upper trendline and rising lower trendline now converging tightly as the structure approaches its apex and the 0.600–0.607 horizontal pivot continues to define the lower boundary of the recent price action.
The chart shows a symmetrical triangle formed by a descending upper trendline originating from the late June high near 0.680, connecting through the July 6 high near 0.650, the July 11 high near 0.648, and the July 23 high near 0.632, while the rising lower trendline connects the July 1 low near 0.558 through the July 21 low near 0.582 and the July 24 low near 0.590, now climbing into the 0.593–0.598 area. Price has oscillated between both boundaries consistently, with the descending trendline capping every recovery and the rising trendline catching every significant low. Two horizontal reference levels define the internal structure — one near 0.605–0.607 and a second near 0.600–0.602 — both of which have acted as the lower pivot zone throughout the compression and are currently being tested as price sits just above them. The descending upper trendline is now declining into 0.628–0.632 while the lower trendline rises toward 0.593–0.598, leaving a band of roughly 30–35 points before a resolution is forced.
The compression has been building for nearly four weeks on the 4H timeframe and the trendlines are now meeting almost directly at current price, meaning a directional break is imminent.
Key Levels To Watch
→ 0.675–0.680 – June high, major resistance above
→ 0.648–0.652 – Prior recovery high, resistance
→ 0.628–0.632 – Descending upper trendline, current overhead resistance (dynamic)
→ 0.618–0.622 – Minor resistance zone inside triangle
→ 0.605–0.607 – Horizontal pivot, lower internal reference
→ 0.593–0.598 – Rising lower trendline, dynamic support (climbing)
→ Below 0.558 – Triangle breakdown, extended downside
A confirmed break above the descending upper trendline near 0.628–0.632 and follow-through above 0.648–0.652 would signal a bullish resolution, opening a move toward 0.675–0.680 and potentially above the June high on continuation.
A confirmed break below the rising lower trendline near 0.593–0.598 and a loss of the 0.600–0.607 horizontal would signal a bearish resolution, removing the upward structure from the July low and opening downside toward 0.558 and below with no clear support in between.
Four weeks of compression now at apex, breakout imminent in either direction. Break above 0.628–0.632 → bullish resolution, eyes on 0.648–0.680. Break below 0.593–0.598 → bearish resolution, downside toward 0.558 and below. Bias neutral at apex. Direction confirmed only on a decisive close outside either trendline.
APT 1D – Descending Channel at Lower BoundaryAPT on the 1D timeframe is currently trading around 1.766 after a sustained decline from the January high near 2.000, with price now pressing into the lower boundary of a descending channel that has defined the macro structure across the entire visible chart, currently sitting near 0.540–0.570.
The chart shows a descending channel originating from the January high near 2.000, with the upper trendline connecting that high through the May recovery high near 1.220 and continuing to slope down into the 0.940–1.000 area currently. The lower trendline has caught the March low near 0.820 before price recovered back into the channel, and is now declining into the 0.540–0.570 zone where price has been pressing following the sharp June breakdown. That breakdown accelerated from the 0.940–1.000 area in late May through June, erasing months of ranging structure in a matter of weeks and pushing price directly into the lower channel boundary. A horizontal reference level near 0.595–0.610 has emerged as a short-term pivot through the current consolidation at the lower boundary, with price repeatedly crossing through it in both directions without establishing a clear hold.
Price has been compressing along the lower channel boundary for several sessions without a meaningful recovery, which is notable given that the March touch of the lower boundary produced a recovery all the way back to 1.220.
Key Levels To Watch
→ 1.900–2.000 – January high, major resistance above
→ 1.500–1.600 – Prior consolidation zone, upper channel resistance
→ 1.100–1.220 – Prior recovery high, mid-channel resistance
→ 0.940–1.000 – Descending upper trendline, overhead resistance (dynamic)
→ 0.760–0.820 – Prior breakdown zone, resistance
→ 0.595–0.610 – Horizontal pivot, current short-term reference
→ 0.540–0.570 – Lower channel boundary, current test
A hold at the lower channel boundary near 0.540–0.570 and a recovery back above 0.595–0.610 and then 0.760–0.820 would keep the macro channel structure intact and open a potential recovery toward the mid-channel zone near 0.940–1.000, though the absence of a sharp bounce so far warrants caution.
A confirmed daily close below the lower channel boundary near 0.540 would be the first macro structural break since January, removing the trendline that caught the March low and opening downside below 0.540 with no clear support visible beneath on this chart.
Lower boundary test with no meaningful bounce so far, macro structure at its most critical point. Hold 0.540–0.570 and reclaim 0.595–0.610 → recovery open toward 0.760–0.820 and above. Lose 0.540 on confirmed daily close → macro breakdown, uncharted downside below channel. Bias neutral to cautiously bullish at lower boundary. Shift bearish only on confirmed close below 0.540–0.570.
APTUSDT 3D Bullish Reversal Setuphi traders
This technical analysis outlines a highly compelling bullish reversal setup for APTUSDT on the macro 3-Day (3D) time frame. The asset has been grinding down in a corrective structure, but several major technical indicators suggest that a bottom is either in or extremely close to forming.
1. Macro Falling Wedge Structure
The price action is currently compressed within a falling wedge pattern (defined by the downward-sloping yellow support and resistance lines). Falling wedges are inherently bullish structures that typically resolve in an upward breakout.
Price is currently hovering right at the lower boundary of this wedge around the $0.55 – $0.65 zone, testing a major historical accumulation floor.
2. Strong Bullish Divergence on the 3D RSI
The core driver of this trading idea is the clear Bullish Divergence forming on the 3-Day Relative Strength Index (RSI).
While the price action has consistently made lower lows from February through to July (sloping downwards along the lower yellow trendline), the RSI indicator has simultaneously carved out higher lows (sloping upwards along its respective yellow trendline).
This classic technical mismatch reveals decreasing bearish momentum and strong underlying buying pressure building up in the higher time frame background.
3. Price Scenarios & Targets
The chart projects two potential paths for the upcoming bullish expansion, both leading to the same primary macro target:
Scenario A (Immediate Breakout): Price consolidates slightly at current levels before breaking directly out of the wedge resistance to begin its upward rally.
Scenario B (Final Sweep): Price takes one final liquidity sweep down to the absolute bottom of the wedge support line (around $0.50) to fully exhaust sellers before aggressively reversing.
Key Levels to Watch
Immediate Support: $0.50 – $0.55 (The lower wedge boundary and absolute invalidation zone).
Major Upside Target: $2.00 – $2.20 (Marked by the red horizontal resistance line and flag icon). Reaching this target represents a potential ~230%+ rally from current levels, where heavy profit-taking should be expected as it meets historical structural resistance.
#APTUSDT is currently strongly bullish#APT
The price is moving within a descending channel on the 1-hour timeframe and has reached the lower boundary. It is now poised for a bounce and is expected to retest this boundary.
The Relative Strength Index (RSI) indicates a downward trend, which is likely to continue given the overbought conditions.
There is a key support zone in green at 0.593, and the price has bounced off this zone several times, making it a strong support level.
The price is trending towards the 100-period moving average, which we are approaching. This trend supports an upward move.
Entry Price: 0.625
Target 1: 0.629
Target 2: 0.638
Target 3: 0.651
Stop Loss: At the resistance zone in green
Remember this simple rule: Money management.
Any questions? Please leave a comment.
Thank you.
Aptos Tests Critical ResistanceAptos (APT) is currently trading just below a major daily resistance, placing price at a pivotal technical level that could determine the next directional move. Following the recent decline, the market is attempting to stabilize, but buyers must reclaim this overhead resistance before any meaningful bullish continuation can be confirmed.
From a market structure perspective, a successful reclaim of the daily resistance would signal a deviation below support rather than a true bearish breakdown. In auction market theory, a deviation occurs when price briefly trades beyond a key level, attracts liquidity, and then quickly returns back into the previous trading range. When this happens, it often traps late sellers and creates the conditions for a strong reversal.
A confirmed reclaim would also suggest the formation of a failed auction, where the market is unable to sustain lower prices and instead rotates back toward the opposite side of the range. If buyers can establish acceptance above the daily resistance, the probability increases for a rally toward the $9.00 region, which represents the next major resistance within the current trading range.
However, failure to reclaim this resistance would leave the deviation unconfirmed and keep the short-term structure neutral to bearish, increasing the likelihood of continued consolidation or another test of the recent lows.
For now, Aptos remains at a decisive technical level. The reaction around the daily resistance will determine whether the recent move lower proves to be a liquidity sweep before continuation higher, or whether sellers retain control of the market. A bullish reclaim would strengthen the case for a rotational move back toward the upper boundary of the range.
APT / USDT — Market StructureAPT continues to consolidate beneath resistance while buyers continue to defend higher lows.
Selling pressure has gradually weakened, while demand remains resilient during pullbacks, suggesting improving absorption around current levels.
Liquidity continues to build as price approaches a key decision area. The next reaction from this zone should provide more clarity on whether the current consolidation represents accumulation or simply a pause before further downside.
The focus remains on confirmation rather than anticipation.
Order flow, participation, and price reaction at key levels will determine the next directional move.
APT: recovery base eyeing the $0.70 decisionThe Macro Picture 🗺️
APT broke down hard through June, collapsing from the $0.95 shelf into a $0.55 liquidity sweep that dragged RSI into deep oversold and flushed the over-leveraged longs. Buyers stepped in at the lows and have since rebuilt a base above $0.58, curling up from the $0.62 equilibrium with RSI recovering back toward its midline. This is the constructive backfill after a capitulation — price is basing rather than making new lows, and the $0.55–$0.62 zone is where accumulation quietly happens. The macro trend is still repairing, but the sweep-and-reclaim sequence favors buyers over another leg down.
The Setup ⚙️
The Reaction: The $0.55 macro support (solid green) absorbed the June capitulation and launched the recovery. It stacks under the $0.58 local low to form a high-confluence demand shelf — the line that must hold to keep the reversal intact.
The Accumulation Zone: The $0.58–$0.62 band is a textbook pocket for staggered, averaging-based entries — price is basing here after the sweep, letting buyers build into the recovery instead of chasing a single fill.
The Ceiling: The $0.70 local decision (red dashed) capped the first bounce. A decisive daily close above it reopens the path toward the $0.95 macro supply band.
The Roadmap: Primary target sits at $0.70 — the green roadmap points toward a retest of the decision level as buyers defend the base. Invalidation: a sustained 1D close below $0.55 would void the recovery and reopen the downtrend to fresh lows.
More setups in profile.
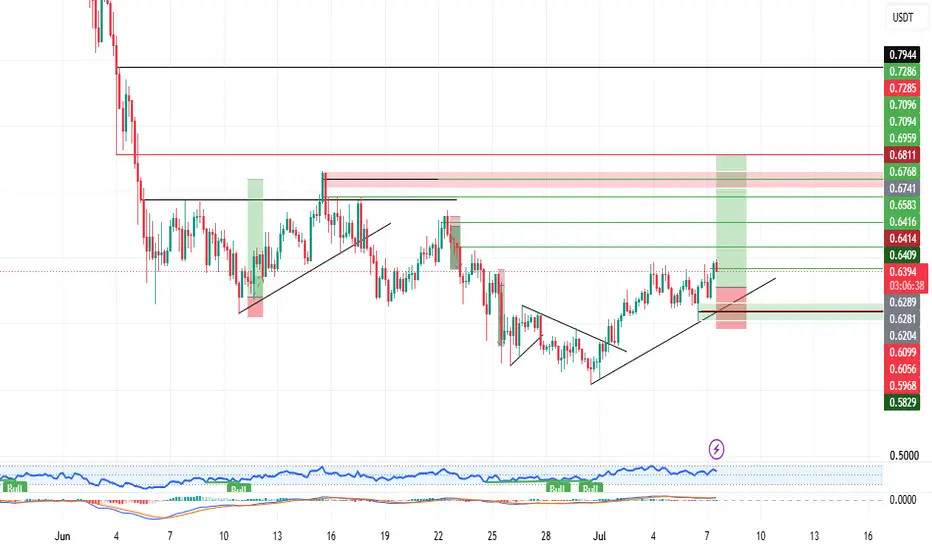
APT USDT LONG SIGNAL#28. APT/USDT – Trade Setup (LONG)
📈 Position Type: LONG
🕒 Timeframe: 1 H
📊 Market: Futures
💰 Entry Zone:
0.6281
0.6099
🛑 Stop-Loss:
0.5967
🎯 Take-Profit Targets:
• TP1: 0.6415
• TP2: 0.6584
• TP3: 0.6770
• TP4: 0.6958
TP5: 0.7094
TP6: 0.7285
⚙️ Leverage:
5- 10
⚠️ After reaching TP1, move Stop-Loss to Entry Price.
📌 Risk Management:
Risk only 1–2% of your capital per trade.
Always confirm the setup on your chart before entry
APT 4H – Descending Channel Bounce Off Lower BoundaryAPT on the 4H timeframe is currently trading around 0.755 after bouncing off the lower boundary of a descending channel near 0.555–0.565, with price now pressing into the 0.610–0.617 horizontal resistance zone that has been a consistent pivot throughout the structure.
The chart shows a descending channel in place since early June, with the upper trendline connecting lower highs from the 0.760 area down through the mid-June high near 0.720 and the June 23 high near 0.680, while the lower trendline has caught the significant lows across the same period. Price ranged between the channel boundaries through the first half of June before breaking lower in late June, dropping sharply from the 0.680 area and pushing into the lower channel boundary near 0.555–0.565 by late June. A recovery followed, pushing price back up through the structure, but two horizontal reference levels now sit overhead — one near 0.610–0.617 which has acted as a recurring pivot across the entire visible range, and a second near 0.625–0.630 just above it. The descending upper trendline is currently sloping into the 0.640–0.650 area and continues to define the ceiling of the channel.
Price is currently pressing directly into the 0.610–0.617 horizontal resistance after bouncing
from the lower boundary, sitting at a level that has rejected multiple recovery attempts throughout June.
Key Levels To Watch
→ 0.760–0.770 – June high, major resistance above
→ 0.700–0.720 – Prior recovery highs, upper channel resistance
→ 0.640–0.650 – Descending upper trendline, current overhead resistance (dynamic)
→ 0.625–0.630 – Horizontal resistance, secondary level
→ 0.610–0.617 – Horizontal pivot, current test
→ 0.555–0.565 – Lower channel boundary, recent bounce zone
→ Below 0.545 – Channel breakdown, extended downside
A break above 0.610–0.617 and follow-through through 0.625–0.630 would put price back inside the mid-channel zone and set up a test of the descending upper trendline near 0.640–0.650, with a trendline break above that level opening a more significant recovery toward 0.700–0.720.
A rejection at 0.610–0.617 and a return toward the lower channel boundary near 0.555–0.565 would mark a second test of that level, and a confirmed close below 0.545 would signal a full channel breakdown with no clear structure beneath to provide meaningful support.
Bounce off lower boundary now testing key horizontal resistance, descending trendline above adding further compression. Break 0.610–0.617 and clear 0.625–0.630 → mid-channel open, eyes on upper trendline near 0.640–0.650. Reject here → second lower boundary test, break below 0.545 opens full breakdown. Bias neutral inside channel. Shift bullish only on confirmed break above descending upper trendline.
#APTUSDT is currently strongly bullish#APT
The price is moving within a descending channel on the 1-hour timeframe and has reached the lower boundary. It is now poised for a bounce and is expected to retest this boundary.
The Relative Strength Index (RSI) indicates a downward trend, which is likely to continue given the overbought conditions.
There is a key support zone (in green) at 0.550, and the price has bounced off this zone several times, making it a strong support level.
The price is trending towards the 100-period moving average, which we are approaching. This trend supports an upward move.
Entry Price: 0.580
Target 1: 0.589
Target 2: 0.605
Target 3: 0.625
Stop Loss: At the resistance zone (in green)
Remember this simple rule: Money management.
Any questions? Please leave a comment.
Thank you.
Ethereum + ALTS Bullish or Bearish?!ETH. Scenario 1: Bullish tapping into the key level at 2K and then we will look to short.
ETH. Scenario 2: Price drops from where we are, and we will get a sweep of low and a longing opportunity.
ALTS: As mentioned, these are the ALTS I am looking at, this is NOT financial advise.
⚠️ Disclaimer:
I am not a financial advisor. The content shared on this channel is for educational and informational purposes only and should not be considered financial or investment advice.
Trading and investing in cryptocurrencies involves significant risk, including the potential loss of some or all of your capital. This is especially true when using leverage, margin, or futures products, which may not be suitable for all participants.
Any strategies, trade examples, or market commentary presented are for educational purposes only and are based on personal opinions, experience, or hypothetical and historical examples. Past performance does not guarantee future results.
Always conduct your own research and consider consulting a licensed financial professional before making any financial decisions. Never trade with money you cannot afford to lose.
By viewing this content, you acknowledge that you understand the risks involved and agree that Trader Alchemist is not responsible for any financial decisions or losses you may incur.
APT USDT LONG SIGNALAPT/USDT – Trade Setup (LONG)
📈 Position Type:long
🕒 Timeframe: 15M
📊 Market: Futures
💰 Entry Zone:
0.62
🛑 Stop-Loss:
0.6050
🎯 Take-Profit Targets:
• TP1: 0.6427
• TP2: 0.6654
• TP3: 0.6864
• TP4: 0.7096
⚙️ Leverage:
5–10
⚠️ After reaching TP1, move Stop-Loss to Entry Price.
📌 Risk Management:
Risk only 1–2% of your capital per trade.
Always confirm the setup on your chart before entry
APTUSDT: liquidity sweep before the next leg downThe Macro Picture 🗺️
APTUSDT spent the better part of 2026 boxed inside a broad multi-month range, capped overhead by the $1.30 macro ceiling and pivoting around the $0.90–$1.00 core marked on the chart. The May rally stalled beneath that ceiling and printed a lower high, setting up the breakdown that followed. That structure has now gone through a structural reset — price sliced clean through the range floor and flushed without a meaningful retest, converting months of support into overhead supply. With the range gone, the path of least resistance bends lower, and APT now sits at ~$0.66, pressing directly into the $0.62 local low it just carved.
The Setup ⚙️
The Support Flip: The $0.90–$1.00 region that anchored price for months has flipped into overhead supply. Every bounce into the underside of the broken range is now being sold, and bulls have shown no appetite to reclaim it.
The Squeeze: Price is coiling in a tight Local Squeeze directly above the $0.62 floor, momentum compressed after the flush with RSI pinned near oversold and the signal line rolling over. A squeeze this deep into a downtrend tends to resolve with the trend — downward — rather than spring a reversal.
The Roadmap: Primary target sits at $0.62 — the local low the squeeze is pressing into; a decisive 1D close below it sweeps the sell-stops resting beneath the floor and opens continuation toward the next major support below the visible range. Invalidation: a sustained 1D close back above $0.90 would reclaim the broken range, invalidate this bearish thesis, and shift the read back to range-bound.
Aptusdt short Roddy01-SIGNALSPROVIDER Instructions:
Entry point: yellow
Stop loss: red
Take profit: green
👉Leverage x 5-10-20 for crypto
👉Leverage x 20-50-100 for commodities, stocks, indices, and forex
👉Margin 1-5% max.
Always practice risk and money management.
Invest a maximum of 5% on any trade or across all your trades.
Invest only what you can afford to lose, as no one is in control of the market.
👉Our analyses are primarily based on:
breakouts: two trend lines (ascending and descending) and a line indicating a horizontal breakout.
chart patterns: shoulders and head, triangle parttern, elliott impulse, etc etc.
We don't always have the time to track them at all times or to represent them visibly, given the numerous signals, the number of channels to manage, and especially because of the often rapid pace of market movements.
indicators: We associate at least two indicators with this technique.
👉Depending on the circumstances, we use specific indicators, often setting 3 or more take profit levels.
👉Indeed, there are good days in trading and also bad days. No one can promise to win every trade, and like all traders worldwide, we also experience stop-loss orders. However, we win more than we lose and remain positive.
👉You can close the position before or after the take profit orders indicated by the green lines if you are personally satisfied; the same applies to stop loss orders.
👉We must stay positive, clear-headed, and humble.
we cannot provide all instructions or all trades here on this channel.
Good luck to us all, and may God guide us. Amen.
APT 8H – Full Breakdown at Macro Trendline SupportAPT on the 8H timeframe is currently trading around 0.677 after a sharp and aggressive breakdown that sliced through the symmetrical triangle structure and the 0.750–0.760 horizontal support floor, pushing price to the lowest level on this chart.
Price is now sitting directly on the lower trendline from the April lows near 0.670–0.677, which is the last visible structural reference on this chart. The breakdown through the triangle and horizontal support was fast and decisive with no meaningful bounce along the way.
All prior support levels are now overhead resistance.
Key Levels To Watch
1.250 → Prior spike high, major resistance above
1.000–1.050 → Prior range highs, key resistance
0.930–0.970 → Descending resistance trendline, overhead
0.810–0.850 → Prior support zone, now resistance
0.750–0.760 → Broken horizontal floor, now resistance
0.670–0.677 → Lower trendline support, current test
Below 0.621 → No visible support, new lows likely
The structure is fully bearish. The symmetrical triangle that had offered the last compression setup broke to the downside and price accelerated through the horizontal floor at 0.750 without any meaningful pause, leaving no support levels between there and the current trendline.
A hold at the lower trendline near 0.670–0.677 and a recovery back above 0.750 would be the minimum requirement for any structural shift toward stabilization.
A confirmed close below 0.670 and loss of the lower trendline would push price into new low territory with no structural support visible below 0.621.
This is the last visible support on this chart.
Hold 0.670–0.677 trendline → stabilization possible, recovery needs reclaim of 0.750.
Lose 0.670 → new lows, no structure below 0.621.
Structure fully bearish below broken triangle and horizontal floor.
Recovery only on reclaim of 0.750+.
#APTUSDT is currently strongly bullish#APT
The price is moving within a descending channel on the 1-hour timeframe and has reached the lower boundary. It is now poised for a bounce and is expected to retest this boundary.
The Relative Strength Index (RSI) indicates a downward trend, which is likely to continue given the overbought conditions.
A key support zone (in green) has been identified at 0.625. The price has bounced off this zone several times, making it a strong support level.
The price is trending towards the 100-period moving average, which we are approaching. This trend supports an upward move.
Entry Price: 0.692
Target 1: 0.711
Target 2: 0.737
Target 3: 0.774
You can close at the second target or wait for the third target to be reached. The choice is yours.
Stop Loss: At the resistance zone (in green).
Remember this simple rule: Money Management.
Any questions? Please leave a comment.
Thank you.
#APTUSDT is currently strongly bullish#APT
The price is moving within a descending channel on the 1-hour timeframe and has reached the lower boundary. It is now poised for a bounce and is expected to retest this boundary.
The Relative Strength Index (RSI) indicates a downward trend, which is likely to continue given the overbought conditions.
There is a key support zone (in green) at 0.750. The price has bounced off this zone several times, making it a strong support level.
The price is trending towards the 100-period moving average, which we are approaching. This trend supports an upward move.
Entry Price: 0.856
First Target: 0.871
Second Target: 0.889
Third Target: 0.915
You can stop at the first and second targets and close below them, or continue towards the third target. Stop Loss: At the resistance zone (in green).
Remember this simple rule: Money Management.
Any questions? Please leave a comment.
Thank you.
aptusdt shortInstructions:
Entry point: yellow
Stop loss: red
Take profit: green
👉Leverage x 5-10-20 for crypto
👉Leverage x 20-50-100 for commodities, stocks, indices, and forex
👉Margin 1-5% max.
Always practice risk and money management.
Invest a maximum of 5% on any trade or across all your trades.
Invest only what you can afford to lose, as no one is in control of the market.
👉Our analyses are primarily based on:
breakouts: two trend lines (ascending and descending) and a line indicating a horizontal breakout.
chart patterns: shoulders and head, triangle parttern, elliott impulse, etc etc.
We don't always have the time to track them at all times or to represent them visibly, given the numerous signals, the number of channels to manage, and especially because of the often rapid pace of market movements.
indicators: We associate at least two indicators with this technique.
👉Depending on the circumstances, we use specific indicators, often setting 3 or more take profit levels.
👉Indeed, there are good days in trading and also bad days. No one can promise to win every trade, and like all traders worldwide, we also experience stop-loss orders. However, we win more than we lose and remain positive.
👉You can close the position before or after the take profit orders indicated by the green lines if you are personally satisfied; the same applies to stop loss orders.
👉We must stay positive, clear-headed, and humble.
we cannot provide all instructions or all trades here on this channel.
Good luck to us all, and may God guide us. Amen.
APTUSDTAPT/USDT 1H Analysis
APT is currently trying to gain strength along with the ascending trend line while also testing the significant resistance area in the 0.96–0.97 region.
After the recent drop, the price has started to show signs of recovery by forming higher lows. The ascending trend line supports the short-term bullish structure, while the current resistance area stands out as a critical zone in terms of market structure.
Since this area previously acted as support before breaking down, it has now become a strong resistance/supply zone.
A clear breakout above the resistance area could allow the price to rise back above the 1.00 level and then open the way towards the 1.06 region.
However, if rejected from the current area, it is possible for the price to pull back towards the ascending trend line.
Summary:
APT is testing a significant resistance area along with the ascending trend support. A breakout above the resistance could strengthen short-term bullish momentum, while a rejection could lead to a correction towards the trend line.
Take your risk, make some profit !
- CryptoSignalAPP Team