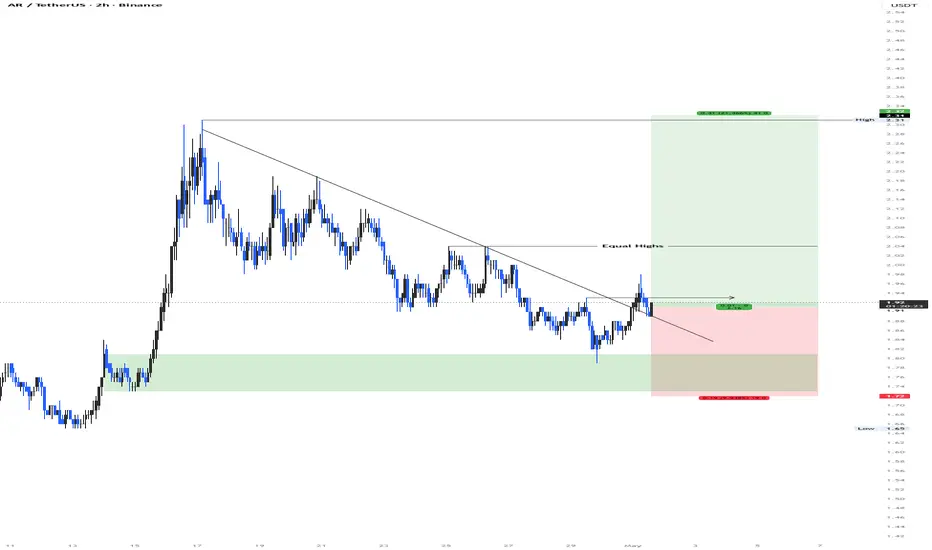
#ARBUSDT | Testing Wedge Breakout Amid Key Support#AR
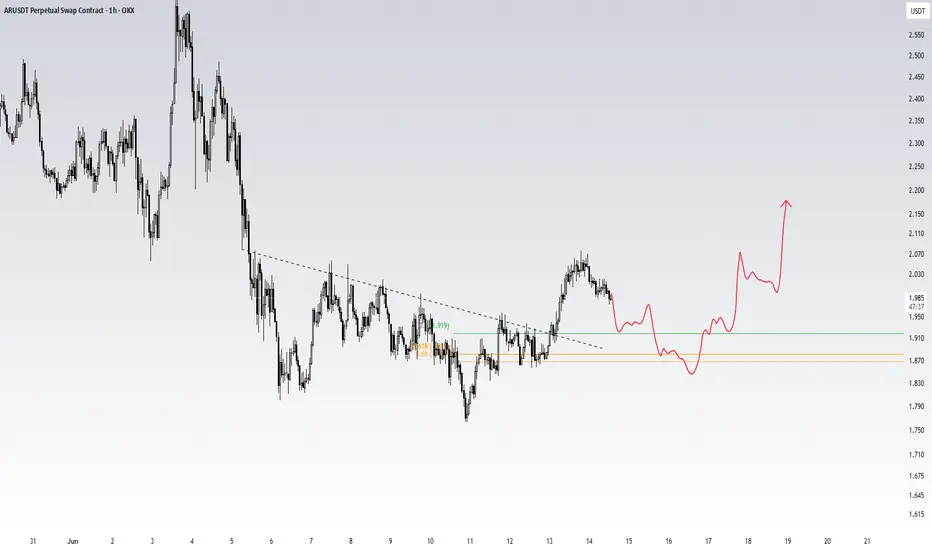
The price is moving within a descending channel on the 1-hour timeframe and has reached the lower boundary. It is now poised for a bounce and is expected to retest this boundary.
The Relative Strength Index (RSI) indicates a downward trend, which is likely to continue given the overbought conditions.
There is a key support zone in green at 1.77, and the price has bounced off this zone several times, making it a strong support level.
The price is trending towards the 100-period moving average, which we are approaching. This trend supports an upward move.
Entry Price: 1.870
Target 1: 1.886
Target 2: 1.913
Target 3: 1.95
Stop Loss: At the resistance zone in green
Remember this simple rule: Money management.
Any questions? Please leave a comment.
Thank you.
In-depth trading ideas
AR: local squeeze with $2.28 destinationThe Macro Picture 🗺️
AR rolled off the $2.794 macro ceiling and settled into a range, and price is now balancing at $1.864 above the $1.740 local low. The tape has flattened into a base — a coin working off its downtrend rather than extending it.
The Setup ⚙️
The Range Floor 🟢
$1.740 (Local Low) is the demand shelf. Buyers have defended it on each retest, and that's the floor this range pivots on.
The Decision Point 🔴
$1.990 (Local High) is the gate. A daily close above it flips the local structure bullish and opens the path to the $2.282 measured-move target.
The Roadmap 🛣️
Hold above $1.740 → reclaim $1.990 → run toward $2.282. Invalidation is a clean daily close below $1.740 — that breaks the base.
This is a GRID Range Play: a defined $1.740–1.990 band to rotate, buying the lower half and scaling out into the breakout.
More setups in profile.
#AR #Arweave #crypto #trading #TA #3Commas #GRID
AR is about to explode!AR has a bullish market structure. After forming bullish CHoCHs and bullish BOSs, it has now swept the sell side liquidity at the bottom of the chart and is expected to move toward the marked targets.
You can buy at the current market price or within the marked demand zone.
The targets are marked on the chart. Move your stop loss to breakeven after Target 1 is reached.
A daily candle close below the invalidation level will invalidate this analysis.
If you would like us to analyze a coin or altcoin for you, first like this post, then comment the name of your altcoin below.
What is your opinion about AR?
ARUSDT - Descending Channel, Reversal or Another Rejection?📊 ARUSDT on the 4-Day (4D) timeframe is still trading within a major Descending Channel that has dominated the trend since late 2024. At the moment, the price is testing the upper channel resistance (red trendline), which will likely determine the next major direction.
📈 The price structure shows signs of recovery from the lower boundary of the channel. However, a true bullish confirmation will only occur if the price successfully breaks out of the long-standing descending trend.
━━━━━━━━━━━━━━━━━━━━
📉 Main Pattern: Descending Channel
The primary pattern visible on the chart is a Descending Channel, formed by two parallel downward-sloping trendlines.
🔍 Pattern Characteristics:
🔹 Lower Highs continue to form along the channel resistance.
🔹 Lower Lows continue to form near the channel support.
🔹 Indicates strong seller dominance throughout the trend.
🔹 The longer the price remains inside the channel, the greater the potential for an explosive move once a breakout occurs.
📍 On this chart, the price is currently approaching the upper boundary of the channel, making this a critical area that could determine the next major trend direction.
━━━━━━━━━━━━━━━━━━━━
🟢 Bullish Scenario
🚨 For a bullish confirmation, ARUSDT must break above and hold above the red channel resistance.
🎯 Bullish Targets:
🥇 Target 1: 2.72 USDT
➡️ Initial resistance zone and short-term breakout confirmation level.
🥈 Target 2: 3.52 USDT
➡️ Horizontal resistance that previously acted as a distribution zone.
🥉 Target 3: 4.30 USDT
➡️ Major supply zone and key mid-term resistance.
🏆 Target 4: 7.97 USDT
➡️ Major upside target if the Descending Channel breakout triggers a medium-to-long-term trend reversal.
✅ Bullish Supporting Factors:
✔️ Price has successfully formed a higher low from the channel bottom.
✔️ Rebound momentum is becoming increasingly visible.
✔️ Potential breakout from a downtrend that has lasted for several months.
✔️ Attractive risk-to-reward profile if the breakout is confirmed.
━━━━━━━━━━━━━━━━━━━━
🔴 Bearish Scenario
⚠️ As long as the price remains below the red channel resistance, the bearish trend remains technically valid.
📉 Bearish Risks:
❌ Rejection from the channel resistance could trigger renewed selling pressure.
❌ Price may revisit the mid-channel region.
❌ If support fails to hold, the price could continue declining toward the lower channel boundary.
❌ A retest of the previous low around 1.26 USDT remains possible if the broader crypto market weakens.
🚨 Bearish Confirmation:
🔻 Failure to break above channel resistance.
🔻 Significant selling volume appears near resistance.
🔻 Formation of another lower high before a breakout occurs.
━━━━━━━━━━━━━━━━━━━━
📊 Conclusion
🎯 ARUSDT is currently positioned at one of its most important technical levels since entering this major Descending Channel. The red channel resistance acts as the key decision zone between a continuation of the bearish trend and the beginning of a larger recovery phase.
🚀 A valid breakout could open the path toward 2.72 → 3.52 → 4.30 → 7.97 USDT, while a rejection may send the price back toward support levels and potentially the lower channel boundary.
👀 For now, traders should focus on waiting for a confirmed breakout or rejection from the resistance zone currently being tested.
━━━━━━━━━━━━━━━━━━━━
#ARUSDT #AR #Crypto #Altcoin #TechnicalAnalysis #ChartAnalysis #CryptoTrading #Binance #USDT #DescendingChannel #Breakout #Bullish #Bearish #PriceAction #SupportAndResistance #Trendline #SwingTrading #CryptoMarket #Altcoins #Trader #Investing #MarketAnalysis #LongTermTrading #TrendReversal
Arweave (AR) Technical AnalysisArweave is showing a notable shift in momentum after breaking out of a multi week downtrend and reclaiming key support levels. Strong volume accompanied the move, signaling meaningful buyer participation.
The breakout above the descending trendline is the key development. AR has also reclaimed the 0.618 Fibonacci level and is attempting to turn that area into support. Holding above this zone would reinforce the bullish structure.
Volume expanded sharply during the breakout, while price moved back above key moving averages that are beginning to trend higher. This suggests momentum is improving after an extended period of weakness.
The next test for bulls is the overhead resistance zone where sellers previously entered the market. A period of consolidation above current levels could support further upside.
For now, the trend favors buyers as long as AR holds above the breakout area. With growing attention on AI, DePIN, and decentralized data infrastructure, Arweave remains a chart worth watching.
Arweave (AR) Can Hit A New All-Time High —Opportunity Buy-zoneHere we have a clear bottom process, another one. This can only be called an "opportunity," the opportunity buy-zone, the extreme kind of type.
Arweave—ARUSDT
Trading at bottom prices. Recently, a new all-time low. Recently, a higher low. Recently, the highest volume ever. Recently, the bearish wave reached its end.
There is a perfect descending channel which contains within a two years long bear market. A very strong bearish period indeed.
Arweave—ARUSDT was bullish only once in all of its history, a bullish period that lasted several months, October 2023 through March-May 2024, that's it.
The current chart supports a bigger bullish cycle developing next, nothing like the past. The past was a big relief rally, not a true bullish market phase.
This time around, we should see years of growth, the inverse of the bearish cycle, a full blown bullish cycle, a new all-time high is always possible.
Just as the market can hit new all-time lows when going down, it can hit new all-time highs when going up.
Just as the market can crash for years non-stop, it can also produce sustained long-term growth. It is now or now. It is starting now, but the end, we don't know.
This is the best possible ever—the extreme opportunity buy-zone.
Namaste.
Areweave looing for a breakout. NYSE:AR showing a strong reaction after reclaiming a key resistance zone and holding above the local trend structure.
Price pushed back above the major volume area near 2.16 and buyers stepped in aggressively on the retest. Momentum is starting to shift back in favor of bulls as higher lows continue to form on the intraday structure.
What stands out here:
• Strong reclaim of previous resistance
• Ascending trendline still intact
• Price holding above key moving averages
• Volume profile showing acceptance in the current range
The current zone is important. Bulls want to see acceptance above resistance with continuation volume. If that happens, AR could start expanding into the next supply region.
On the bearish side, losing the recent support area would weaken the structure and likely trigger a rotation back into the lower range.
Right now this looks less like exhaustion and more like a market attempting continuation after consolidation.
Watch for confirmation, not emotion.
ARUSDT: trend in daily time framesThe color levels are very accurate levels of support and resistance in different time frames, and we have to wait for their reaction in these areas.
So, Please pay special attention to the very accurate trend, colored levels, and you must know that SETUP is very very ... very sensitive.
Don't get the short position, just if price down to sensitive area get the BUY position.
So, please set the order for BUY position with +200 pips SL.
Be careful
BEST
MT
ARUSDT: trend in daily time framesThe color levels are very accurate levels of support and resistance in different time frames, and we have to wait for their reaction in these areas.
So, Please pay special attention to the very accurate trend, colored levels, and you must know that SETUP is very very ... very sensitive.
Be careful
BEST
MT
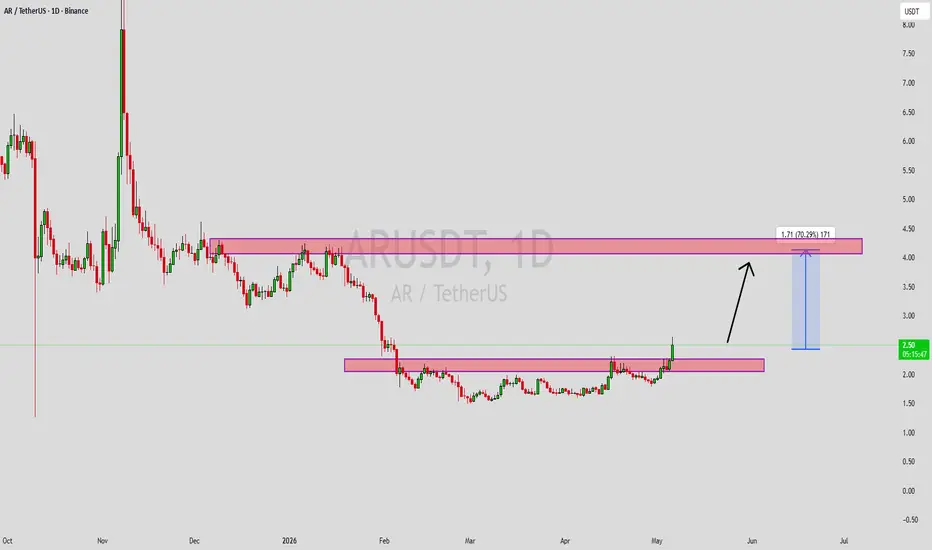
ARUSDT Forming Bullish MomentumARUSDT is forming a clear bullish momentum pattern, a classic bullish wave signal that often indicates an upcoming breakout. The price has been consolidating within a narrowing range, suggesting that selling pressure is weakening while buyers are beginning to regain control. With consistent volume confirming accumulation at lower levels, the setup hints at a potential bullish breakout soon. The projected move could lead to an impressive gain of around 60% to 70% once the price breaks above the wedge resistance.
This bullish momentum pattern is typically seen at the end of downtrends or corrective phases, and it represents a potential shift in market sentiment from bearish to bullish. Traders closely watching ARUSDT are noting the strengthening momentum as it nears a breakout zone. The good trading volume adds confidence to this pattern, showing that market participants are positioning early in anticipation of a reversal.
Investors’ growing interest in ARUSDT reflects rising confidence in the project’s long-term fundamentals and current technical strength. If the breakout confirms with sustained volume, this could mark the start of a fresh bullish leg. Traders might find this a valuable setup for medium-term gains, especially as the wedge pattern completes and buying momentum accelerates.
✅ Show your support by hitting the like button and
✅ Leaving a comment below! (What is your opinion about this coin?)
Your feedback and engagement keep me inspired to share more insightful market analysis with you!
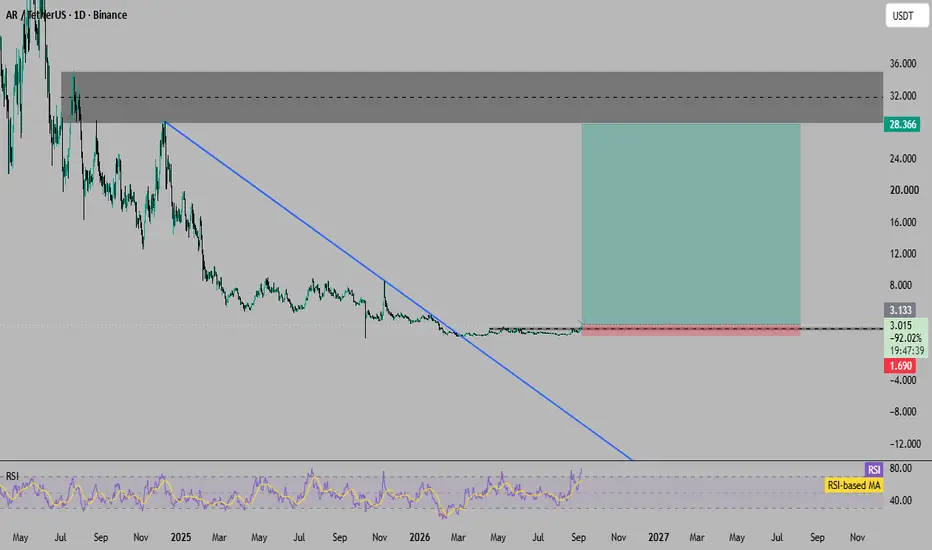
ARUSDT 1D#AR has broken above the descending resistance on the daily chart but is now facing the resistance zone and the daily EMA100. In case of a breakout above these levels, the potential upside targets are:
🎯 $2.42
🎯 $2.63
🎯 $2.93
🎯 $3.31
⚠️ Always remember to use a tight stop-loss and maintain proper risk management.
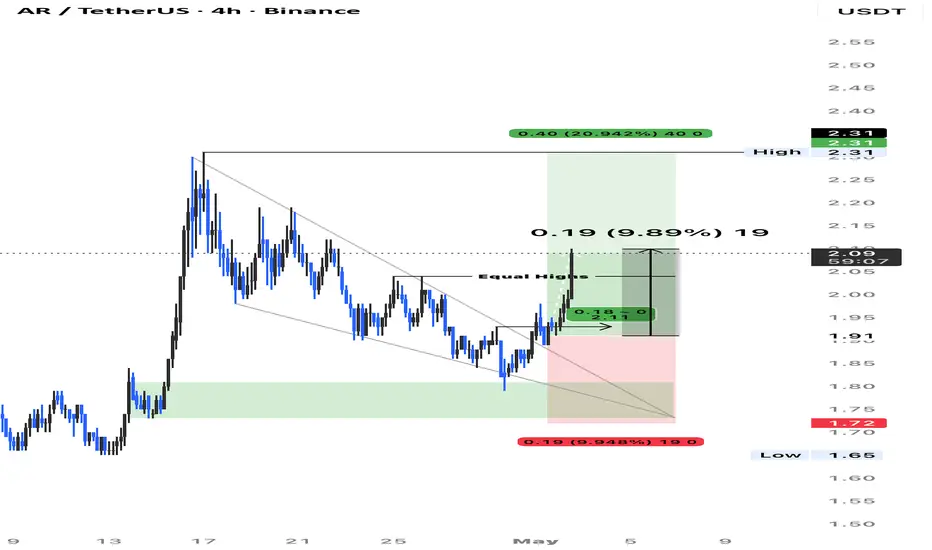
$AR looks good hereTrend is clearly bullish and after the pullback we got a CHOCH on 2H 📈
Same strategy I shared with you guys aligning perfectly here as well.
I’m putting around 5-8% of my portfolio in this trade
Not financial advice always do your own research
Let’s see how it plays out 🔥
LIKE - RT for more setups!!!!
Entry and stoploss are clearly visible on the chart!
Areweave got a bounce.. Proof of life?Arweave looks like it is trying to shift structure after a prolonged downtrend, but this is not confirmed yet.
Price just pushed into a key supply zone while reclaiming short term levels. That move created a potential change of character, but it still needs follow through. Volume expansion on the push is a good sign, showing buyers are stepping in.
Right now this area is the decision point. If price holds above this reclaimed level and builds structure, continuation becomes more likely. That would confirm momentum shifting and open the door for a higher low to form.
If this level fails, expect a rejection back into the range and possibly a sweep of the lows. That would signal the move was just a liquidity grab rather than a true reversal.
Key focus is simple
Hold and consolidate above current level for strength
Reject and lose structure for weakness
Wait for confirmation. This is not the spot to chase, it is the spot to observe.
AR is near the buyers' range (4H)The larger structure is bullish, and we are looking for buy/long positions around support zones.
If the price reaches the specified zone, we will look for buy/long positions. If it doesn’t reach the entry zone and moves toward the target instead, we will not enter on the retracement.
Entry points are marked and should be taken using DCA (Dollar-Cost Averaging).
Targets are indicated on the chart.
A daily candle close below the invalidation level will invalidate this analysis.
If you would like us to analyze a coin or altcoin for you, first like this post, then comment the name of your altcoin below.
What is your opinion about AR?
Arweave (AR) up to $79, a new all-time high—Opportunity buy-zoneHere we have a clear bottom process, another one. This can only be called an "opportunity," the opportunity buy-zone, the extreme kind of type.
Arweave—ARUSDT
Trading at bottom prices. Recently, a new all-time low. Recently, a higher low. Recently, the highest volume ever. Recently, the bearish wave reached its end.
There is a perfect descending channel which contains within a two years long bear market. A very strong bearish period indeed.
Arweave—ARUSDT was bullish only once in all of its history, a bullish period that lasted several months, October 2023 through March-May 2024, that's it.
The current chart supports a bigger bullish cycle developing next, nothing like the past. The past was a big relief rally, not a true bullish market phase.
This time around, we should see years of growth, the inverse of the bearish cycle, a full blown bullish cycle, a new all-time high is always possible.
Just as the market can hit new all-time lows when going down, it can hit new all-time highs when going up.
Just as the market can crash for years non-stop, it can also produce sustained long-term growth. It is now or now. It is starting now, but the end, we don't know.
This is the best possible ever—the extreme opportunity buy-zone.
Namaste.
Now its time for Short. Sell ARusdtHello Traders!
Recently we completed 2 big bullish targets in BTC and ADA and the overall market was strong bullish but now its turning bears. Very little bulls remaining before bears take over.
There is a reversal pattern after breakout and market is ready for big short. But again i am saying we don't trade patterns nor i recommend to use patterns. This analysis is based on my self made strategies. I use multiple strategies to crack a perfect trade.
Target 1.67(+13%)
Stoploss 2.043(-6.6%)
My aim is to achieve highest win rate in tradingview trading community :) and we will definitely do that.
Trade Analysis Based On:
• A1000x Master Reversal Strategy
• A1000x Secret S/R Strategy
• Candlestick Patterns
• A1000x Stop Loss & Target Strategy
We trade using carefully developed strategies and disciplined market analysis, always seeking the best possible accuracy while remembering that ultimate success comes only by the will of Allah.
In some trades, you may notice a relatively larger stop loss or a risk-to-reward ratio that may appear unusual at first glance. However, every trade is taken with proper planning and calculated analysis, not random entries.
Before entering any position, we perform detailed calculations and market evaluation. Based on this analysis, we carefully determine our stop loss and target levels.
I personally apply one of my specialized stop-loss and target strategies, designed to place the stop loss at a logical market level where price is less likely to reach before moving toward the intended target — InshaAllah.
Trading always involves risk, but with discipline, patience, and proper strategy, we aim for consistent and responsible decision-making.
Feel free to share your thoughts, leave a comment, or contact me.
AR/USDT - Accumulation Opportunity or Breakdown Risk?AR/USDT is currently trading on the Weekly (1W) timeframe and is testing a very critical historical demand zone at 4.03 – 3.20 USDT (highlighted by the yellow box). This area represents a previous accumulation base before a major bullish impulse, making it a highly significant technical level.
After failing to maintain its mid-term bullish structure, price has formed a clear downtrend (lower highs – lower lows) and is now approaching a long-term decision point.
---
Key Levels
Major Support (Demand Zone):
4.03 – 3.20 USDT → Strong historical demand & accumulation zone
Resistance / Layered Supply Zones:
4.96 – 6.04 USDT → Minor resistance / pullback zone
8.79 USDT → Previous breakdown support
13.25 USDT → Weekly key resistance
26.83 USDT → Mid-cycle resistance
34.45 USDT → Major supply zone
47.93 – 49.55 USDT → Macro top resistance
---
Pattern & Market Structure Explanation
Primary Trend: Bearish (Lower High & Lower Low)
Market Phase: Late downtrend / potential accumulation
Observed Pattern:
Falling structure into a major demand zone
Indication of potential Wyckoff Accumulation Phase A–B, if price holds above demand
Candle Behavior:
Strong rejection wicks below demand indicate early buyer interest
However, there is no confirmed weekly bullish reversal candle yet
---
Bullish Scenario
The bullish scenario is valid only if:
1. Price holds above 3.20 USDT
2. A weekly higher low is formed
3. Strong break and weekly close above 4.96 – 6.04 USDT
Bullish Step-by-Step Targets:
6.04 USDT → Initial reversal validation
8.79 USDT → Key resistance
13.25 USDT → Trend reversal confirmation
26.83 USDT → Mid-cycle bullish expansion
34.45 USDT → Major distribution zone
This bullish bias represents a long-term accumulation opportunity, not a short-term scalp setup.
---
Bearish Scenario
The bearish scenario occurs if:
1. A valid weekly close below 3.20 USDT
2. The demand zone fails to absorb selling pressure
3. There is no impulsive bullish reaction from the yellow zone
Bearish Implications:
Demand breakdown → downside price discovery
Potential continuation targets:
2.50 USDT
1.90 USDT
Possible retest of the all-time base
In this case, the structure shifts into a macro bearish continuation, not merely a correction.
---
Conclusion
The 4.03 – 3.20 USDT zone is a make-or-break level for AR/USDT’s long-term structure.
Holding and reclaiming resistance → potential major trend reversal
Weekly breakdown below demand → bearish continuation
Price is currently in a decision zone, not an area for aggressive entries without confirmation.
#ARUSDT #Arweave #CryptoAnalysis #TechnicalAnalysis #WeeklyChart #DemandZone #SupportResistance #MarketStructure #TrendReversal #LongTermSetup
$AR After a 90% Dump… This Support Matters Most
📌This is a weekly (1W) long-term chart.Price saw a massive dump from around $50 → $4 📉
📌Important thing to notice 👀
✔️ This green zone is a strong support area
✔️ In the past, a massive pump started from this same zone
📌Current situation:
👉 Price is again touching the same support zone 🟩
👉 This area is very important for long-term direction
📌For bullish recovery:
✔️ Support zone must hold
✔️ Price needs a clean breakout above the descending trendline
📌If support holds + trendline breaks:
👉 Slow upside move possible 📈
👉 Long-term reversal structure can start
📌Final thought:
This is a wait & patience zone, not a rush trade.
Big moves always start from boring areas ⏳