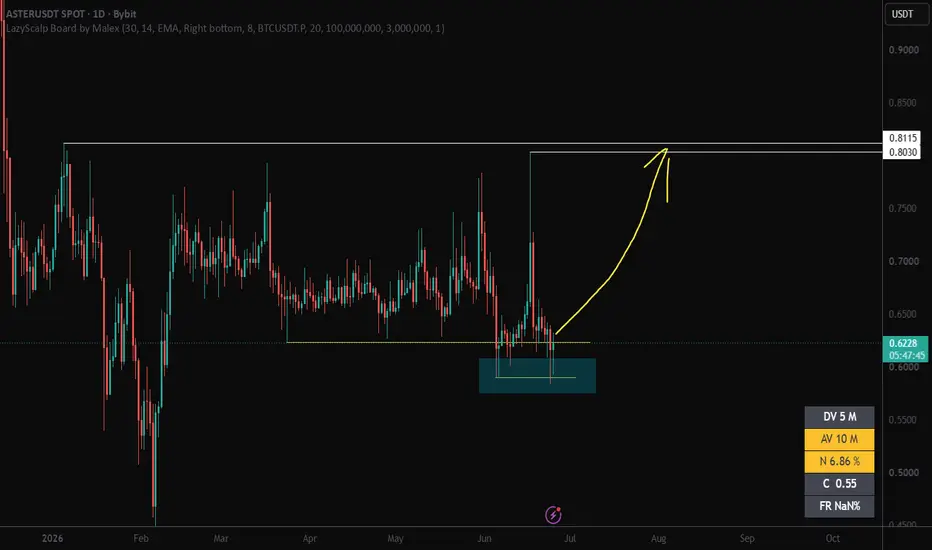
My $ASTER long has gone nowhere in 3 weeks, CLOSING now.I've been sitting in this SEED_WANDERIN_JIMZIP900:ASTER long for three weeks now, opened at $0.622, and it's time to make a decision.
So here's my view. On the daily chart, as far as crypto goes, this still looks very much like an accumulation phase, close to the bottom, and in my opinion it's one of the more interesting tickers out there. Especially considering the price has barely reacted to everything happening in the background - the escalation around the Strait of Hormuz, weakness in CRYPTOCAP:BTC , and weakness in XETR:HYPE , its biggest competitor in the decentralized exchange sector.
The RSI profile is dominated by bullish signals, with both regular and hidden bullish divergences.
If it wasn't for oil moving higher, I'd probably just sit patiently in the position. However, the risk of a broader market flush has increased significantly since June 25. Bitcoin looks increasingly likely to head below $60k, and a break below $57k could trigger an absolute bloodbath across altcoins.
SEED_WANDERIN_JIMZIP900:ASTER itself has broken below the uptrend line that had been in place since February on the daily chart. However, there has been virtually no bearish follow-through, which is the key point for me because it suggests the path of least resistance is still to the upside - the only question is when. Probably not before some form of de-escalation in Iran.
A recovery back above the trendline and a breakout above the green 200 MA ($0.67) would likely trigger a fast move higher. I'll be watching that very closely.
Below $0.575, things could get ugly very quickly.
So I'm closing the position for a tiny profit, or basically break-even once carrying costs are included. This simply isn't the environment for long positions in high-risk assets. Quite the opposite.
👽💙
In-depth trading ideas
ASTER REVENUE BULLISH RIGHT NOWSEED_WANDERIN_JIMZIP900:ASTER DEX is making good revenue now
According to data on DefiLlama, leading perps DEX ASTER has now generated good cumulative fees
It continues to lead the perps sector alongside HyperliquidX
Nearly 3 million SEED_WANDERIN_JIMZIP900:ASTER tokens have just been burned...
After announcing an upgraded tokenomic model which introduced a key deflationary element to SEED_WANDERIN_JIMZIP900:ASTER , Aster DEX has announced that 2,937,125.53 tokens have now been burned under the new model
The assets have a current market cap of nearly $2 million, the burned tokens coming from the team's allocation
Aster Chain Hits Huge Staking Milestone, Over 450M SEED_WANDERIN_JIMZIP900:ASTER is now staked across the Aster DEX, marking a significant expansion in network security and long-term collateral commitment.
Each staked unit directly backs the decentralized infrastructure, reinforcing the protocol’s sovereign validation layer.
This surge in participation reflects a high-conviction shift from active liquidity to yield-bearing security as the network matures.
$ASTER - Daily: LONG position going WELLSEED_WANDERIN_JIMZIP900:ASTER - Daily
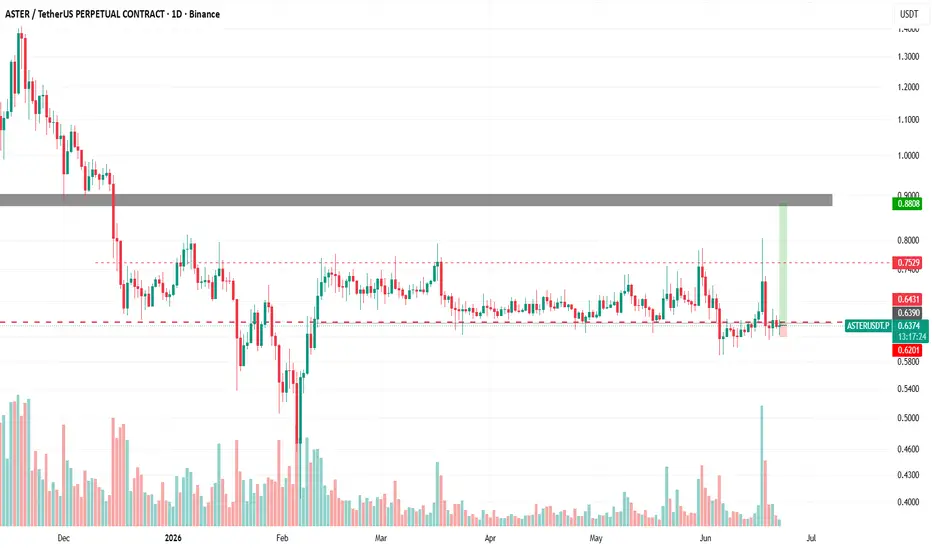
Quite an interesting position for a crypto asset. On the surface, nothing has really happened all year, but that's actually the most interesting part. SEED_WANDERIN_JIMZIP900:ASTER has reacted surprisingly well to crypto market selloffs, remaining relatively stable. To me, it still looks like it's trading around the bottom of an accumulation phase.
We're still far from a confirmed breakout, but it's worth noting the bullish RSI divergence and improving momentum profile.
TradingView automatically marked a bearish Rising Wedge in green, but I see it differently. To me, this looks much more like an Ascending Triangle that has been developing since the beginning of 2026. The upper resistance has been tested around 7-8 times, with multiple rejections near $0.80 (the wider grey box on the chart). That makes it look more like a bullish triangle, while price continues to crawl along the lower trendline and the horizontal support zone (the narrower grey box below).
The last screenshot is a zoom-in on the 4-hour timeframe, showing a breakout from an inverse Head & Shoulders pattern with a measured target around $0.69.
When does the bullish thesis lose its validity? A breakdown below the rising trendline would certainly weaken it, especially if this really is a rising wedge instead of a triangle. More importantly, though, I want to see $0.58 hold, as it represents the bottom of the potential accumulation range.
A bullish breakout from the $0.58-$0.80 accumulation range would project a technical target around $1.02 and confirm a much stronger bullish market structure. Below $0.58, the opposite becomes much more likely.
Fundamentally, I think this is one of the few crypto tokens that actually makes sense. It powers a decentralized exchange that could benefit if Binance continues reducing its presence in the EU. DEX trading volumes have been increasing over the past few weeks, and according to the attached DeFiLlama screenshots, the protocol is generating more than $1 million per week in fees.
Not financial advice - just my trading blog.
💙👽
ASTER USDT SHORT SIGNALASTER/USDT – Trade Setup (SHORT)
📈 Position Type: SHORT
🕒 Timeframe: 1 H
📊 Market: Futures
💰 Entry Zone:
0.6333
0.6485
🛑 Stop-Loss:
65.70
🎯 Take-Profit Targets:
• TP1: 0.6223
• TP2: 0.6123
• TP3: 0.6020
• TP4: 0.5806
TP5: 0.5677
TP6:
⚙️ Leverage:
5- 10
⚠️ After reaching TP1, move Stop-Loss to Entry Price.
📌 Risk Management:
Risk only 1–2% of your capital per trade.
Always confirm the setup on your chart before entry
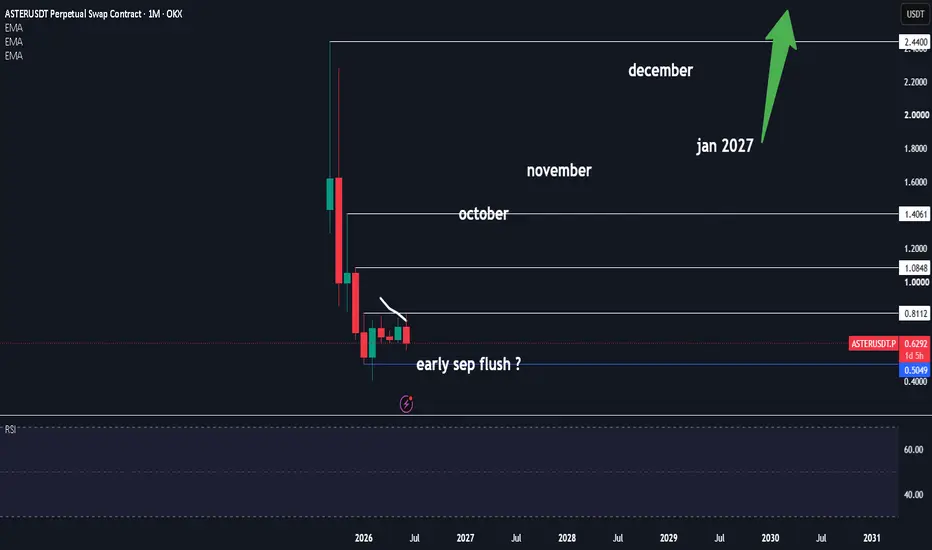
$ASter craziness pending6 months in surely 1 more capitulation or are we flipping this and then doing the mother of all manipulation and popping back hard
either way spot think of it as a buy and forget
long term always wins as long as the coin does not get delisted the money will magically appear and we shall go for a new ath
$4.40 still my personal target
$ASTER – Level Breakout IdeaThe idea previously didn't go according to script . To be exact, it started moving, but it missed the trendline I drew and ended up forming a double-touch level. I am still holding the asset in the spot market, waiting for a breakout of the levels and a potential trend reversal.
From what I see right now, it’s all about the structure. The asset pulled back and swept the liquidity in the green zone I highlighted. If you look at the H4 timeframe, there is a trendline there ready to be broken.
On the downside:
Highly manipulative asset: The market maker loves rinsing futures gamblers and hunts stops on both sides.
CZ's coin: Even though he claims he has nothing to do with it, we obviously don't believe him.
Aggressive market maker: The MM is so fierce that pumps get retraced within hours. I literally can't keep up with the action.
Either way, I’m still holding the asset.
ASTER LONG OPPORTUNITY 2nd Entry
As part of the broader narrative surrounding ecosystem expansion into the Perp DEX sector, ASTER has successfully formed a solid double bottom structure on the chart. A strong bullish continuation is expected from this base.
Stop 0.588
Target: 0.92 ~ 1.12
Just my personal opinion. Not financial advice—do your own research (DYOR)!
ASTER/USDT – Elliott Wave Analysis (Daily Time Frame)📊 ASTER/USDT – Elliott Wave Analysis (Daily Time Frame)
🔍 Current Market Structure
Based on the Elliott Wave count shown on the chart, ASTER appears to have completed a larger corrective ABC structure, with Wave C ending near the February low. Since then, price has been building a base and consolidating within a broad range, suggesting accumulation before the next impulsive move.
The preferred scenario is that ASTER is currently developing a new bullish impulsive sequence, where:
✅ Wave (1) has likely been completed.
✅ Wave (2) is currently unfolding as a corrective pullback.
⏳ Once Wave (2) is complete, the market should begin Wave (3), typically the strongest and most explosive wave in Elliott Wave theory.
⸻
🎯 Key Fibonacci Retracement Zone for Wave (2)
The current correction is targeting the Fibonacci retracement zone of Wave (1):
📌 38.2% Retracement: 0.6127
📌 50.0% Retracement: 0.5656
📌 61.8% Retracement: 0.5221
📌 78.6% Retracement: 0.4659
This entire area represents the preferred support zone where buyers may step in to complete Wave (2).
⸻
🚀 Bullish Elliott Wave Targets
If Wave (2) completes successfully and support holds, the next impulsive advance could target:
🎯 100% Extension: 1.1805
🎯 123.6% Extension: 1.3889
🎯 138.0% Extension: 1.5337
🎯 161.8% Extension: 1.8068
These levels represent potential objectives for Wave (3) and possibly higher degrees of trend continuation.
⸻
⚠️ Invalidation Level
For the bullish count to remain valid:
❌ Price should not sustain a breakdown below the 78.6% retracement area near 0.4659.
A deeper decline below this zone would reduce the probability of the current bullish Elliott Wave count and require a reassessment of the structure.
⸻
📈 Summary
✅ Larger ABC correction appears completed.
✅ Wave (1) likely finished.
⏳ Wave (2) correction currently in progress.
🚀 Major opportunity remains the anticipated Wave (3) advance.
📍 Watch the 0.61 – 0.46 support region closely for confirmation of a bullish reversal.
As long as ASTER remains above the Wave (2) support zone, the larger Elliott Wave outlook continues to favor higher prices and a potential move toward the 1.18 – 1.80 range over the coming months.
⚡ Patience is key. In Elliott Wave analysis, the highest reward often comes from waiting for Wave (2) to finish before positioning for Wave (3).
ASTERUSDT Forming Bullish MomentumASTERUSDT is forming a clear bullish momentum pattern, a classic bullish wave signal that often indicates an upcoming breakout. The price has been consolidating within a narrowing range, suggesting that selling pressure is weakening while buyers are beginning to regain control. With consistent volume confirming accumulation at lower levels, the setup hints at a potential bullish breakout soon. The projected move could lead to an impressive gain of around 30% to 40% once the price breaks above the wedge resistance.
This bullish momentum pattern is typically seen at the end of downtrends or corrective phases, and it represents a potential shift in market sentiment from bearish to bullish. Traders closely watching ASTERUSDT are noting the strengthening momentum as it nears a breakout zone. The healthy trading volume adds confidence to this pattern, showing that market participants are positioning early in anticipation of a reversal.
Investors’ growing interest in ASTERUSDT reflects rising confidence in the project's long-term fundamentals and current technical strength. If the breakout confirms with sustained volume, this could mark the start of a fresh bullish leg. The current market structure suggests that buyers are gradually gaining control while bearish pressure continues to weaken.
Traders might find this a valuable setup for medium-term gains, especially as the bullish momentum pattern completes and buying momentum accelerates. A successful breakout could attract additional interest from market participants and potentially drive the price toward significantly higher levels in the coming weeks.
✅ Show your support by hitting the like button!
✅ Leaving a comment below! (What is your opinion about this Coin?)
Your feedback and engagement keep me inspired to share more insightful market analysis with you!
ASTER PERPETUAL TRADE SELL SETUP Short from $0.77ASTER PERPETUAL TRADE
SELL SETUP
Short from $0.77
Currently $0.77
Targeting $0.7420 or Down
(Trading plan IF ASTER
go up to $0.81 will add more shorts)
Follow the notes for updates
In the event of an early exit,
this analysis will be updated.
Its not a Financial advice
$ASTER - liquidity sweep and potential upward move.I see sell-side liquidity sweeps from the bottom inside a massive consolidation. A breakout above the upper descending trendline is highly probable.
On the positive side, fundamentals are strengthening due to the Chainlink CCIP integration with Sony's Soneium network, though the major upcoming token unlock on June 17 remains a key negative and capping risk for now.
Aster (ASTER/USDT): 2H Outlook — Descending Channel BreakoutASTER ( SEED_WANDERIN_JIMZIP900:ASTER ) is showing a highly technical bullish reversal setup on the 2-hour (2H) timeframe. After drifting lower inside a well-defined descending parallel channel, the price action has executed a decisive breakout above the channel’s upper boundary. The market is currently undergoing a corrective pullback to validate underlying demand blocks, offering an excellent risk-to-reward long entry scenario within the premium Fibonacci parameters before the primary expansion leg kicks off.
The asset spent an extended period under intense selling pressure, bound strictly within a steep descending channel.
Buyers stepped up aggressively to spark an impulsive breakout candle, shifting the local market structure from a bearish markdown to a potential bullish markup phase.
The Strategy: The open short-to-mid term long position tool outlines a textbook entry built around catching the corrective retest.
Optimal Trade Entry (OTE): The entry range is focused directly within the Golden Pocket zone between the 0.618 Fib ($0.7096) and 0.705 Fib ($0.7264) levels, capitalizing on institutional order mitigation.
Aster Price Range Bound Long Trade Astar (ASTR) continues to trade around the Value Area Low (VAL) of its current trading range, a level that has acted as an important battleground between buyers and sellers throughout the recent consolidation phase. Price action has remained largely range-bound for an extended period, resulting in a prolonged phase of low volatility that often precedes a significant expansion in either direction.
At present, the loss of the Value Area Low is an important technical development, as it increases the probability of a deeper corrective move. If sellers maintain control below this level, the next major downside target sits near the daily support region around $0.047, which represents a key area where buyers may look to re-enter the market.
This support level will be crucial for determining the next phase of price action. A strong reaction from the $0.047 zone could trigger a recovery rally back toward higher resistance levels, allowing ASTR to continue trading within its broader range structure. However, failure to generate sufficient buying interest at support could open the door for an extended bearish move beyond the current range.
For now, traders should closely monitor how price behaves around daily support. While the short-term outlook has weakened following the loss of the Value Area Low, a successful defense of the $0.047 region could provide the catalyst needed for another rotation toward range highs. Until then, caution remains warranted as downside risk continues to increase.
ASTER NEXT BULL MARKET ANALYSIS.We still have June, July, Aug, Sep, and October bear market months (Bear market may end in Aug, we don't know, faster than expected or longer than expected ).
Aster was in a good place for accumulation for the next bull run.
If the price closes below 0.63 (weekly), we may allow more time for accumulation, as every pair must align with BTC and BTC.D price action for successful expansion.
My thesis was that we may go to another 1 or 2 months of accumulation to 0.5 to 0.55, or we may chop here, then break above and go for the targets above.
Both are good, but it usually takes 6 to 12 months.
My thesis would fail. I may be wrong.
Thank you.
DYOR