ASTRUSDT — Long at Demand Rejection [Quantum Algo]ASTR based out at the 0.00485 lows, then ran a strong recovery leg up to 0.00530 before pulling back. Price retraced into a demand shelf near 0.005200 and held, firing the Buy. This is a continuation long: the recovery built a clean sequence of higher lows, and the play is to buy the pullback into demand and ride the next leg back toward the range highs.
Why this setup works — three confluences:
Demand rejection on the pullback. Price pulled back into the demand zone and held instead of breaking down. This is where buyers step back in — the Buy printed on the tap, giving a defined floor to lean risk against rather than chasing the top of the recovery.
Higher-low structure intact. The move off 0.00485 is a clean staircase of higher lows and higher highs. Buying this pullback sits with the dominant short-term direction, joining momentum rather than fighting it.
Open room back to the highs. Above entry the chart is clean up toward the 0.005443 zone, the last swing high and the logical draw. Defined risk below demand, asymmetric room up to structure.
Trade management:
Entry: 0.005221 (rejection off demand)
SL: 0.005025 (below the demand shelf)
TP1: 0.005350 — take 50% off, move stop to breakeven
TP2: 0.005443 — 100% exit at the range highs
R:R: ~1.1:1 to full target
Invalidation:
A 2h close back below 0.005025. That breaks the demand shelf and the higher-low sequence — sellers reclaim control, continuation thesis dead, just out.
The lesson:
Buying the pullback beats chasing the recovery. When a market bases out and runs a clean leg of higher lows, the disciplined entry is where price retraces into demand — not at the top where you're paying up and stopping into every wick. Let price come back to the level, wait for the hold, and set your risk below structure so a failed continuation costs one clean R.
Signal fired. We took it. Update coming.
Disclaimer: Not financial advice. This idea is shared for educational purposes only. Trading leveraged instruments carries substantial risk. Past performance is not indicative of future results. Always do your own research and manage your own risk.
In-depth trading ideas
ASTR 4H Analysis | Downtrend → Exhaustion → CompressionIt’s less about a comeback and more about survival and finding where the market floor actually is
Let’s break it down like before — but deeper
1️⃣ Daily Structure — Big Picture
First thing that stands out:
Lower highs over and over
Lower lows over and over
All three MAs are bearish
And more importantly:
MA28 < MA58 < MA128
📌 This is exactly the alignment you usually give the most weight to.
Translation:
Short-term, mid-term, and long-term trends are all aligned to the downside.
2️⃣ Price vs Moving Averages
Current price ≈ 0.00508
While:
MA28 → around 0.00564
MA58 → around 0.00699
MA128 → around 0.00737
Price is sitting far below the averages
That usually means two things:
The trend is very weak
The market has stretched far from its averages and may enter a cooling-off phase
But this still doesn’t count as a reversal
3️⃣ The Area Price Is Standing On Right Now
Recent low:
📍 0.00488 Price is basically sitting right on top of that level
What’s interesting:
After that aggressive sell-off, the market isn’t dropping with the same momentum anymore.
Candles got smaller.
📌 Meaning:
Sellers still have control
But the selling pressure is slowing down
4️⃣ That Volume Spike
Look at that big volume spike in mid-June
Then what happened?
Price couldn’t recover
Usually that points to one of two things:
Distribution or Capitulation without follow-through
Right now, because recovery has been weak, it looks closer to distribution
5️⃣ Short-Term Structure
There is one small positive sign:
After the recent drop:
0.00488 → 0.0053
No new low has formed yet.
But— We still don’t have a Higher High And that’s the important line
6️⃣ Scenarios
🔴 Main scenario (for now)
If 0.00488 breaks, There’s a lot of empty space below
That’s where price starts exploring lower levels
🟢 Recovery scenario
First real sign:
Reclaim above:
📍 0.0056 (MA28) Then📍 0.0070
And only after that📍 0.0087
Until then, any rally looks more like a relief rally
7️⃣ What I’m Seeing Right Now
For me, this isn’t an attractive long
And it’s not an attractive short either
Because, Shorting after such a big drop carries risk
Long still has no confirmation
Structurally:
Downtrend → Exhaustion → Compression
But still, Reversal ❌
8️⃣ Final Take
Macro trend: Bearish
Momentum: Weak
Current floor: 0.00488
First resistance: 0.0056
Major resistance: 0.0070
Real trend change: Above 0.0087
And one thing I’d pay attention to Don’t look for “cheap.”
Look for “structure change.”
⚠️ Risk Alert ⚠️
Futures are not beginner-friendly. These triggers require solid experience.
Before using them, study risk management and practice with the learning content here.
#CHRUSDT READY TO NEW EXPLODE !#ASTR
The price is moving within a descending channel on the 1-hour timeframe and has reached the lower boundary. It is now poised for a bounce and is expected to retest this boundary.
The Relative Strength Index (RSI) indicates a downward trend, which is likely to continue given the overbought conditions.
There is a key support zone in green at 0.004650. The price has bounced off this zone several times, making it a strong support level.
The price is trending towards the 100-period moving average, which we are approaching. This trend supports an upward move.
Entry Price: 0.005380
Target 1: 0.005592
Target 2: 0.005811
Target 3: 0.006072
Stop Loss: At the resistance zone in green
Remember this simple rule: Money management.
Any questions? Please leave a comment.
Thank you.
ASTR/USDT — Long After Capitulation Spike [Quantum Algo]ASTRUSDT Perpetual
Context:
ASTR has been in a brutal downtrend for weeks — grinding from the highs all the way to the recent lows. But the price action just changed. A massive capitulation wick swept the lows with high volume and reversed instantly. After the recovery from that spike, price has built a small consolidation and a Buy signal has fired at the demand zone.
Why this setup works — three confluences:
Capitulation spike with V-recovery — the long lower wick is the signature of capitulation. Sellers dumped, took out all the stops below, and buyers stepped in aggressively to absorb the supply. When you see that pattern followed by an impulsive recovery, the bottom is often in. The market has flushed the weak hands
Higher low after liquidity sweep — the lows that were swept on the capitulation candle were never revisited. Price has formed a higher low above that wick — the earliest structural sign of a trend shift. As long as that wick low holds, the reversal thesis is alive
Buy signal at the consolidation base — the signal didn't fire during the panic. It waited for the recovery to confirm, the consolidation to form, and the retest of the demand zone to complete. Smart execution — entering after the chaos, not during it
A Buy signal fired at the demand zone. We took it.
Trade management:
Entry: at the demand zone
Stop Loss: below the capitulation wick low
TP1: at the mid-range resistance — 50% off, stop to breakeven
TP2: at the upper recovery target for 100% exit
R:R: Strong asymmetric reward — tight stop below the swept low, full recovery range above as runway.
Invalidation: Close below the capitulation wick low — the bottom failed and sellers regained control.
The lesson:
Capitulation candles are gifts from the market. Massive volume, long wicks, fast reversals — these are the moments when sellers fully exhaust themselves and institutions step in to load. Most traders see the spike and panic short. The disciplined approach is recognizing the pattern, waiting for confirmation, and entering on the retest of the demand zone with a defined stop below the wick. The best longs often come after the worst-looking candles.
Signal fired. We took it. Update coming.
⚠️ Disclaimer: This is not financial advice. Trade ideas shared here are for educational and informational purposes only. All trading involves risk — past performance does not guarantee future results. Always do your own research and manage your risk accordingly.
ASTR (SPOT - Investment)
BINANCE:ASTRUSDT
ASTR / USDT
Entry range (0.0100- 0.0118)
SL 1D close below 0.0092
T1 0.0200
T2 0.0300
T3 0.0400
T4 0.0600
T5 0.0800
_______________________________________________________
Golden Advices.
********************
* collect the coin slowly in the entry range.
* Please calculate your losses before the entry.
* Do not enter any trade you find it not suitable for you.
* No FOMO - No Rush , it is a long journey.
ASTRUSDT 1D#ASTR is trading within a descending channel on the daily chart and is currently facing resistance from both the Ichimoku cloud and the channel resistance. Wait for a clean breakout above these levels before entering. If confirmed, the potential upside targets are:
🎯 $0.01227
🎯 $0.01397
🎯 $0.01535
🎯 $0.01673
🎯 $0.01869
🎯 $0.02119
⚠️ Always apply tight stop-losses and maintain strict risk management.
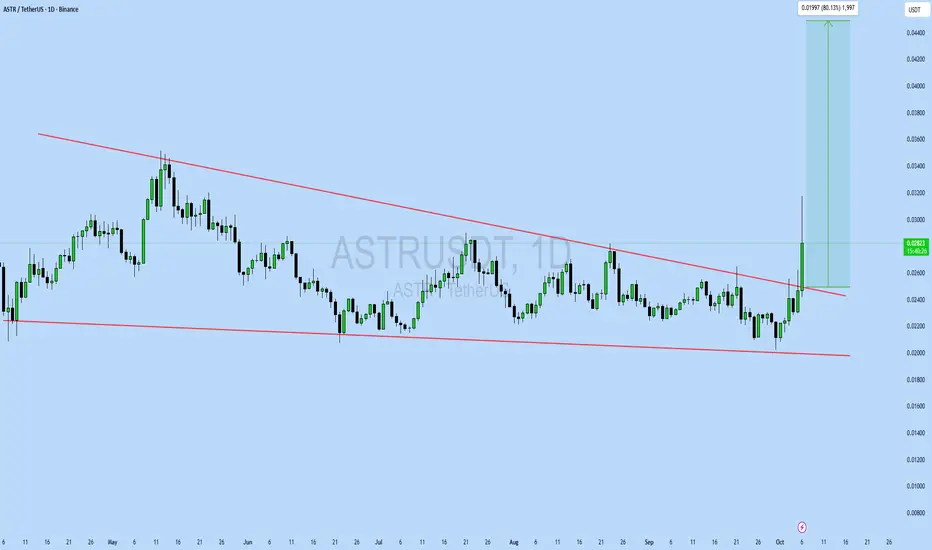
ASTRUSDT Forming Falling WedgeASTRUSDT is forming a clear falling wedge pattern, a classic bullish reversal signal that often indicates an upcoming breakout. The price has been consolidating within a narrowing range after the recent decline, suggesting that selling pressure is steadily weakening while buyers are quietly stepping in to regain control. With consistent volume confirming accumulation at these lower levels, the setup is pointing toward a potential bullish breakout in the near term. If the price breaks decisively above the wedge resistance, the projected move could deliver an impressive gain of around 90% to 100% from the breakout point.
This falling wedge pattern is typically seen at the end of downtrends or during corrective phases, and it serves as a strong sign that market sentiment may be shifting from bearish to bullish. Traders closely watching ASTRUSDT are observing a similar strengthening momentum as it approaches its own breakout zone. The healthy trading volume supporting the pattern adds real confidence, showing that market participants are getting positioned early in anticipation of a reversal.
The growing interest in ASTRUSDT is fueled by increasing belief in the project’s long-term fundamentals combined with this attractive technical structure. A confirmed breakout backed by sustained volume could trigger the start of a fresh bullish leg. Traders might view this as a compelling setup for medium-term gains, especially once the wedge pattern fully resolves and buying pressure starts to accelerate.
✅ Show your support by hitting the like button and
✅ Leaving a comment below! (What is your opinion about this Coin)
Your feedback and engagement keep me inspired to share more insightful market analysis with you!
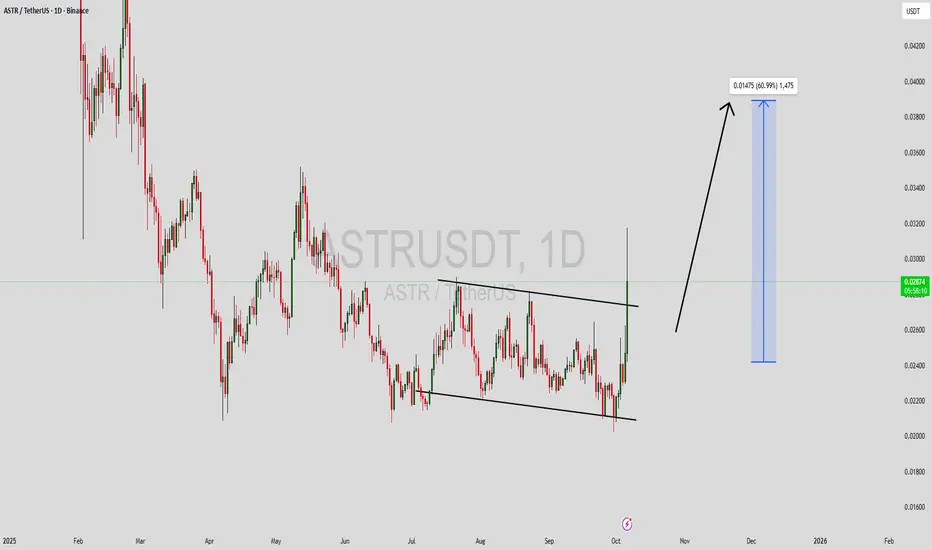
ASTRUSDT Forming Falling WedgeASTRUSDT is forming a well-defined falling wedge pattern on the chart, a bullish setup that often signals an upcoming reversal after a period of downward consolidation. The narrowing price action suggests that sellers are losing momentum while buyers are gradually stepping in. This setup becomes even more convincing with the presence of good trading volume, which indicates that investors are accumulating positions in anticipation of a potential breakout. If the resistance trendline is breached, ASTRUSDT could experience a sharp move upward, with gains estimated in the 50% to 60% range.
The falling wedge is one of the most reliable bullish reversal patterns, and ASTRUSDT’s price structure fits it perfectly. Each dip has been met with increasing buying pressure, showing that the market sentiment is shifting from bearish to bullish. A confirmed breakout above the wedge could trigger a significant rally, supported by strong investor interest and improving market liquidity. Traders are closely watching this zone for a breakout confirmation to ride the next bullish wave.
Investor activity around ASTRUSDT has been rising, reflecting growing optimism in the project’s fundamentals and the broader crypto recovery trend. With technical indicators aligning for a bullish reversal and volume supporting the move, ASTRUSDT may soon enter a new phase of momentum-driven growth. This setup presents an attractive opportunity for traders looking to capitalize on a mid-term rally as the market regains strength.
✅ Show your support by hitting the like button and
✅ Leaving a comment below! (What is You opinion about this Coin)
Your feedback and engagement keep me inspired to share more insightful market analysis with you!
ASTRUSDT Forming Falling WedgeASTRUSDT is forming a well-defined falling wedge pattern on the chart, a bullish setup that often signals an upcoming reversal after a period of downward consolidation. The narrowing price action suggests that sellers are losing momentum while buyers are gradually stepping in. This setup becomes even more convincing with the presence of good trading volume, which indicates that investors are accumulating positions in anticipation of a potential breakout. If the resistance trendline is breached, ASTRUSDT could experience a sharp move upward, with gains estimated in the 50% to 60% range.
The falling wedge is one of the most reliable bullish reversal patterns, and ASTRUSDT’s price structure fits it perfectly. Each dip has been met with increasing buying pressure, showing that the market sentiment is shifting from bearish to bullish. A confirmed breakout above the wedge could trigger a significant rally, supported by strong investor interest and improving market liquidity. Traders are closely watching this zone for a breakout confirmation to ride the next bullish wave.
Investor activity around ASTRUSDT has been rising, reflecting growing optimism in the project’s fundamentals and the broader crypto recovery trend. With technical indicators aligning for a bullish reversal and volume supporting the move, ASTRUSDT may soon enter a new phase of momentum-driven growth. This setup presents an attractive opportunity for traders looking to capitalize on a mid-term rally as the market regains strength.
✅ Show your support by hitting the like button and
✅ Leaving a comment below! (What is You opinion about this Coin)
Your feedback and engagement keep me inspired to share more insightful market analysis with you!
ASTRUSDT UPDATE#ASTR
UPDATE
ASTR Technical Setup
Pattern: Bullish falling wedge pattern
Current Price: $0.075
Target Price: $0.135
Target % Gain: 80.27%
RUS:ASTR is breaking out of a falling wedge pattern on the 1D timeframe. Current price is $0.075 with a target near $0.135, showing about 80% potential upside. The breakout highlights renewed bullish momentum with structure favoring further continuation. Always use proper risk management.
Time Frame: 1D
Risk Management Tip: Always use proper risk management.
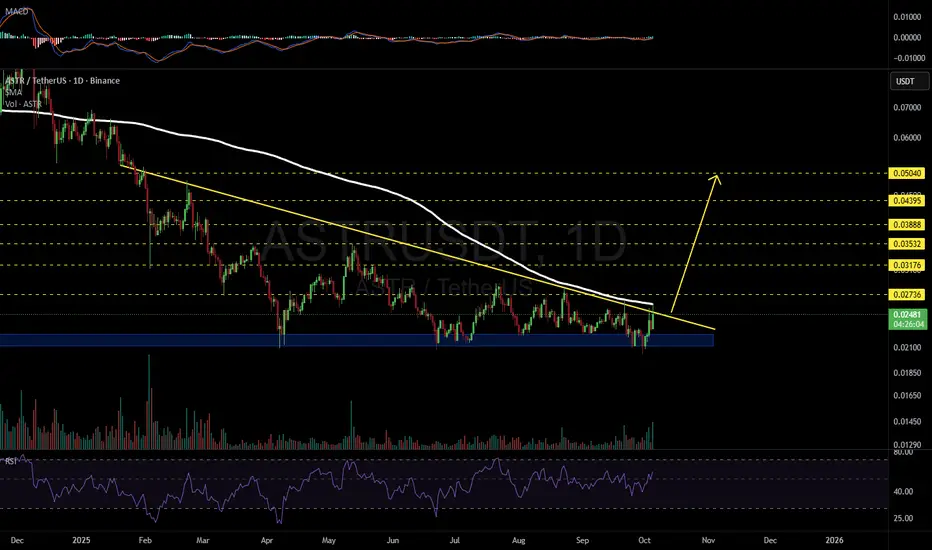
ASTRUSDT 1D#ASTR is trading within a descending triangle on the daily chart and is on the verge of breaking out above the triangle resistance and the daily SMA200. If that happens, the potential targets are:
🎯 $0.02736
🎯 $0.03176
🎯 $0.03532
🎯 $0.03888
🎯 $0.04395
🎯 $0.05040
⚠️ Always remember to use a tight stop-loss and maintain proper risk management.
Is ASTR About to Break Out or Break Down? Don’t Miss ItYello Paradisers! Are you positioned correctly, or will you once again find yourself on the wrong side of the market when the real move begins? If you’ve been with us, you know we’ve been waiting for this kind of setup with patience, and now it's time to pay attention.
💎#ASTR/USDT has been moving inside a clean descending channel, respecting both the upper resistance and lower support lines consistently. However, recent price action suggests a potential shift in momentum. After tapping into the strong demand zone between 0.0200 and 0.0215, the price has shown multiple sharp rejections from the lows, indicating that buyers are quietly stepping in.
💎Currently, the price is attempting to break out of the descending structure. We are closely watching how it reacts around the 0.0240 area, which is now acting as probable support. A successful retest of this level would be a significant structural shift, and it opens up the path to retest 0.0280 our first minor resistance. If momentum continues to build and that level breaks, the doors are wide open toward the 0.0310–0.0320 zone, with the final strong resistance sitting around 0.0345.
💎On the flip side, invalidation occurs if the price fails to hold above 0.0210. A clean break below that level could send #ASTR back toward 0.0190, nullifying the current bullish setup. Until then, we remain cautiously optimistic, waiting for the market to confirm direction before committing fully.
Stay sharp, Paradisers. The market is about to pick a side and we’ll be on the right one.
MyCryptoParadise
iFeel the success🌴
$ASTRUSDT Breakout Setup$ASTRU is attempting a breakout from its downtrend on the 6H chart.
Price is pushing above the descending trendline, supported by a bullish MACD crossover.
If the breakout holds, the next target is around $0.035061, with a stop below $0.025490.
Momentum looks promising for further upside.
ASTRUSDT | Don’t Let the Altcoin Euphoria Fool YouI know it’s tempting to believe every altcoin will rally just because the majors are flying. But ASTRUSDT isn’t giving us that story yet .
The red boxes are acting as firm resistance levels. If price reclaims and retests them, we can reframe them as support. Until then, I remain cautious .
Most traders get trapped here , expecting miracles from weak structures. That’s how portfolios bleed slowly.
“I will not insist on my short idea. If the levels suddenly break upwards and do not give a downward break in the low time frame, I will not evaluate it. If they break upwards with volume and give a retest, I will look long.”
If you’re with me, you’re thinking differently. And that’s what separates consistent winners from the crowd.
📌I keep my charts clean and simple because I believe clarity leads to better decisions.
📌My approach is built on years of experience and a solid track record. I don’t claim to know it all but I’m confident in my ability to spot high-probability setups.
📌If you would like to learn how to use the heatmap, cumulative volume delta and volume footprint techniques that I use below to determine very accurate demand regions, you can send me a private message. I help anyone who wants it completely free of charge.
🔑I have a long list of my proven technique below:
🎯 ZENUSDT.P: Patience & Profitability | %230 Reaction from the Sniper Entry
🐶 DOGEUSDT.P: Next Move
🎨 RENDERUSDT.P: Opportunity of the Month
💎 ETHUSDT.P: Where to Retrace
🟢 BNBUSDT.P: Potential Surge
📊 BTC Dominance: Reaction Zone
🌊 WAVESUSDT.P: Demand Zone Potential
🟣 UNIUSDT.P: Long-Term Trade
🔵 XRPUSDT.P: Entry Zones
🔗 LINKUSDT.P: Follow The River
📈 BTCUSDT.P: Two Key Demand Zones
🟩 POLUSDT: Bullish Momentum
🌟 PENDLEUSDT.P: Where Opportunity Meets Precision
🔥 BTCUSDT.P: Liquidation of Highly Leveraged Longs
🌊 SOLUSDT.P: SOL's Dip - Your Opportunity
🐸 1000PEPEUSDT.P: Prime Bounce Zone Unlocked
🚀 ETHUSDT.P: Set to Explode - Don't Miss This Game Changer
🤖 IQUSDT: Smart Plan
⚡️ PONDUSDT: A Trade Not Taken Is Better Than a Losing One
💼 STMXUSDT: 2 Buying Areas
🐢 TURBOUSDT: Buy Zones and Buyer Presence
🌍 ICPUSDT.P: Massive Upside Potential | Check the Trade Update For Seeing Results
🟠 IDEXUSDT: Spot Buy Area | %26 Profit if You Trade with MSB
📌 USUALUSDT: Buyers Are Active + %70 Profit in Total
🌟 FORTHUSDT: Sniper Entry +%26 Reaction
🐳 QKCUSDT: Sniper Entry +%57 Reaction
📊 BTC.D: Retest of Key Area Highly Likely
📊 XNOUSDT %80 Reaction with a Simple Blue Box!
📊 BELUSDT Amazing %120 Reaction!
📊 Simple Red Box, Extraordinary Results
I stopped adding to the list because it's kinda tiring to add 5-10 charts in every move but you can check my profile and see that it goes on..
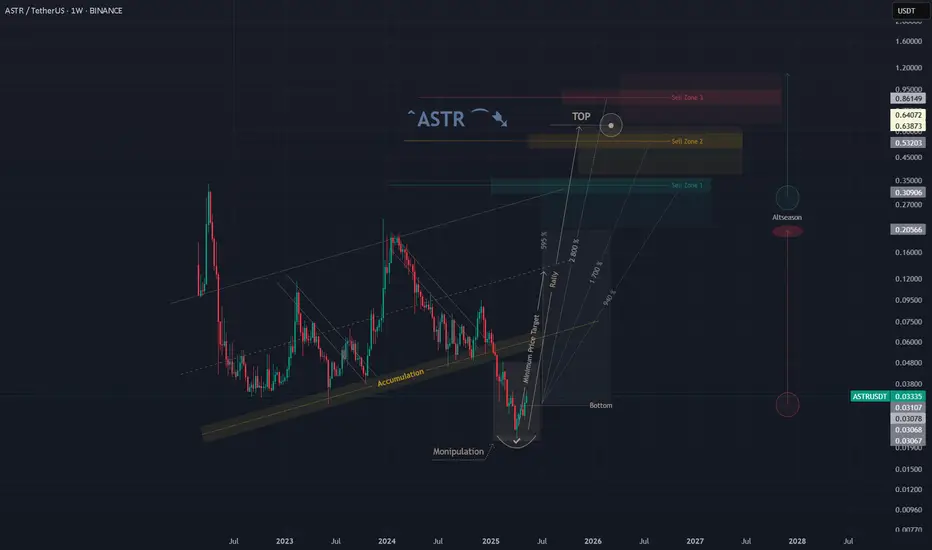
ASTR/USDT 1W🌱 RUS:ASTR ⁀➷
#AstarNetwork. Macro chart Another
🌴 Intermediate Target - $0.20
🍃 Macro Target 1 - $0.30
🍃 Macro Target 2 - $0.53
🍃 Macro Target 3 - $0.86
- Not financial advice, trade with caution.
#Crypto #AstarNetwork #ASTR #Investment
✅ Stay updated on market news and developments that may influence the price of Astar Network. Positive or negative news can significantly impact the cryptocurrency's value.
✅ Exercise patience and discipline when executing your trading plan. Avoid making impulsive decisions driven by emotions, and adhere to your strategy even during periods of market volatility.
✅ Remember that trading always involves risk, and there are no guarantees of profit. Conduct thorough research, analyze market conditions, and be prepared for various scenarios. Trade only with funds you can afford to lose and avoid excessive risk-taking.
ASTR Buy/Long Setup (12H)Two major trigger lines have been broken, and the price is currently sitting at a key level.
A bullish CH (Change of Character) is visible on the chart.
If the demand zone holds, the price may move toward the targets marked on the chart.
A daily candle closing below the invalidation level will invalidate this analysis.
Do not enter the position without capital management and stop setting
Comment if you have any questions
thank you
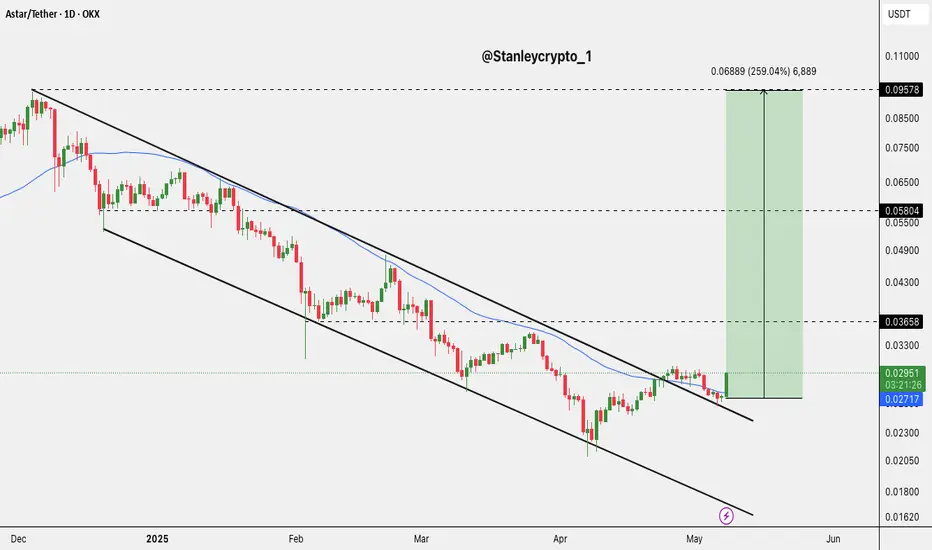
Astar Token 867% Easy, Classic Bullish Signals —2025 Bull MarketThis chart is very interesting because it has a long-term signal based on a repeating pattern. We are looking at Astar Token (ASTRUSDT).
There is a "bottom" in June 2023 followed by a break above EMA55 on the daily timeframe. This immediately predicts a mid-term bullish cycle.
There is one final drop below EMA55 ending in a higher low followed by a recovery and the expected bullish wave.
Fast forward and transport yourself to this present day.
Astar Token (ASTRUSDT) produced a "bottom" in April 2025. Now we are seeing a confirmed break above EMA55. Here is what is likely to happen next.
There can be a drop ending in a higher low followed by a strong bullish cycle. That's it. Plain and simple.
If the action moves back below EMA55, this is not a problem because the 7-April low will remain intact. In fact, if prices move lower, this is an opportunity to buy and reload.
Each time there is a correction or a retrace this is an opportunity to buy your favorite Altcoins as much as you want. Because the market is set to grow long-term.
The targets shown on the chart are easy targets. Low risk vs a high potential for reward.
The first target can hit within 2 months, or less; while the second target can hit within 3-5 months.
Prepare for the 2025 bull market. We are only weeks away from very strong bullish momentum all across Crypto. Late May 2025 it will be obvious for everybody. If you are reading this, you are early. Being early is a lifetime event. Not many people get to enjoy a new, growing and thriving financial market, lives can be forever changed. With the right action at the right time, with the right guidance and mindset.
Follow me if you enjoy the content. New charts every single day.
Namaste.
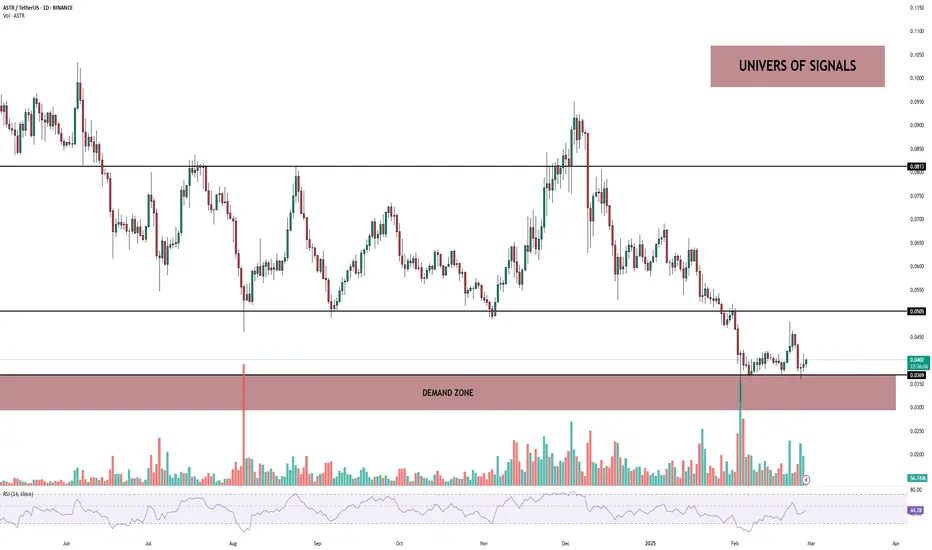
UNIVERS OF SIGNALS| ASTR: Key Support Levels and Market Momentum👋 Welcome to UNIVERS OF SIGNALS !
In this analysis, I want to review ASTR, one of the coins in the Ethereum ecosystem, currently ranked 159th on CoinMarketCap with a market cap of $297 million.
📅 Daily Timeframe
On the daily timeframe, as you can see, the price is in a long-term downtrend. The first bearish leg started from the $0.1907 high and moved down to the $0.0505 level. After this move, the price formed a consolidation box between $0.0505 and $0.0813. Once $0.0505 was broken, the price dropped further to the key support at $0.0369.
⚡️ As highlighted on the chart, there is a critical demand zone near the $0.0369 level. If the price breaks below this zone, it could register a new all-time low (ATL), which could put serious pressure on the project’s outlook.
📊 As observed, market volume within the consolidation box was decreasing. However, after the breakout, volume increased. Now that the price is ranging again, volume is dropping once more. If RSI enters the oversold zone and breaks below the 30 level, the likelihood of breaking $0.0369 significantly increases, which could trigger a strong downward momentum, leading the price toward new lower targets.
📈 On the bullish side, if the $0.0369 support holds and pushes the price upward, the first long trigger we can consider is $0.0505. We can also confirm bullish momentum from RSI if it breaks above 54.14.
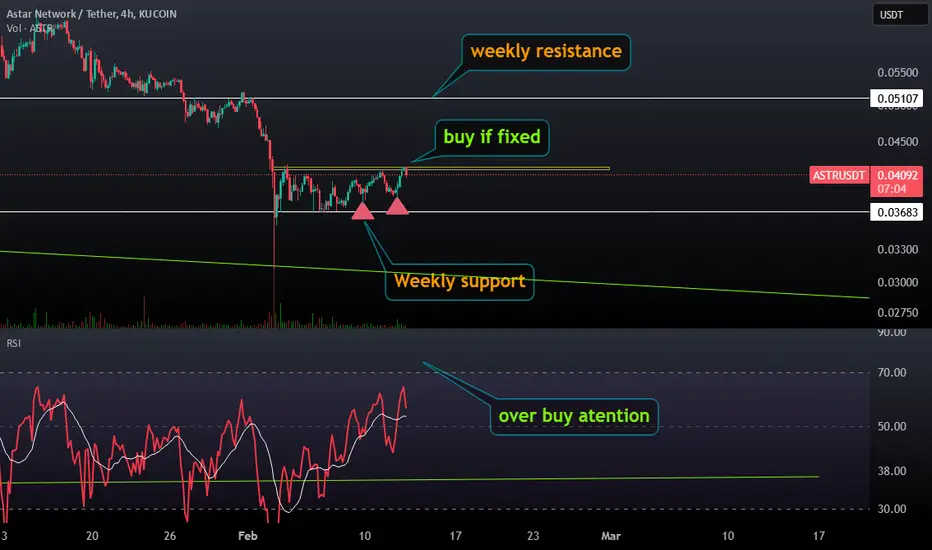
⏳ 4-Hour Timeframe
Now, let’s examine the 4-hour timeframe for a more detailed view of price action. As you can see, the price has formed a ranging box between $0.0369 and $0.0499.
🧲 At one point, the price attempted to break above this range, even forming a higher high and higher low, but failed. After a fake breakout, a double top pattern was confirmed, and when the neckline broke, the price moved downward, reaching the $0.0369 zone once again.
✅ This $0.0369 level remains crucial, as it could keep the price in the current range or push it upward once again.
🧩 However, as seen on the chart, green candles have significantly lower volume than red candles, indicating that bears still dominate the market. The possibility of breaking below this support remains high.
📉 For short positions, the break of $0.0369 would be a strong confirmation. However, keep in mind that below this level lies a strong demand zone, meaning that a reversal could happen at any time. It’s crucial to manage risk carefully when entering shorts.
🔼 For long positions, assuming the previous bullish move was a fake breakout, a break above $0.0419 would be a reasonable entry. However, a more secure long trigger would be at $0.0456.
📝 Final Thoughts
This analysis reflects our opinions and is not financial advice.
Share your thoughts in the comments, and don’t forget to share this analysis with your friends! ❤️
TradeCityPro | ASTR: Key Support Levels and Market Momentum👋 Welcome to TradeCity Pro!
In this analysis, I want to review ASTR, one of the coins in the Ethereum ecosystem, currently ranked 159th on CoinMarketCap with a market cap of $297 million.
📅 Daily Timeframe
On the daily timeframe, as you can see, the price is in a long-term downtrend. The first bearish leg started from the $0.1907 high and moved down to the $0.0505 level. After this move, the price formed a consolidation box between $0.0505 and $0.0813. Once $0.0505 was broken, the price dropped further to the key support at $0.0369.
⚡️ As highlighted on the chart, there is a critical demand zone near the $0.0369 level. If the price breaks below this zone, it could register a new all-time low (ATL), which could put serious pressure on the project’s outlook.
📊 As observed, market volume within the consolidation box was decreasing. However, after the breakout, volume increased. Now that the price is ranging again, volume is dropping once more. If RSI enters the oversold zone and breaks below the 30 level, the likelihood of breaking $0.0369 significantly increases, which could trigger a strong downward momentum, leading the price toward new lower targets.
📈 On the bullish side, if the $0.0369 support holds and pushes the price upward, the first long trigger we can consider is $0.0505. We can also confirm bullish momentum from RSI if it breaks above 54.14.
⏳ 4-Hour Timeframe
Now, let’s examine the 4-hour timeframe for a more detailed view of price action. As you can see, the price has formed a ranging box between $0.0369 and $0.0499.
🧲 At one point, the price attempted to break above this range, even forming a higher high and higher low, but failed. After a fake breakout, a double top pattern was confirmed, and when the neckline broke, the price moved downward, reaching the $0.0369 zone once again.
✅ This $0.0369 level remains crucial, as it could keep the price in the current range or push it upward once again.
🧩 However, as seen on the chart, green candles have significantly lower volume than red candles, indicating that bears still dominate the market. The possibility of breaking below this support remains high.
📉 For short positions, the break of $0.0369 would be a strong confirmation. However, keep in mind that below this level lies a strong demand zone, meaning that a reversal could happen at any time. It’s crucial to manage risk carefully when entering shorts.
🔼 For long positions, assuming the previous bullish move was a fake breakout, a break above $0.0419 would be a reasonable entry. However, a more secure long trigger would be at $0.0456.
📝 Final Thoughts
This analysis reflects our opinions and is not financial advice.
Share your thoughts in the comments, and don’t forget to share this analysis with your friends! ❤️