AUDCAD: Confirmed CHoCH 🇦🇺🇨🇦
I see a valid bearish change of character on AUDCAD on a 4h time frame
after the recent test of a significant intraday/daily resistance.
The price will likely continue falling after a pullback.
Goal - 0.9812
❤️Please, support my work with like, thank you!❤️
I am part of Trade Nation's Influencer program and receive a monthly fee for using their TradingView charts in my analysis.
Australian Dollar/Canadian Dollar
No trades
No trades
In-depth trading ideas
Aussie Rolls Over as Soft CPI Kills RBA-Hike BetsThe Australian dollar is the weakest FX major thanks to CPI not being as hot as expected. While we cannot exactly call the 3.6% trimmed mean print weak, its enough to cull bets of an RBA hike in August and raises the prospects of a terminal rate at 4.35%. I look at AUD/USD levels and market positioning ahead of today's FOMC meeting.
MS
AUDCAD 4H – Bearish BiasHello Trading Fam! 👋
The overall trend is bearish. Price is retesting a key resistance zone and descending trendline. Wait for bearish confirmation before entering short positions, targeting the next support level.
Don’t forget to like and share your thoughts in the comments! ❤️
AUDCAD H4 | Bearish Reaction Off Pullback ResistanceMomentum: Bearish
Price is currently below the ichimoku cloud.
Sell entry: 0.98318
- Pullback resistance
- 61.8% Fib retracement
- 100% Fib projection
Stop Loss: 0.98733
- Swing high resistance
Take Profit: 0.97647
- Swing low support
High Risk Investment Warning
Stratos Markets Limited (fxcm.com/uk), Stratos Europe Ltd (fxcm.com/eu):
CFDs are complex instruments and come with a high risk of losing money rapidly due to leverage. 65% of retail investor accounts lose money when trading CFDs with this provider. You should consider whether you understand how CFDs work and whether you can afford to take the high risk of losing your money.
Stratos Global LLC (fxcm.com/en): Losses can exceed deposits.
Please be advised that the information presented on TradingView is provided to FXCM (‘Company’, ‘we’) by a third-party provider (‘TFA Global Pte Ltd’). Please be reminded that you are solely responsible for the trading decisions on your account. Any information and/or content is intended entirely for research, educational and informational purposes only and does not constitute investment or consultation advice or investment strategy. The information is not tailored to the investment needs of any specific person and therefore does not involve a consideration of any of the investment objectives, financial situation or needs of any viewer that may receive it. Past performance is not a reliable indicator of future results. Actual results may differ materially from those anticipated in forward-looking or past performance statements. We assume no liability as to the accuracy or completeness of any of the information and/or content provided herein and the Company cannot be held responsible for any omission, mistake nor for any loss or damage including without limitation to any loss of profit which may arise from reliance on any information supplied by TFA Global Pte Ltd.
Stratos Trading Pty. Limited (fxcm.com/au):
Trading FX/CFDs carries significant risks. FXCM AU (AFSL 309763), please read the Financial Services Guide, Product Disclosure Statement, Target Market Determination and Terms of Business at fxcm.com/au
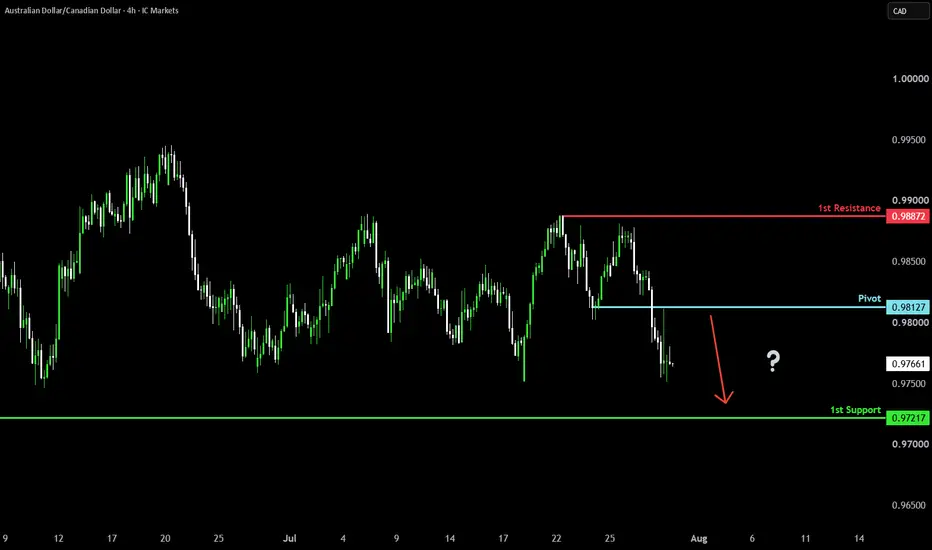
Sellers step In at pullback resistance?AUD/CAD is rising toward the pivot, which is a pullback resistance, and could reverse toward the pullback support.
Pivot: 0.98127
1st Support: 0.97217
1st Resistance: 0.98872
Disclaimer:
The opinions given above constitute general market commentary and do not constitute the opinion or advice of IC Markets or any form of personal or investment advice.
Any opinions, news, research, analyses, prices, other information, or links to third-party sites contained on this website are provided on an "as-is" basis, are intended to be informative only, and are not advice, a recommendation, research, a record of our trading prices, an offer of, or solicitation for, a transaction in any financial instrument and thus should not be treated as such. The information provided does not involve any specific investment objectives, financial situation, or needs of any specific person who may receive it. Please be aware that past performance is not a reliable indicator of future performance and/or results. Past performance or forward-looking scenarios based upon the reasonable beliefs of the third-party provider are not a guarantee of future performance. Actual results may differ materially from those anticipated in forward-looking or past performance statements. IC Markets makes no representation or warranty and assumes no liability as to the accuracy or completeness of the information provided, nor any loss arising from any investment based on a recommendation, forecast, or any information supplied by any third party.
Bearish reversal setup?AUD/CAD is rising to the resistance level, which is an overlap resistance and could reverse from this level to our take-profit.
Entry: 0.9842
Why we like it:
There is an overlap resistance level.
Stop loss: 0.98701
Why we like it:
There is a pullback resistance level.
Take profit: 0.98018
Why we like it:
There is a pullback support level.
Enjoying your TradingView experience? Review us!
Please be advised that the information presented on TradingView is provided to Vantage (‘Vantage Global Limited’, ‘we’) by a third-party provider (‘Everest Fortune Group’). Please be reminded that you are solely responsible for the trading decisions on your account. There is a very high degree of risk involved in trading. Any information and/or content is intended entirely for research, educational and informational purposes only and does not constitute investment or consultation advice or investment strategy. The information is not tailored to the investment needs of any specific person and therefore does not involve a consideration of any of the investment objectives, financial situation or needs of any viewer that may receive it. Kindly also note that past performance is not a reliable indicator of future results. Actual results may differ materially from those anticipated in forward-looking or past performance statements. We assume no liability as to the accuracy or completeness of any of the information and/or content provided herein and the Company cannot be held responsible for any omission, mistake nor for any loss or damage including without limitation to any loss of profit which may arise from reliance on any information supplied by Everest Fortune Group.
AUDCAD H1 | Bullish Bounce Off Overlap SupportMomentum: Bullish
Price is currently above the ichimoku cloud.
Buy entry: 0.98523
- Overlap support
- 61.8% Fib retracement
Stop Loss: 0.98320
- Swing low support
Take Profit: 0.98808
- Swing high resistance
High Risk Investment Warning
Stratos Markets Limited (fxcm.com/uk), Stratos Europe Ltd (fxcm.com/eu):
CFDs are complex instruments and come with a high risk of losing money rapidly due to leverage. 65% of retail investor accounts lose money when trading CFDs with this provider. You should consider whether you understand how CFDs work and whether you can afford to take the high risk of losing your money.
Stratos Global LLC (fxcm.com/en): Losses can exceed deposits.
Please be advised that the information presented on TradingView is provided to FXCM (‘Company’, ‘we’) by a third-party provider (‘TFA Global Pte Ltd’). Please be reminded that you are solely responsible for the trading decisions on your account. Any information and/or content is intended entirely for research, educational and informational purposes only and does not constitute investment or consultation advice or investment strategy. The information is not tailored to the investment needs of any specific person and therefore does not involve a consideration of any of the investment objectives, financial situation or needs of any viewer that may receive it. Past performance is not a reliable indicator of future results. Actual results may differ materially from those anticipated in forward-looking or past performance statements. We assume no liability as to the accuracy or completeness of any of the information and/or content provided herein and the Company cannot be held responsible for any omission, mistake nor for any loss or damage including without limitation to any loss of profit which may arise from reliance on any information supplied by TFA Global Pte Ltd.
Stratos Trading Pty. Limited (fxcm.com/au):
Trading FX/CFDs carries significant risks. FXCM AU (AFSL 309763), please read the Financial Services Guide, Product Disclosure Statement, Target Market Determination and Terms of Business at fxcm.com/au
AUDCAD H4 – Bearish Engulfing at Key ResistanceAUDCAD printed a strong bearish engulfing candle on the H4 timeframe, rejecting a key resistance zone and the upper boundary of the descending channel. Price failed to sustain above resistance, suggesting buyers are losing momentum. RSI is turning lower from the mid-range, supporting a potential bearish continuation. If the next H4 candle confirms the rejection with further downside, sellers may target the previous swing low and the lower channel support. A move above the recent resistance would invalidate the bearish setup.
AUDCAD - Buyers Face a Familiar Barrier!AUDCAD remains bullish from a broader perspective. After rejecting the blue support area, buyers regained control and pushed price back toward the red resistance zone, which has produced multiple rejections in recent weeks.
Price is now testing this key technical area once again, making it an important region to monitor for the next move.
⭕While price remains within the current resistance zone, we can start looking for sell setups on lower timeframes, anticipating another rejection within the broader corrective range.
⭕However, if buyers manage to break above the current resistance area, the focus shifts toward the upper red resistance and supply zone, where another potential selling reaction may develop.
The reaction around the current resistance may reveal whether sellers can defend this level once again, or if buyers are ready to extend the recovery toward the next technical objective.
⚠️ Disclaimer: This analysis reflects my personal market view and is not financial advice.
Rayan Nasser
#AUDCAD #AUD #CAD #Forex #TechnicalAnalysis #PriceAction #Trading #MarketStructure
AUD/CAD BEARS WILL DOMINATE THE MARKET|SHORT
Hello, Friends!
We are targeting the 0.981 level area with our short trade on AUD/CAD which is based on the fact that the pair is overbought on the BB band scale and is also approaching a resistance line above thus going us a good entry option.
Disclosure: I am part of Trade Nation's Influencer program and receive a monthly fee for using their TradingView charts in my analysis.
✅LIKE AND COMMENT MY IDEAS✅
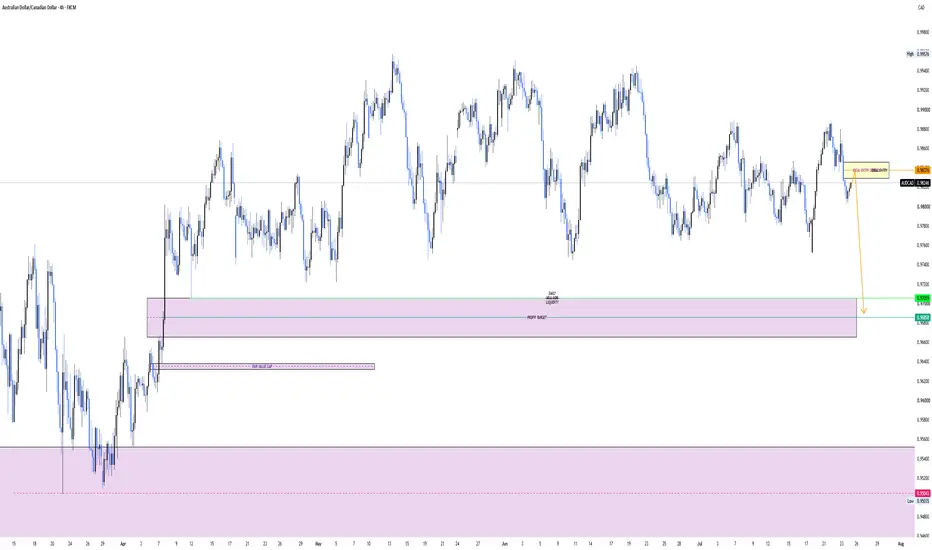
AUDCAD Will Fall! Sell!
Hello,Traders!
AUDCAD is reacting from a horizontal supply area after sweeping buy-side liquidity. Expect sellers to defend this premium zone and push price toward the imbalance below. Time Frame 4H.
Sell!
Comment and subscribe to help us grow!
Check out other forecasts below too!
AUDCAD - Resistance Comes Back Into Focus!AUDCAD continued its bullish momentum after rejecting the blue support area, with buyers successfully pushing price higher toward the next key technical resistance.
Price is now approaching the red resistance and supply area, which has previously acted as an important barrier for the market and is worth monitoring closely.
⭕As price approaches this resistance zone, we can start looking for sell setups on lower timeframes, particularly if price shows signs of rejection from the current area.
⭕However, if buyers manage to break above the current resistance zone, it would indicate that bullish momentum remains strong and increase the probability of further upside.
The upcoming reaction may reveal whether sellers are ready to slow the current recovery, or if buyers have enough momentum to continue pushing higher.
⚠️ Disclaimer: This analysis reflects my personal market view and is not financial advice.
Rayan Nasser
#AUDCAD #AUD #CAD #Forex #TechnicalAnalysis #PriceAction #Trading #MarketStructure
AUD/CAD BEARS WILL DOMINATE THE MARKET|SHORT
AUD/CAD SIGNAL
Trade Direction: short
Entry Level: 0.985
Target Level: 0.982
Stop Loss: 0.987
RISK PROFILE
Risk level: medium
Suggested risk: 1%
Timeframe: 1h
Disclosure: I am part of Trade Nation's Influencer program and receive a monthly fee for using their TradingView charts in my analysis.
✅LIKE AND COMMENT MY IDEAS✅
AUDCAD - Pullback Nears a Key Buy Zone!AUDCAD remains bullish from a broader perspective and continues to trade within its corrective range. After rejecting the previous high and the red resistance zone, price is now moving toward the blue support area.
As the current pullback unfolds, the blue support zone comes back into focus and may provide another opportunity for buyers to defend the broader bullish structure.
⭕As price approaches the blue support area, we can start looking for buy setups on lower timeframes, anticipating a continuation of the broader bullish trend.
⭕However, if price breaks below the blue support area and the red trendline, it would provide the first major indication that momentum is shifting from bullish to bearish. In that case, the focus shifts toward the lower weekly support and demand area, where another bullish reaction may develop.
The next reaction from this support zone may reveal whether buyers are ready to resume the broader uptrend, or if sellers have other plans.
⚠️ Disclaimer: This analysis reflects my personal market view and is not financial advice.
Rayan Nasser
#AUDCAD #AUD #CAD #Forex #TechnicalAnalysis #PriceAction #Trading #MarketStructure
AUDCAD ShortHey traders! 👋 Here is a detailed breakdown of my short position on AUDCAD (1-Hour Chart). Price has tapped into major overhead supply after sweeping previous highs, opening up a high-probability drop toward discount demand.
🧠 Market Narrative & Context
Rejection off HTF Premium Supply: Price rallied strongly into a high-timeframe supply block around 0.9875 – 0.9882, where aggressive selling reaction was immediately observed.
Liquidity Sweep: Before rolling over, price swept above local equal highs (B2S signals), running buy-side liquidity into key supply.
Higher Timeframe Alignment: The Daily (D) and Monthly (M) trends remain firmly Bearish, aligning nicely with this macro resistance bounce.
Momentum Shift: The RSI is turning down from overbought territory (around ~57), signaling weakening bullish momentum and supporting a drop back toward demand.
🎯 Trade Execution & Targets
Bias: Short / Bearish 🔴
Current Price / Entry: ~0.9865
Invalidation / Stop Loss: Above the recent protected high (~0.9882)
Primary Target (TP1): 0.9845 (Lazy Trader Mini CHOCH / BOS Demand Zone)
Extended Target (TP2): 0.9800 (Lazy Trader CHOCH Demand Unmitigated at bottom blue line)
💡 Trade Management Plan
Once price hits TP1 (~0.9845), I'll look to scale out partials and bring my stop loss to breakeven, letting the rest run down toward the major demand block at 0.9800.
What are your thoughts on AUDCAD? Do you think demand will hold, or are we sweeping all the way down to 0.9800? Drop your ideas below, and don't forget to Like, Comment, and Follow for more daily Smart Money setups!
#AUDCAD #Forex #TradingView #SmartMoneyConcepts #ICT #TechnicalAnalysis #DayTrading #PriceAction #OrderBlock #FxTrading
Three tries at 0.9890. Wednesday's CPI decides the fourthAUD/CAD - long swing setup, ARMED (1D)
THE SETUP
AUD/CAD has run into the same ceiling three times this month. The daily highs print at 0.98874, 0.98890 and 0.98882 - 1.6 pips between the highest and the lowest, which is close enough to call it one price. Underneath it the lows keep rising: 0.97613, then 0.98024, then 0.98079, then 0.98463 today. Flat top, rising floor. That is an ascending triangle, and the coil is tight enough that ADX has dropped to 13.2 while all twelve moving averages I track sit below price.
I am not long yet. This arms on a daily close above 0.9890.
CONFLUENCES
- Trend agrees: price above all 12 MAs, the 200 EMA is 275 pips below at 0.96023
- Flat resistance tested three times inside 1.6 pips
- Four consecutive higher lows compressing into it
- RSI 55, so momentum is with the trend but nowhere near overbought. Room to run
- A dated catalyst that points the same way as the trade
- Clean invalidation: no close above 0.9890 means no trade and nothing risked
FUNDAMENTALS
Australian Q2 CPI lands Wednesday 29 July. Trimmed mean is expected at 3.7% against 3.5% prior, and June employment already surprised hard at +76.3K, which pushed pricing toward an RBA hike on 11 August. The other leg is asleep: the Bank of Canada held at 2.25% in July for a sixth straight meeting and does not meet again until 2 September. One side has a catalyst, the other has none.
The risk cuts both ways. A soft CPI removes the August hike case and this triangle likely resolves downward instead. That is precisely why there is a trigger rather than a position.
TRADE PLAN
Trigger: daily close above 0.9890
Entry zone: 0.9884 - 0.9893
Stop loss: 0.9840 (below the last higher low at 0.98463)
TP1: 1.0000, parity (+1.12% | 2.2R)
TP2: 1.0017, the measured move - triangle height is 128 pips (+1.29% | 2.6R)
Watch 0.9944, the June high, for friction on the way. I scale there rather than treat it as a target.
Invalidation: no daily close above 0.9890.
Every call I publish goes in the public scorecard, wins and losses both.
So which are you: take the close above 0.9890, or wait for CPI to print and pay up for the certainty?
Not financial advice. Trade your own plan and manage risk.
AUD-CAD Free Signal! Sell!
Hello, Traders!
AUDCAD rejecting the horizontal supply area after a liquidity sweep into premium pricing. Sellers are defending this zone, favoring a bearish continuation toward the next downside objective.
-----------------
Stop Loss: 0.9854
Take Profit: 0.9832
Entry: 0.9843
Time Frame: 4H
-----------------
Sell!
Comment and subscribe to help us grow!
Check out other forecasts below too!
AUD/CAD Daily OutlookAUD/CAD has rejected the daily resistance zone near 0.9880 signalling renewed bearish pressure. Price may look to test (and reject) 0.9842, where sellers could target the lower daily support area around 0.9750 to 0.9760 over the coming sessions. A sustained recovery above 0.9842 would weaken this bearish outlook and could bring the upper resistance zone back into focus.