Australian Dollar/Canadian Dollar
No trades
No trades
In-depth trading ideas
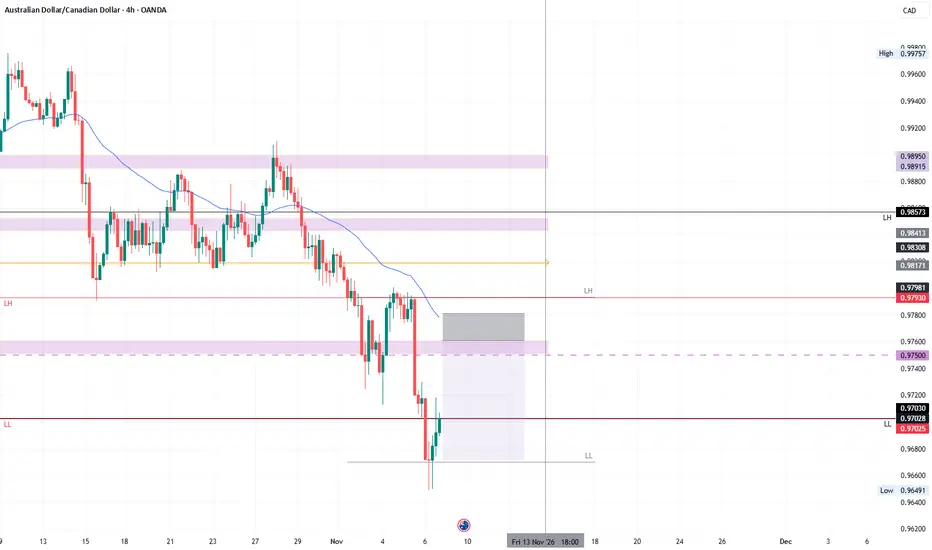
AUDCAD SELL TRADE IDEAMarket structure and market trend has aligned wonderfully, we clearly see the last break of structure to the downside and a nice clean supply area that facilitated that break.
With a clean confirmation we can now take sell towards the draw on liquidity but target the last internal range liquidity as a good take profit level.
AUDCAD – Potential Bullish Reversal Setup - 4H AnalysisAUDCAD is currently trading within a descending channel, consistently forming Lower Highs (LH) and Lower Lows (LL), indicating that the prevailing trend remains bearish.
However, I have identified bullish divergence on the 4H timeframe, which suggests that bearish momentum may be weakening and a potential reversal could be developing.
Rather than buying immediately against the prevailing trend, I am looking for structural confirmation.
Option 1 – Break of Market Structure (Preferred)
Wait fo
AUDCAD: Important Breakout 🇦🇺🇨🇦
AUDCAD broke and closed below a strong horizontal support cluster.
After the breakout, the broken structure turned into resistance that holds after a retest.
I think that the price will continue falling and reach 0.9603 level.
❤️Please, support my work with like, thank you!❤️
I am part of Trade Nation's Influencer program and receive a monthly fee for using their TradingView charts in my analysis.
AUDCAD: Bearish Bias Remains 🇦🇺🇨🇦
Quick update for AUDCAD.
The market is coiling after the recent bearish break of structure.
The price retested the broken support and is coiling now.
A bearish rally may resume after the news.
The goal remains intact - 0.9603
❤️Please, support my work with like, thank you!❤️
I am part of Trade Nation's Influencer program and receive a monthly fee for using their TradingView charts in my analysis.
Here’s why I think AUDCAD might rebound from current low:AUDCAD made a new low today and from the technical standpoint, I still anticipate bullish Price action to develop away from the current market price considering that one is oversold from the daily timeframe and we’re at a crucial level of possible rebound. A buy opportunity is envisaged.
Potential bullish recovery?AUD/CAD is falling toward the pivot, which is a support at the 61.8% Fibonacci projection and the 127.2% Fibonacci extension, and could bounce toward the 1st resistance, which is a pullback resistance.
Pivot: 0.95997
1st Support: 0.95481
1st Resistance: 0.97241
Disclaimer:
The opinions given above constitute general market commentary and do not constitute the opinion or advice of IC Markets or any form of personal or investment advice.
Any opinions, news, research, analyses, prices, other i
AUD/CAD BEST PLACE TO BUY FROM|LONG
AUD/CAD SIGNAL
Trade Direction: long
Entry Level: 0.968
Target Level: 0.972
Stop Loss: 0.965
RISK PROFILE
Risk level: medium
Suggested risk: 1%
Timeframe: 1h
Disclosure: I am part of Trade Nation's Influencer program and receive a monthly fee for using their TradingView charts in my analysis.
✅LIKE AND COMMENT MY IDEAS✅
AUDCAD – Bearish Continuation Setup (1H)The overall market structure remains bearish across the Weekly, Daily, and 4H timeframes. Therefore, our primary focus remains on identifying short opportunities in alignment with the higher-timeframe trend.
The recent break of the 4H green demand zone further supports our bearish outlook. We are now waiting for a fresh 4H supply zone to form, which will serve as our confirmation for a potential short position.
Interestingly, price previously retraced to the 0.5 Fibonacci level on the 4H timef
AUDCAD Set To Grow! BUY!
My dear followers,
I analysed this chart on AUDCAD and concluded the following:
The market is trading on 0.9711 pivot level.
Bias - Bullish
Technical Indicators: Both Super Trend & Pivot HL indicate a highly probable Bullish continuation.
Target - 0.9741
About Used Indicators:
A super-trend indicator is plotted on either above or below the closing price to signal a buy or sell. The indicator changes color, based on whether or not you should be buying. If the super-trend indicator moves bel
AUDCAD Possible SenarioWhat we are seeing on this pair FX_IDC:AUDCAD is the formation of an Inverse Head and Shoulders pattern.
Given the slowdown in bearish momentum and the development of this pattern, the setup remains valid as long as price holds above the Right Shoulder low.
A break above the neckline would confirm the pattern and activate the upside targets we have identified.
Please note: This is a conditional setup that requires bullish confirmation through a neckline breakout. If price fails to deliver
AUDCAD SHORTsMarket structure bearish on HTFs 3
Entry at both Weekly and Daily AOi
Weekly rejection at AOi
Daily Rejection at AOi
Previous Daily Structure Point
Around Psychological Level 0.97500
Touching EMA H4
H4 Candlestick rejection
Rejection from Previous structure
TP: WHO KNOWS!
Entry 110%
REMEMBER : Trading is a Game Of Probability
: Manage Your Risk
: Be Patient
: Every Moment Is Unique
: Rinse, Wash, Repeat!
: Christ is King
Potential bearish reversal?AUD/CAD is rising toward the pivot, which is an overlap resistance, and could reverse toward the 1st support.
Pivot: 0.98051
1st Support: 0.97254
1st Resistance: 0.98902
Disclaimer:
The opinions given above constitute general market commentary and do not constitute the opinion or advice of IC Markets or any form of personal or investment advice.
Any opinions, news, research, analyses, prices, other information, or links to third-party sites contained on this website are provided on an "as-i
AUDCAD — Higher-Timeframe Structure Shifts Bearish
The higher-timeframe bullish structure was invalidated after price broke the major protected higher low (blue horizontal level), shifting the broader market into a bearish phase.
Following that break, I was tracking the lower-timeframe internal inducement and a potential mitigation into the green auction zone, positioned around the 50% equilibrium level on the premium side.
After buy-side liquidity was taken and price mitigated the midterm orange auction zone, the green structure provided the
AUDCAD, Opportunity to join sell trendOANDA:AUDCAD
4H Market Analysis
🔻 Market Structure:
AUDCAD maintains a bearish structure, with consecutive downside BOS confirming seller dominance.
🎯 Liquidity & Supply:
Price is approaching the marked supply zone, where internal liquidity is positioned. This area could attract a liquidity sweep before a potential bearish reaction.
📉 Expected Movement:
The drawing suggests a possible rejection from the highlighted zone, followed by further downside continuation.
⚠️ Confirmation:
Watch for
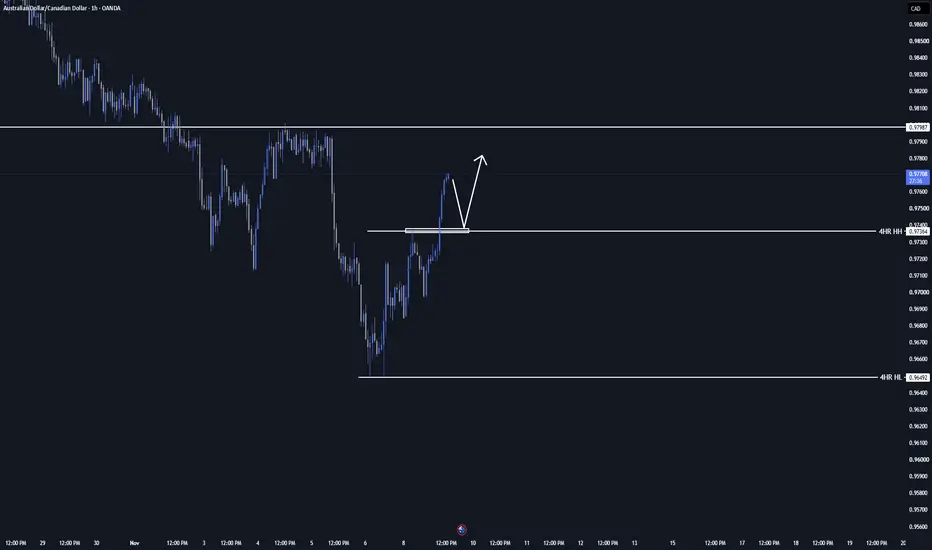
AudCad Trade Idea/UpdateI posted AC longs earlier. If you notice the first entry played out and would've hit targets. I still wanna see price retest the high here. I will change my set up If price makes a new HL and HH on the 4hr. At that point I'll wait to see if the hourly is still in sync and I'll find a set up from there.
AUDCAD H4 | Bearish Reaction Off Pullback ResistanceMomentum: Bearish
Price is currently below the ichimoku cloud.
Sell entry: 0.97560
- Pullback resistance
- 71% Fib retracement
- Fair value gap
Stop Loss: 0.98003
- Swing high resistance
Take Profit: 0.96714
- Swing low support
High Risk Investment Warning
Stratos Markets Limited (fxcm.com/uk), Stratos Europe Ltd (fxcm.com/eu):
CFDs are complex instruments and come with a high risk of losing money rapidly due to leverage. 65% of retail investor accounts lose money when trading CFDs with thi
AUDCAD, Another opprtunity can avail, if it goes upOANDA:AUDCAD
Bearish Market Outlook (4H)
🔻 Structure Shift: Price has confirmed a bearish Break of Structure (BoS), reinforcing the existing downward trend.
🎯 Supply Zone: The marked resistance area has acted as a rejection zone. Previous support has turned into potential resistance.
📉 Expected Movement: Strong bearish momentum suggests further downside continuation, as illustrated by the projected move.
⚠️ Confirmation: A corrective retest of the marked zone followed by bearish rejection w
AUDCAD, Best selling opportunity for daily targetOANDA:AUDCAD
1H – Timeframe
📉 Market Structure
The overall structure remains bearish, with consecutive downside BOS confirming seller dominance.
🎯 Liquidity & IDM
Price is currently pushing upward to approach the marked IDM liquidity, potentially creating an opportunity for liquidity to be taken before bearish continuation.
🧱 Supply / Mitigation Zone
The marked supply area represents a potential selling zone. A bearish reaction from this region would strengthen the short-side setup.
⚡ Expec
AUDCAD BEARISH PRESSURE-IS 0.93/0.92 NEXTOn the daily charts, price grabbed liquidity at 0.99 before sellers took control pushing price lower, targeting the fair value gaps/profit zones, liquidity levels and unmitigated demand zones. Presently, price has contacted a demand zone, once we have a clear breakout below the demand zone or short term bullish pullback we will seek the appropriate trade opportunities. Our outlook remains bearish targeting lower fair value gaps at 0.93 or 0.92.
AUDCAD, A bearish trend continuation approachOANDA:AUDCAD
1H Market Outlook 📉
🔴 Dominant Direction: Sellers remain in control, with bearish market structure and consecutive downside movements highlighting sustained selling pressure.
🏛️ Supply Rejection: The upper supply zone has already produced a strong bearish reaction, confirming significant selling interest in that region.
🔄 Retracement Opportunity: Current bullish candles indicate a corrective pullback, potentially bringing price into the marked Mitigation Block.
⚖️ Resistance C
AUDCAD H4 | Sellers Still In ControlBased on the H4 chart analysis, we can see that the price is rising to our sell entry level at 0.96717, which is a pullback resistance.
Our stop loss is set at 0.97242, which is a pullback resistance.
Our take profit is set at 0.95729, which is a pullback support.
High Risk Investment Warning
65% of retail investor accounts lose money when trading CFDs with this provider. You should consider whether you understand how CFDs work and whether you can afford to take the high risk of losing your