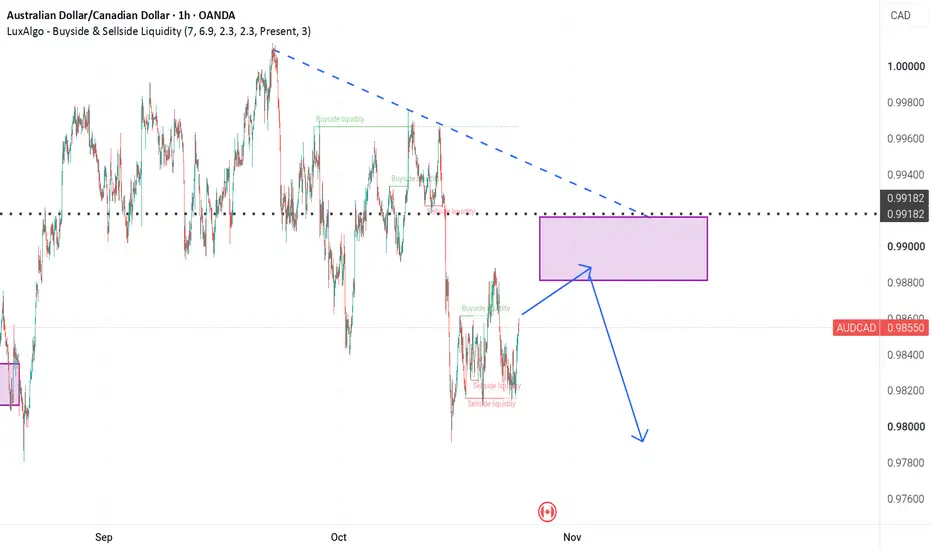
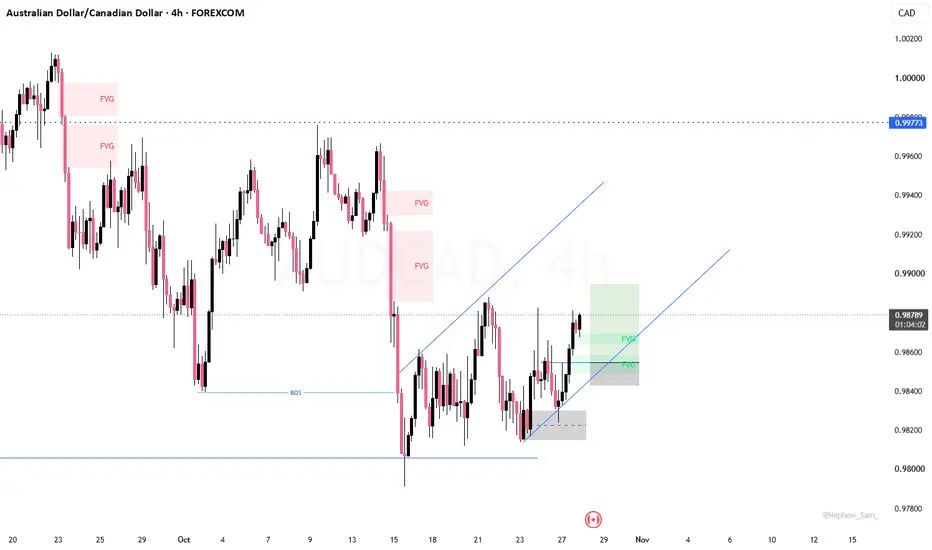
AUDCADHello Traders! 👋
What are your thoughts on AUDCAD?
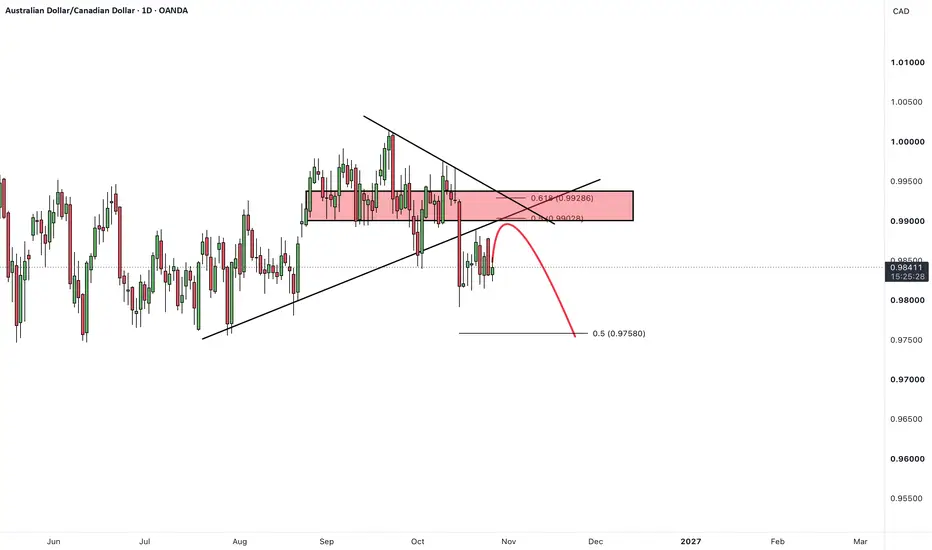
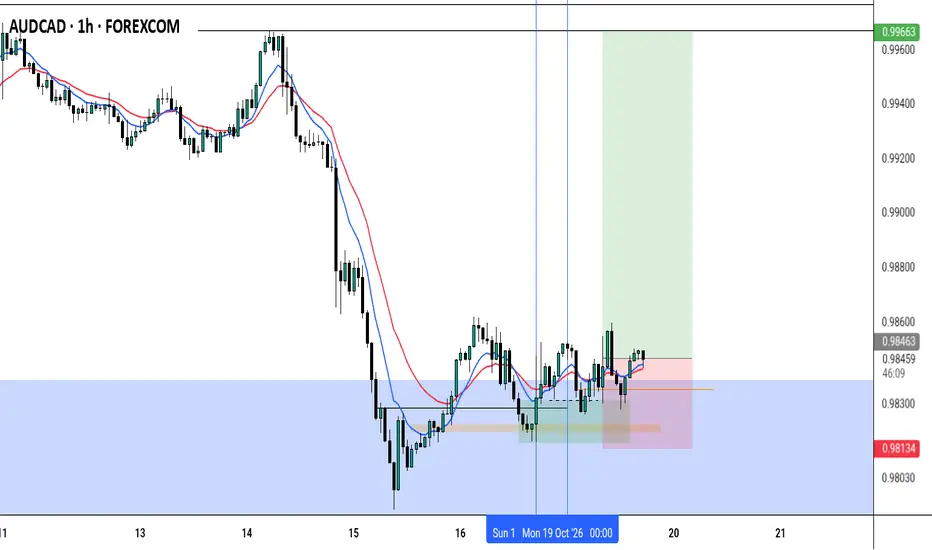
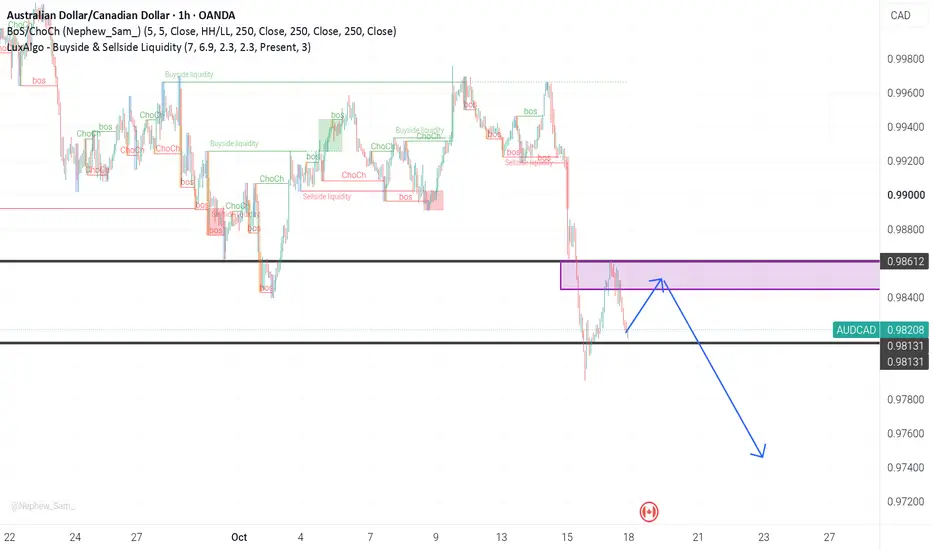
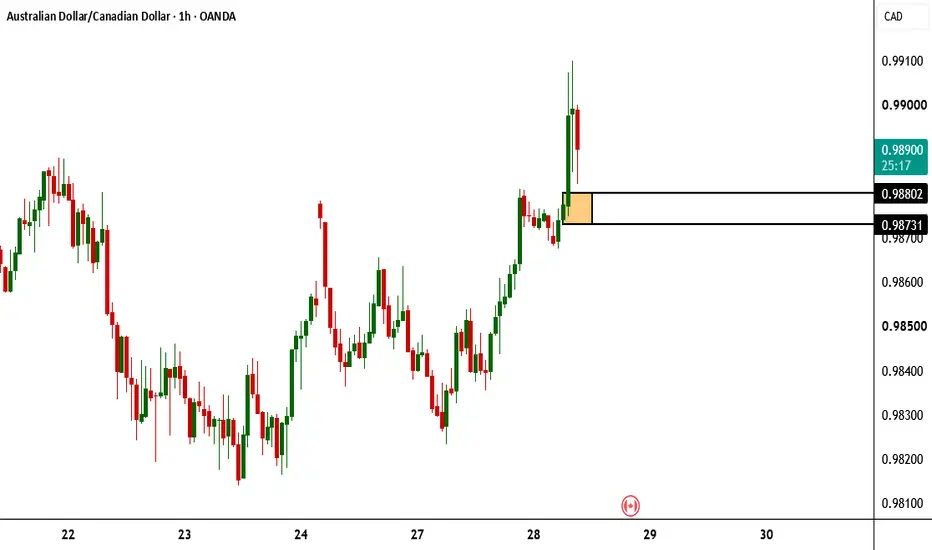
AUDCAD has broken below the ascending trendline, moving out of its previous structure. This development could signal a shift in the technical structure in favor of sellers and increase the likelihood of further downside.
Currently, the pair is trading below the resistance zone between 0.9900 and 0.9940. A corrective pullback toward the broken area is expected, where renewed selling pressure could emerge, potentially driving the pair lower tow
Australian Dollar/Canadian Dollar
No trades
No trades
In-depth trading ideas
AUDCAD – Sell the Rally?What do you think about AUDCAD right now — buy or sell?
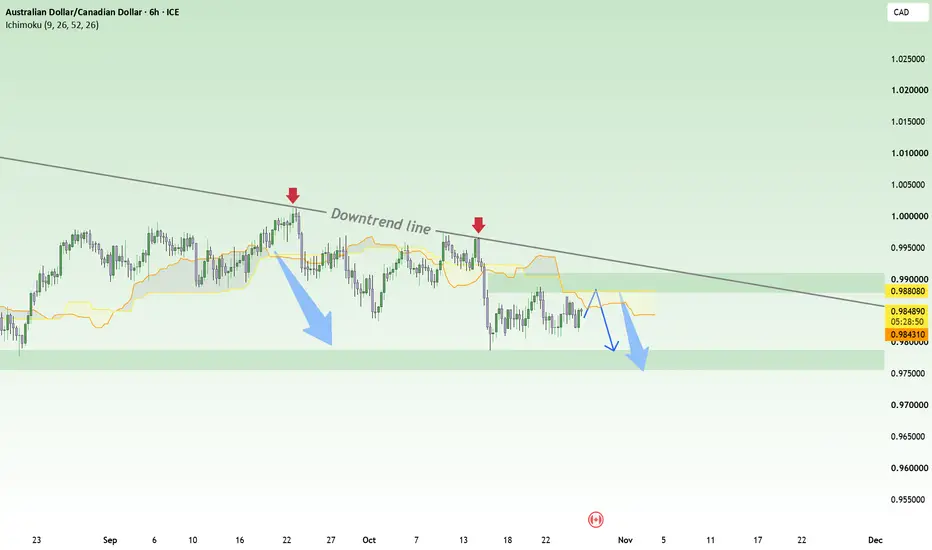
AUDCAD is still in a downtrend on the 6H chart. Price remains below the descending trendline, and the last two tests were rejected. So far, the structure hasn’t changed.
I’m watching the 0.9880–0.9900 area. The trendline runs through this zone, with the Ichimoku cloud sitting just above it. If price rebounds, this is where I want to see how sellers react.
Rather than chasing a short around 0.9840, I’d rather wait for a pullback toward 0.9
AUDCAD: Fib Resistance Retest — Bearish Move to 0.9722?Hook :
FX:AUDCAD has shifted bearish following a break of structure beneath the weak high — and a retest of the 0.618–0.658 Fibonacci resistance zone could offer sellers another opportunity to drive price toward 0.9722, near the strong-low support area. 🔥
Market Context :
AUDCAD is trading around 0.985 in late October 2026, with the daily chart pointing toward a potential bearish continuation.
The proposed setup focuses on a recovery into 0.9917–0.9946, where the Fibonacci retracement
Is This Daily Range Preparing for a Bullish Breakout?AUD/CAD | Is This Daily Range Preparing for a Bullish Breakout?
Hello everyone, and welcome back to another TradingView market analysis! 🌹📊
Today we're looking at AUD/CAD on the daily timeframe, where price is currently compressed inside a relatively tight range while the fundamental divergence between Australia and Canada remains an important driver.
🇦🇺🏦 Australia | RBA Tightening Supports AUD
One of the most important fundamental factors for the Australian dollar is the Reserve Bank of Austra
AUDCAD Short BiasThe price is currently moving up towards fibonacci's golden zone which almost aligns with resistance around 0.99100 - 0.99200. If price respect the golden zone, resistance or both and a change of structure from bullish to bearish from lower timeframes (30M - 15M) around the red circle than start looking for short positions. short back to around 0.97910 and below with a stoploss around 0.99400.
AudCad Trade IdeaAC is currently trading between the 4hr LH and LL. We had a clean bearish flip once price approached the LH indicating a possible tap back into the LL. Hourly structures here are also bearish so a short play here makes sense. IF price can break and retest the recent hourly LL on the 15m time frame I'll look to short DEPENDING on where price closes on the 15m. I want to target a 1:3rr here.
Idea For Next week.AUD/CAD has broken to its highest level since early 2021, powered by a significant hawkish repricing of the RBA rate outlook, the opposite to what's been seen in Canada, along with strong gains in industrial commodities.
Bank of Canada to deliver a hold with a clear indication that rates will be moving higher in future meetings, contingent on a benign growth path."
"We do not see the urgency to hike in October, but we don't expect rates to remain at 2.25% for much longer. We are pulling for
AUDCAD H4 – Bearish Continuation After Resistance BreakdownAUDCAD remains bearish within a descending channel after breaking below the resistance zone. A short-term bullish retracement towards the former resistance is possible, but sellers may regain control and push price lower if the zone rejects the pullback.
AUDCAD H4 | Bearish Reversal At 61.8% Fib ResistanceBased on the H4 chart analysis, we can see that the price is rising to our sell entry level at 0.98929, which is a pullback resistance that aligns with the 61.8% Fibonacci retracement.
Our stop loss is set at 0.99759, which is a pullback resistance.
Our take profit is set at 0.98246, which is a pullback support.
High Risk Investment Warning
65% of retail investor accounts lose money when trading CFDs with this provider. You should consider whether you understand how CFDs work and whether you
Could we see a reversal from here?AUD/CAD is rising to an overlap resistance and could reverse from here to our take profit.
Entry: 0.98417
Why we like it:
There is an overlap resistance level.
Stop loss: 0.98935
Why we like it:
There is a pullback reistance.
Take profit: 0.97646
Why we like it:
There is a pullback support level that is near the 161.8% Fibonacci extension.
Enjoying your TradingView experience? Review us!
Please be advised that the information presented on TradingView is provided to Vantage (‘Vantage Glo
AUDCAD Will Move Lower! Short!
Take a look at our analysis for AUDCAD.
Time Frame: 1h
Current Trend: Bearish
Sentiment: Overbought (based on 7-period RSI)
Forecast: Bearish
The market is trading around a solid horizontal structure 0.983.
The above observations make me that the market will inevitably achieve 0.980 level.
P.S
We determine oversold/overbought condition with RSI indicator.
When it drops below 30 - the market is considered to be oversold.
When it bounces above 70 - the market is considered to be overbought.
AUDCAD Descending Channel Retest & Short OpportunityExecutive Summary:
The AUDCAD pair on the 4-hour timeframe is currently respecting a well-defined descending channel structure. Following a rejection near the upper bound of the major channel, price action is consolidating near a minor supply area / short-term resistance zone around 0.99500. A successful retest and bearish rejection at this confluence point opens up a short position targeting lower support zones, with an expected move of approximately 108 pips (~1.08%) down to the main channel
Bullish bounce off?AUD/CAD has bounced off the pivot, which is a pullback support, and could rise toward the 1st resistance, which is a pullback resistance.
Pivot: 0.98976
1st Support: 0.98414
1st Resistance: 0.99799
Disclaimer:
The opinions given above constitute general market commentary and do not constitute the opinion or advice of IC Markets or any form of personal or investment advice.
Any opinions, news, research, analyses, prices, other information, or links to third-party sites contained on this webs
AUDCAD | Published Idea
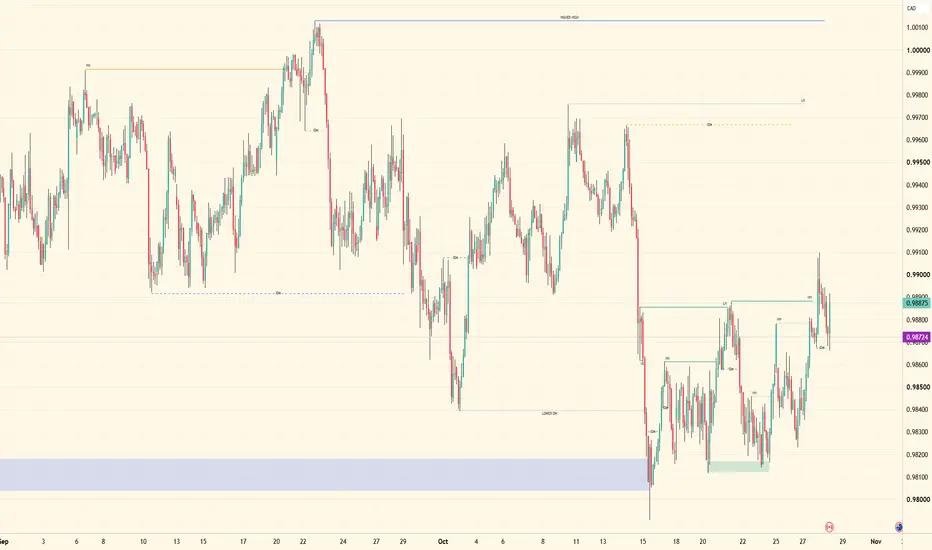
Price action is getting interesting here, and I can see how this structure could be tricky to read at first glance. I’ve been tracking the footprints and monitoring how price has been developing within the broader range.
Higher-timeframe structure remains bullish. However, after the intraday range was violated through a break of its major higher low, price began reaching for deeper higher-timeframe liquidity. With the dotted blue liquidity level to the left already taken, my attention shifted
AUDCAD: Bears Will Push Lower
Balance of buyers and sellers on the AUDCAD pair, that is best felt when all the timeframes are analyzed properly is shifting in favor of the sellers, therefore is it only natural that we go short on the pair.
Disclosure: I am part of Trade Nation's Influencer program and receive a monthly fee for using their TradingView charts in my analysis.
❤️ Please, support our work with like & comment! ❤️
kvmev - AUDCAD entryEntering a 1:1 RR short position on AUDCAD.
Clear break and retest pattern on the daily/h4 time frame. We can see how this week opened above the zone, traded below then retested and rejected that same area. Looking to take full profits at the set profit target.
___
Disclaimer: The content shared is for educational and informational purposes only and does not constitute financial, investment, or trading advice. I am not a licensed financial advisor. Any actions you take based on this content a