AUD/JPY Wedge Breakdown (28.07.2026)AUD/JPY has confirmed a bearish breakout from a rising wedge formation after failing to sustain gains inside the ascending structure. Price is now trading below the short-term trendline while facing rejection near the Ichimoku cloud, increasing the probability of further downside momentum. As long as price remains below the highlighted resistance zone, sellers may continue targeting the next key support levels. A recovery above resistance would invalidate the immediate bearish outlook. OANDA:AUDJPY
(SELL)
🔴 1st Support : 114.079
🔴 2nd Support : 113.935
🟢 Resistance Zone : 114.597 – 114.661
✅ Markets are closely watching the Bank of Japan policy meeting, with expectations that the BOJ will maintain a hawkish tone and leave the door open for additional rate hikes later this year.
⚠️ Disclaimer: This analysis is for educational purposes only.
Support the idea 🚀 Boost | 💬 Comment | 🔁 Share
🔸🔸 Charts Don't Lie, Traders Don't Quit 🔸🔸
Australian Dollar / Japanese Yen
No trades
No trades
In-depth trading ideas
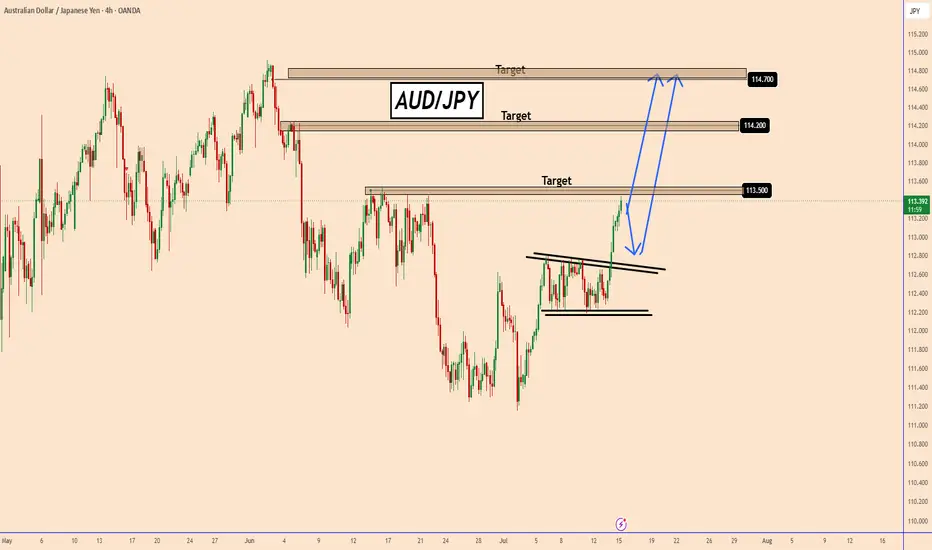
AUD/JPY Sell Detected ,150 Pips Waiting From Best Place For SellHere is my opinion on 4H T.F On AUD /JPY Chart , the price Touched a very strong res area that forced the price to respect it and go down for more than 500 pips for 3 times , and if we checked the chart we will see that the price touched the same area 3 times and the 3 touches was perfect and we sold from it before and get more than 250 pips so it`s a very strong res area , i`m agree that the price not strong as previous cuz it already tested for more than 3 times but i think we will get from it this time at least 50 : 100 pips so we can enter a sell trade now and targeting 50 : 100 pips at least , also we have a very good 4H Bearish Price action and the price reaction from the res was great so we should sell it and the only reason will change my opinion if we have a clear daily closure above our res and then this idea will not be valid anymore .
Entry Reasons :
1- Very Strong Daily & Weekly Res Area .
2- Perfect Bearish Price Action Last Time .
3- Bigger Time Frames Confirmed .
4- Bearish Price Action .
AUDJPY: I'm Waiting to Buy the PullbackWhile retail traders continue to sell into strength, AUDJPY keeps printing higher highs and higher lows, confirming that the broader bullish structure remains intact.
After analysing price action, COT data, seasonality and retail positioning, I still favour buying pullbacks rather than attempting to pick a top.
Market Structure
The daily trend remains firmly bullish.
Price has respected every significant higher low since the beginning of July and is now testing a major resistance zone between 114.42 and 114.92, an area that previously acted as supply.
This is not necessarily a level to sell.
Instead, it is a level where I expect the market to decide whether to continue immediately or offer a healthier pullback before the next expansion.
As long as price remains above the previous breakout structure, the bullish bias remains unchanged.
Commitment of Traders (COT)
The latest COT report provides an interesting backdrop.
Australian Dollar
Commercial traders have continued increasing their long exposure while large speculators remain net short.
Historically, commercial positioning often precedes medium-term directional moves, suggesting underlying accumulation in AUD.
Japanese Yen
Commercials remain net long JPY while speculators are still heavily short.
Although this could eventually support Yen strength, COT is a slow-moving indicator and rarely provides precise timing. At the moment, price action continues to dominate.
Seasonality
Seasonality also supports the current outlook.
Historically:
AUD tends to strengthen into late July and early August.
JPY generally underperforms during the same period.
This creates a favourable seasonal environment for AUDJPY continuation higher.
Retail Sentiment
83% of traders are short
17% are long
Retail continues trying to fade the trend.
From a contrarian perspective, this is typically supportive of further upside as long as price structure remains bullish.
Trading Plan
Rather than buying directly into resistance, I prefer allowing the market to retrace first.
My primary area of interest sits around 113.50, where previous resistance could become new support.
This zone also aligns with the recent breakout structure and offers a significantly better risk-to-reward opportunity.
If buyers regain control from that area, I will be looking for confirmation using my intraday execution model before targeting a continuation above 115.00.
AUDJPY Bearish CHOCH – Target 113AUDJPY is showing signs of a **bearish structure shift (CHOCH)** after facing rejection near the **114.50–114.60 resistance zone**. Price has moved below the recent structure, suggesting a possible continuation toward the **113.731 target**. The bearish setup remains valid while price stays below the key resistance area.
**🎯 Target: 113.731**
**📉 Bias: Bearish / Sell**
**🔑 Resistance: 114.50–114.60**
**⚠️ Invalidation: Strong breakout above resistance**
AUD/JPY continues to maintain a bullish market structureAUD/JPY BUY ANALYSIS | 4H TIMEFRAME
Market View: Bullish Trend – Buying from a Strong Support Zone
AUD/JPY continues to maintain a bullish market structure on the 4-hour timeframe. Price is retracing into a key support area around 113.900, presenting a potential buying opportunity in line with the prevailing uptrend.
Entry Zone:
Buy around 113.900 after bullish confirmation.
Technical Targets:
TP1: 114.500
TP2: 114.800
Technical Analysis:
The pair remains in a healthy uptrend, with higher highs and higher lows indicating sustained buying momentum. The current pullback into a strong support zone offers a favorable risk-to-reward opportunity for trend-following traders. A bullish rejection candle or strong buying pressure from 113.900 would strengthen the case for a continuation toward the projected targets.
Risk Management:
Place your stop-loss below the support zone based on your trading strategy. Wait for price confirmation before entering the trade and always manage your risk with discipline.
«Trade with the trend, respect key support, and let price action confirm the opportunity.»
#AUDJPY #Forex #ForexTrading #BuySetup #TechnicalAnalysis #BullishTrend #SupportZone #PriceAction #TradingSignals #SwingTrading
Bullish continuation?AUD/JPY is falling toward the pivot and could bounce toward the 1st resistance, which is a pullback resistance.
Pivot: 113.69
1st Support: 113.14
1st Resistance: 114.39
Disclaimer:
The opinions given above constitute general market commentary and do not constitute the opinion or advice of IC Markets or any form of personal or investment advice.
Any opinions, news, research, analyses, prices, other information, or links to third-party sites contained on this website are provided on an "as-is" basis, are intended to be informative only, and are not advice, a recommendation, research, a record of our trading prices, an offer of, or solicitation for, a transaction in any financial instrument and thus should not be treated as such. The information provided does not involve any specific investment objectives, financial situation, or needs of any specific person who may receive it. Please be aware that past performance is not a reliable indicator of future performance and/or results. Past performance or forward-looking scenarios based upon the reasonable beliefs of the third-party provider are not a guarantee of future performance. Actual results may differ materially from those anticipated in forward-looking or past performance statements. IC Markets makes no representation or warranty and assumes no liability as to the accuracy or completeness of the information provided, nor any loss arising from any investment based on a recommendation, forecast, or any information supplied by any third party.
Bullish bounce off 38.2% Fib support?AUD/JPY is falling to the support level, which is a pullback support that aligns with the 38.2% Fibonacci retracement and could bounce from this level to our take profit.
Entry: 112.83
Why we like it:
There is a pullback support level that aligns with the 38.2% Fibonacci retracement.
Stop loss: 112.19
Why we like it:
There is a pullback support level that aligns with the 61.8% Fibonacci retracement.
Take profit: 113.90
Why we like it:
There is an overlap resistance level.
Enjoying your TradingView experience? Review us!
Please be advised that the information presented on TradingView is provided to Vantage (‘Vantage Global Limited’, ‘we’) by a third-party provider (‘Everest Fortune Group’). Please be reminded that you are solely responsible for the trading decisions on your account. There is a very high degree of risk involved in trading. Any information and/or content is intended entirely for research, educational and informational purposes only and does not constitute investment or consultation advice or investment strategy. The information is not tailored to the investment needs of any specific person and therefore does not involve a consideration of any of the investment objectives, financial situation or needs of any viewer that may receive it. Kindly also note that past performance is not a reliable indicator of future results. Actual results may differ materially from those anticipated in forward-looking or past performance statements. We assume no liability as to the accuracy or completeness of any of the information and/or content provided herein and the Company cannot be held responsible for any omission, mistake nor for any loss or damage including without limitation to any loss of profit which may arise from reliance on any information supplied by Everest Fortune Group.
AUDJPY | Back on the Watchlist **AUDJPY | Back on the Watchlist 👀**
We recently took a small profit on **AUDJPY**, and now the market has worked its way back to a very interesting area.
Price is once again testing the **20-year highs**, creating what could become the **fourth touch** of this major resistance zone.
Momentum is beginning to show signs of a **potential bearish divergence**, but one important piece is still missing...
We **do not** have a bearish momentum hook yet.
For now, this remains a watchlist market.
We'll continue following the VMS 2.0 process:
✔️ Strong structure at resistance
✔️ Divergent momentum
⏳ Bearish momentum hook (still waiting)
⏳ Volume confirmation
⏳ Position Tool and risk/reward evaluation
No trade until the market confirms the setup.
Preparation. Execution. Consistency.
We'll keep watching this one closely.
Heading toward swing high resistance?AUD/JPY is rising to the resistance level, which is a swing high resistance that is slightly above the 61.8% Fibonacci projection and could reverse from this level to our take-profit
Entry: 114.88
Why we like it:
There is a swing high resistance level that is slightly above the 61.8% Fibonacci projection.
Stop loss: 115.78
Why we like it:
There is a resistance level at the 100% Fibonacci projection.
Take profit: 113.90
Why we like it:
There is an overlapping support level.
Enjoying your TradingView experience? Review us!
Please be advised that the information presented on TradingView is provided to Vantage (‘Vantage Global Limited’, ‘we’) by a third-party provider (‘Everest Fortune Group’). Please be reminded that you are solely responsible for the trading decisions on your account. There is a very high degree of risk involved in trading. Any information and/or content is intended entirely for research, educational and informational purposes only and does not constitute investment or consultation advice or investment strategy. The information is not tailored to the investment needs of any specific person and therefore does not involve a consideration of any of the investment objectives, financial situation or needs of any viewer that may receive it. Kindly also note that past performance is not a reliable indicator of future results. Actual results may differ materially from those anticipated in forward-looking or past performance statements. We assume no liability as to the accuracy or completeness of any of the information and/or content provided herein and the Company cannot be held responsible for any omission, mistake nor for any loss or damage including without limitation to any loss of profit which may arise from reliance on any information supplied by Everest Fortune Group.
AUDJPY H1 | Bullish Bounce Off Pullback SupportMomentum: Bullish
Price is currently above the ichimoku cloud.
Buy entry: 113.908
- Pullback support
- 61.8% Fib retracement
- 100% Fib projection
Stop Loss: 113.599
- Overlap support
Take Profit: 114.298
- Swing high resistance
High Risk Investment Warning
Stratos Markets Limited (fxcm.com/uk), Stratos Europe Ltd (fxcm.com/eu):
CFDs are complex instruments and come with a high risk of losing money rapidly due to leverage. 69% of retail investor accounts lose money when trading CFDs with this provider. You should consider whether you understand how CFDs work and whether you can afford to take the high risk of losing your money.
Stratos Global LLC (fxcm.com/en): Losses can exceed deposits.
Please be advised that the information presented on TradingView is provided to FXCM (‘Company’, ‘we’) by a third-party provider (‘TFA Global Pte Ltd’). Please be reminded that you are solely responsible for the trading decisions on your account. Any information and/or content is intended entirely for research, educational and informational purposes only and does not constitute investment or consultation advice or investment strategy. The information is not tailored to the investment needs of any specific person and therefore does not involve a consideration of any of the investment objectives, financial situation or needs of any viewer that may receive it. Past performance is not a reliable indicator of future results. Actual results may differ materially from those anticipated in forward-looking or past performance statements. We assume no liability as to the accuracy or completeness of any of the information and/or content provided herein and the Company cannot be held responsible for any omission, mistake nor for any loss or damage including without limitation to any loss of profit which may arise from reliance on any information supplied by TFA Global Pte Ltd.
Stratos Trading Pty. Limited (fxcm.com/au):
Trading FX/CFDs carries significant risks. FXCM AU (AFSL 309763), please read the Financial Services Guide, Product Disclosure Statement, Target Market Determination and Terms of Business at fxcm.com/au
AUDJPY Wedge Break Suggests Correction AheadPrice is being tightly compressed inside a narrowing bullish structure, with candles clustering around almost the same level and showing little progress to the upside.
This loss of bullish momentum suggests that buying pressure is gradually fading, while sellers may be preparing for a much larger move. From my perspective, this pattern could be setting the stage for the next major bearish breakdown.
If price breaks below the lower trendline and remains beneath the broken support, the release from this compression could trigger a sharp selloff. I would anticipate a deeper bearish correction toward the 114.150 area.
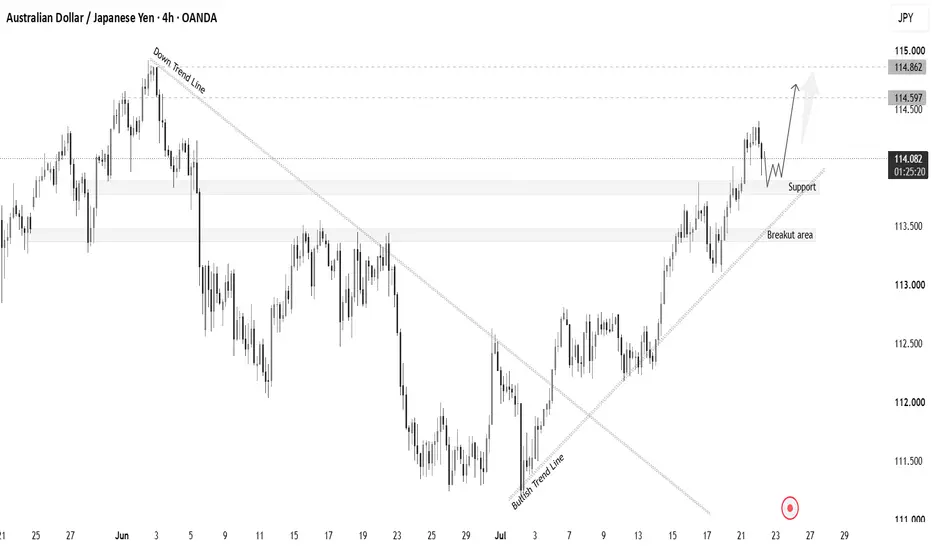
AUD/JPY Bulls Eye June HighAUD/JPY continues to look constructive, carving out another sequence of higher highs and higher lows after breaking above former resistance at 114.40 following Australia's stronger-than-expected employment report.
Momentum indicators are reinforcing the bullish setup. RSI (14) continues to carve out higher lows while sitting at a healthy 67, suggesting bullish momentum is strengthening without yet entering overbought territory. MACD also looks poised to deliver a bullish crossover, potentially adding further confirmation.
The only issue is location. While the technical picture remains constructive, price is sitting in a bit of no man's land, leaving the risk-reward less compelling at current levels.
Instead, I'd rather see a pullback towards 114.40 followed by evidence buyers are stepping back in. That would open the door for longs, with a stop beneath the level for protection, initially targeting 114.70 before 114.92, the swing high from June 2.
Should price slip back below 114.40 and hold there, the bullish bias would immediately come into question. A subsequent break beneath the rising trendline would confirm the short-term bullish structure has broken down, effectively putting the setup in the cactus basket.
Good luck!
DS
AUDJPY Very Strong Uptrend!
HI,Traders !
#AUDJPY is trading in a
Very strong uptrend and
The pair broke a key horizontal
Level around 113.429 which
Is now a support and we
Are already seeing a rebound
So we are bullish biased
And we will be expecting
A further move up !
Comment and subscribe to help us grow !
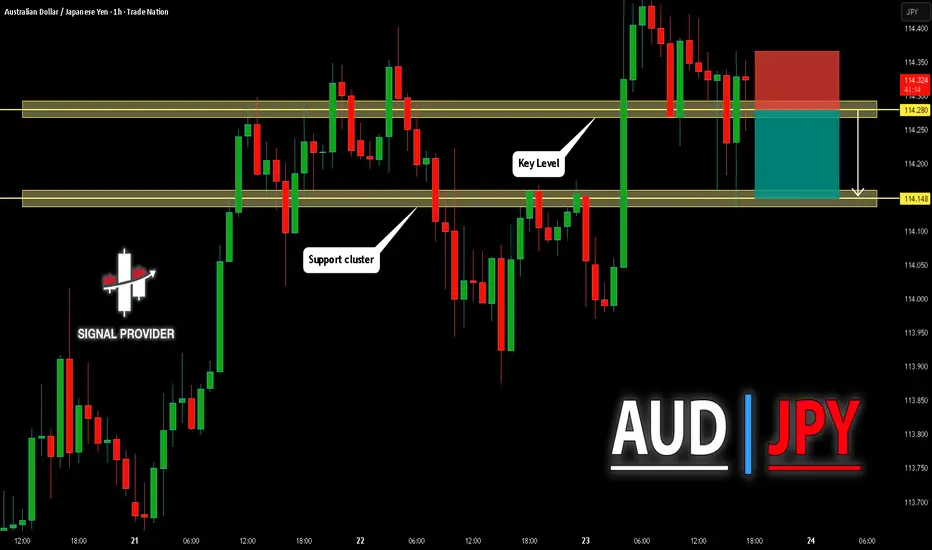
AUDJPY Will Fall! Short!
Take a look at our analysis for AUDJPY.
Time Frame: 1h
Current Trend: Bearish
Sentiment: Overbought (based on 7-period RSI)
Forecast: Bearish
The market is testing a major horizontal structure 114.280.
Taking into consideration the structure & trend analysis, I believe that the market will reach 114.148 level soon.
P.S
Overbought describes a period of time where there has been a significant and consistent upward move in price over a period of time without much pullback.
Like and subscribe and comment my ideas if you enjoy them!
AUDJPY Possible Long Position🔍 Market Overview & Thesis
On the H1 higher timeframe, AUDJPY remains in a well-defined bullish trend. The market is holding steady near key support and key multi-period highs, showing strong buyer interest on pullbacks.
Price is currently retesting a key demand zone around 114.160. As long as this structural support holds, our bias remains tilted toward a bullish continuation.
⚙️ Execution Strategy
To minimize risk and optimize precision, we are not executing a market order immediately.
Wait for Level Arrival: Allow price to interact directly with the 114.160 zone.
Lower Timeframe Confirmation (1M or 5M): Before entering, we will look for price action confirmation on the lower timeframes (e.g., a bullish change of character, engulfing candle, or double-bottom pattern).
Execution: Trigger the long entry only once confirmation triggers at or near the 114.160 zone.
🎯 Exact Trade Parameters
Asset / Pair: AUDJPY
Direction: LONG
Planned Entry Zone: 114.160 (pending LTF confirmation)
Stop Loss (SL): 10 pips (114.060)
Take Profit (TP): 30 pips (114.460)
Risk-to-Reward Ratio (RRR): 1:3
⚠️ Risk Disclaimer
Disclaimer: This analysis is for educational and informational purposes only and does not constitute financial or investment advice. Trading Forex involves substantial risk of loss. Always enforce sound risk management, utilize stop losses, and never risk more capital than you can afford to lose.
AUDJPY Bulls Take Control After Flag BreakoutAUDJPY Bulls Take Control After Flag Breakout
Yesterday, during the US market open, AUDJPY aggressively broke out of this clear bullish flag pattern confirming further growth and the price has not stopped so far.
However, it is not the best price position to enter this trade now. If you have it open, you can hold it as it could rise further to 1.1420 or even higher to 1.1470.
A better way to enter this trade is if it moves back down near the 1.1290 - 1.1300 support area and from there we can see long trading opportunities.
Key Targets:
1.1350
1.1420
1.1470
You can find more details on the chart.
Thank you and good luck! 🍀
⚠️PS: Do your own analysis and use your own strategy to join the trade.
❤️ If this analysis helps your trading day, please support it with a like or comment ❤️
AUDJPY - BEARISH BIAS AUDJPY - BEARISH BIAS📉
~ WEEKLY - We can see that price is at highest point. Price has started to reverse by breaking previous structure (HL) with a big bearish engulfing candle.🧨
~ DAILY - We wait for price to pull back to the AOI which is a strong fib level, within a psychological level and most importantly, multiple rejections making it a strong Resistance Level. 🧠
Overall I have a Bearish bias based on my top down analysis across 2 timeframes, Weekly,Daily!
As price moves up to my level, I will wait for my confirmations across these timeframes and see how price reacts.
#forextrading #tradingeducation #swingtrader #tradingstrategy #mjswings
audjpy sell signal. Don't forget about stop-loss.
Write in the comments all your questions and instruments analysis of which you want to see.
Friends, push the like button, write a comment, and share with your mates - that would be the best THANK YOU.
P.S. I personally will open entry if the price will show it according to my strategy.
Always make your analysis before a trade
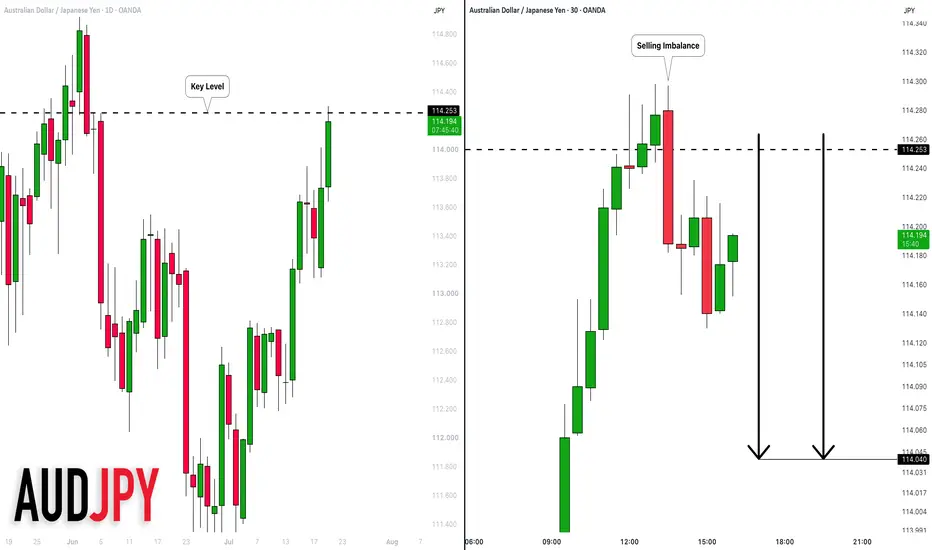
AUDJPY: Will Start Falling! Here is Why:
Balance of buyers and sellers on the AUDJPY pair, that is best felt when all the timeframes are analyzed properly is shifting in favor of the sellers, therefore is it only natural that we go short on the pair.
Disclosure: I am part of Trade Nation's Influencer program and receive a monthly fee for using their TradingView charts in my analysis.
❤️ Please, support our work with like & comment! ❤️