AUD/JPY BEARISH BIAS RIGHT NOW| SHORT
Hello, Friends!
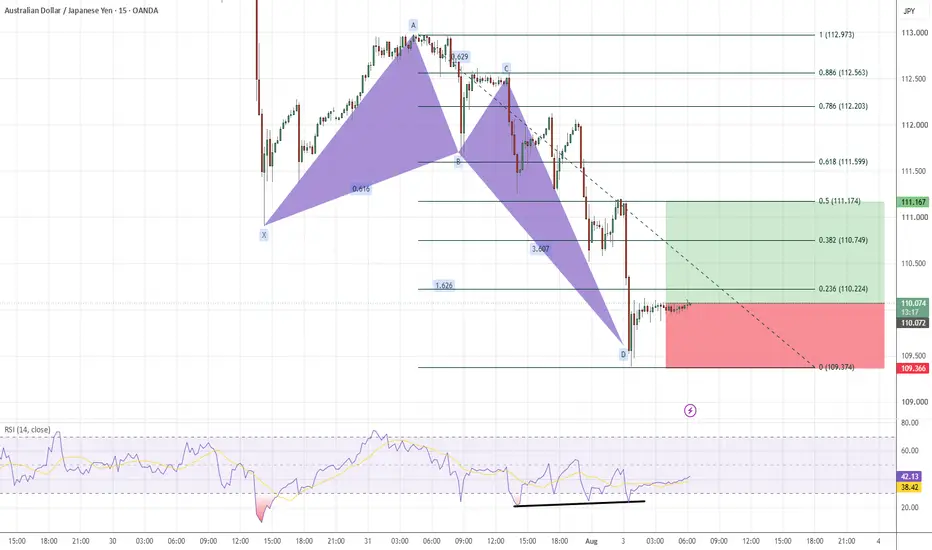
We are targeting the 108.831 level area with our short trade on AUD/JPY which is based on the fact that the pair is overbought on the BB band scale and is also approaching a resistance line above thus going us a good entry option.
Disclosure: I am part of Trade Nation's Influencer program and receive a monthly fee for using their TradingView charts in my analysis.
✅LIKE AND COMMENT MY IDEAS✅
Australian Dollar / Japanese Yen
No trades
No trades
In-depth trading ideas
AUDJPYAUDJPY 4H Chart Analysis (Shavyfxhub Strategy) + Full Macro Context
1. Chart Structure (Shavyfxhub Style)
Price has been making consistent lower highs along the red descending trendline (DTL). Multiple RT/RS (role reversal) labels mark previous support turning into resistance.
Key Levels:
Supply Roof: The long-term descending red channel resistance + the cluster around 111.90 – 112.00 (recent rejection zone with “bar” labels).
Immediate resistance: Horizontal red zone near 111.27 – 111.60.
Demand Floors:
Broken demand around 111.00–110.60
Next visible demand zones lower (projected paths point toward 110.00 and below).
Current Price Action (≈ 110.96):
Price has broken lower aggressively from the descending channel. The red projected paths on the right side show continued downside pressure. Structure remains bearish as long as price stays below the descending trendline and the 111.90–112.00 supply roof.
Bias: Short-term bearish. Look for continued selling or weak corrective rallies into the supply roof for potential short setups. A strong reclaim and close above the descending channel would be required to flip the structure.
2. Interest Rates & Differential
Central Bank,Current Policy Rate,Status
RBA (Australia),4.35%,Held (last decision June 2026)
BoJ (Japan),≈ 1.00%,Held (July 30–31 2026 meeting)
This still supports a positive carry for long AUD/JPY in theory, but the chart is currently dominated by technical selling and risk sentiment rather than pure carry.
3. Bond Yields & Differential (as of early August 2026)
Australia 10-year yield: ≈ 4.97%
Japan 10-year JGB yield: ≈ 2.84% – 2.85%
Bond Yield Differential: ≈ +2.12% in favour of Australia.
The yield advantage remains solid for AUD, but it has not prevented the recent technical breakdown on AUDJPY.
4. Heads of Central Banks
Reserve Bank of Australia (RBA): Governor Michele Bullock
Bank of Japan (BoJ): Governor Kazuo Ueda
5. Upcoming Economic Docket / Key Meetings
RBA Monetary Policy Decision: 11 August 2026 (announcement at 14:30 AEST). Markets currently price a very high probability of a hold at 4.35%.
BoJ next Monetary Policy Meeting: 17–18 September 2026.
Other near-term focus: Australian inflation and labour data ahead of the RBA meeting, plus any BoJ commentary on the pace of further normalisation.
Summary (Shavyfxhub + Macro)
Technical (Shavyfxhub): Bearish descending channel, lower highs, recent breakdown. Supply roof at the descending trendline / 111.90–112.00. Demand floors below are being tested. Bias remains down while below the channel.
Macro:
Still solid interest-rate and bond-yield advantage for AUD (+3.35% policy rate gap, +2.12% 10-year yield gap).
However, price is currently ignoring the carry and following the technical structure lower.
Next major catalyst: RBA decision on 11 August.
AUDJPY Bearish CHOCH – Target 113AUDJPY is showing signs of a **bearish structure shift (CHOCH)** after facing rejection near the **114.50–114.60 resistance zone**. Price has moved below the recent structure, suggesting a possible continuation toward the **113.731 target**. The bearish setup remains valid while price stays below the key resistance area.
**🎯 Target: 113.731**
**📉 Bias: Bearish / Sell**
**🔑 Resistance: 114.50–114.60**
**⚠️ Invalidation: Strong breakout above resistance**
AUDJPY H4 | Bearish Reaction Off Pullback ResistanceMomentum: Bearish
Price is currently below the ichimoku cloud.
Sell entry: 111.896
- Pullback resistance
- 71% Fib retracement
Stop Loss: 112.989
- Swing high resistance
Take Profit: 110.045
- Pullback support
High Risk Investment Warning
Stratos Markets Limited (fxcm.com/uk), Stratos Europe Ltd (fxcm.com/eu):
CFDs are complex instruments and come with a high risk of losing money rapidly due to leverage. 65% of retail investor accounts lose money when trading CFDs with this provider. You should consider whether you understand how CFDs work and whether you can afford to take the high risk of losing your money.
Stratos Global LLC (fxcm.com/en): Losses can exceed deposits.
Please be advised that the information presented on TradingView is provided to FXCM (‘Company’, ‘we’) by a third-party provider (‘TFA Global Pte Ltd’). Please be reminded that you are solely responsible for the trading decisions on your account. Any information and/or content is intended entirely for research, educational and informational purposes only and does not constitute investment or consultation advice or investment strategy. The information is not tailored to the investment needs of any specific person and therefore does not involve a consideration of any of the investment objectives, financial situation or needs of any viewer that may receive it. Past performance is not a reliable indicator of future results. Actual results may differ materially from those anticipated in forward-looking or past performance statements. We assume no liability as to the accuracy or completeness of any of the information and/or content provided herein and the Company cannot be held responsible for any omission, mistake nor for any loss or damage including without limitation to any loss of profit which may arise from reliance on any information supplied by TFA Global Pte Ltd.
Stratos Trading Pty. Limited (fxcm.com/au):
Trading FX/CFDs carries significant risks. FXCM AU (AFSL 309763), please read the Financial Services Guide, Product Disclosure Statement, Target Market Determination and Terms of Business at fxcm.com/au
AUDJPY - Range Support AheadAUDJPY has been trading within a large range, with price repeatedly reacting between well-defined support and resistance levels. 📊
📌 Price is now approaching the lower bound of the range, where a key support zone comes into focus. As long as this support continues to hold, we will be looking for buy setups in anticipation of another move toward the upper boundary of the range.
This level has attracted buyers multiple times before, making it an important area to monitor. Rather than buying blindly, we will wait for bullish price action confirmation before considering long positions.
Will buyers defend the range support once again, or is a breakdown finally on the horizon? 🤔
⚠️ Disclaimer: This is not financial advice. Always do your own research and manage risk properly.
📚 Stick to your trading plan regarding entries, risk, and management.
Good luck! 🍀
All Strategies Are Good; If Managed Properly!
~Richard Nasr
AUDJPY WEEKLY CHARTAUDJPY Weekly Top-Down Analysis – Shavyfxhub Strategy + Fundamentals
1. Chart Structure (Weekly – Shavyfxhub Style)
Key Levels:
Major Supply Zone / Channel Top: Around 114.544 (upper red ascending channel resistance).
Intermediate Resistance / Demand Flip: 111.394 – 110.646.
Strong Demand Floors:
101.148
90.063
86.275 (major long-term demand)
Structure Notes:
Clear long-term ascending channel.
Multiple SS (Strength of Structure) points and circled reaction zones.
Price has rallied strongly into the upper part of the channel and is currently consolidating near the highs.
Projected arrows show two main scenarios: continuation higher toward the channel top or a corrective pullback toward the mid-channel demand (around 101–107 area).
Bias:
Bullish continuation remains valid while price holds above the rising channel support and the 110.646 zone.
A deeper correction would look for demand around 101.148.
2. Heads of the Central Banks
Reserve Bank of Australia (RBA): Governor Michele Bullock
Bank of Japan (BoJ): Governor Kazuo Ueda
3. Interest Rates
Central Bank,Policy Rate,Level
RBA,Cash Rate,4.35%
BoJ,Policy Rate,~1.00%
This strongly supports the Australian Dollar (positive carry for long AUD / short JPY).
4. 10-Year Bond Yields
Market,Approx. 10Y Yield
Australia (AU10Y),~4.94%
Japan (JP10Y),~2.79% – 2.80%
Bond Yield Differential: Australia is higher by roughly 2.14% – 2.15%.
Summary:
Technically, AUDJPY is in a strong long-term uptrend inside an ascending channel, currently testing the upper region. Fundamentally, both the interest rate and bond yield differentials heavily favour the Australian Dollar, supporting a bullish bias on AUDJPY while the structure holds.
Bearish pressure builds at resistance level?AUD/JPY is reacting off the pivot which is pullback resistance, and could reverse toward the 1st support, an overlap support that aligns with the 50% Fibonacci retracement.
Pivot: 113.93
1st Support: 112.83
1st Resistance: 114.66
Disclaimer:
The opinions given above constitute general market commentary and do not constitute the opinion or advice of IC Markets or any form of personal or investment advice.
Any opinions, news, research, analyses, prices, other information, or links to third-party sites contained on this website are provided on an "as-is" basis, are intended to be informative only, and are not advice, a recommendation, research, a record of our trading prices, an offer of, or solicitation for, a transaction in any financial instrument and thus should not be treated as such. The information provided does not involve any specific investment objectives, financial situation, or needs of any specific person who may receive it. Please be aware that past performance is not a reliable indicator of future performance and/or results. Past performance or forward-looking scenarios based upon the reasonable beliefs of the third-party provider are not a guarantee of future performance. Actual results may differ materially from those anticipated in forward-looking or past performance statements. IC Markets makes no representation or warranty and assumes no liability as to the accuracy or completeness of the information provided, nor any loss arising from any investment based on a recommendation, forecast, or any information supplied by any third party.
AUDJPY: Bearish Drop to 108.00?FX:AUDJPY is eyeing a bearish reversal on the 4-hour chart , with price approaching a key resistance zone near the 0.786 Fibonacci level after the recent recovery, converging with a potential entry area that could trigger further downside momentum if sellers defend amid volatility. This setup suggests a solid pullback opportunity toward the lower support zone with more than 1:3 risk-reward .🔥
Entry between 113.29–113.96 (entry from current price with proper risk management is recommended). Target at 108.00 . Set a stop loss at a daily close above 114.70 , yielding a risk-reward ratio of more than 1:3 . Monitor for confirmation via a bearish candle close below entry with rising volume, leveraging the pair’s weakness near resistance.🌟
Fundamentally , AUDJPY is trading around 111.40 in early August 2026.
For the Australian Dollar, one of the most important releases this week (6–9 August) is the Australia Trade Balance , which provides insight into export strength and overall trade performance.
For the Japanese Yen, a key event is the Japan Household Spending data, which offers important clues about domestic demand and economic momentum. 💡
📝 Trade Setup
🎯 Entry (Short):
113.29 – 113.96
(Entry from current price is acceptable with proper position sizing and disciplined risk management.)
🎯 Target:
108.00
❌ Stop Loss:
• Daily candle close above 114.70
📈 Risk-to-Reward:
More than 1:3
💡 Will sellers defend the 113.29–113.96 resistance zone and drive AUDJPY toward 108.00, or will buyers reclaim 114.70 and invalidate the bearish setup? 👇
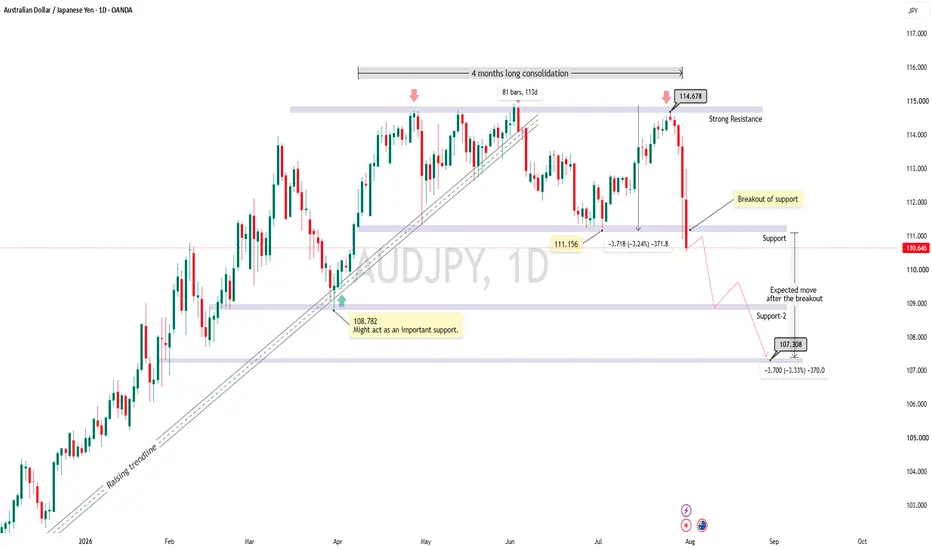
AUDJPY bearish reversal confirmed ??The up-swing that started on April 2025, seems to have came to an end as price has already breached the rising trendline along with breaking below 111.156 which was an important support for the consolidation that price had made in past 4 months, we can consider this as a topping formation.
structurally the stance has definitely shifted form bullish - sideways to bearish direction, now in my opinion taking shorts on pullbacks would be the right thing to do. for the consolidation & topping formation to which price gave breakout below 111.156, we can expect target till 107.3 which accounts for the width of the consolidation.
In short term price may take some pull backs that would be an opportunity to initiate fresh shorts, after it restarts it's decline in the continuation direction.
Immediate support is at 108.782 which might act as first hurdle, below that I don't see any significant supports. Strong resistance is at 114.678 that is the consolidation high of entire topping formation.
It's a nice opportunity to enter into a positional short. This weakness is expected to persist, looking at the fundamentals. Japan is seriously reconsidering their monetary policy and looking at the currency depreciation which has made the country fall into the bottom less pit and it's spiralling downward, it make more sense then ever to adapt to hawkish strategy to which we had even saw some positive hints along those lines.
For Educational Purposes only, Not an Investment Advice, Always use strict Risk management measures.
Regards CrazyTrades247.
AUD/JPY Sell Detected ,150 Pips Waiting From Best Place For SellHere is my opinion on 4H T.F On AUD /JPY Chart , the price Touched a very strong res area that forced the price to respect it and go down for more than 500 pips for 3 times , and if we checked the chart we will see that the price touched the same area 3 times and the 3 touches was perfect and we sold from it before and get more than 250 pips so it`s a very strong res area , i`m agree that the price not strong as previous cuz it already tested for more than 3 times but i think we will get from it this time at least 50 : 100 pips so we can enter a sell trade now and targeting 50 : 100 pips at least , also we have a very good 4H Bearish Price action and the price reaction from the res was great so we should sell it and the only reason will change my opinion if we have a clear daily closure above our res and then this idea will not be valid anymore .
Entry Reasons :
1- Very Strong Daily & Weekly Res Area .
2- Perfect Bearish Price Action Last Time .
3- Bigger Time Frames Confirmed .
4- Bearish Price Action .
AUDJPY: Confirmed Bearish Continuation 🇦🇺🇯🇵
This morning I took a short trade on AUDJPY pair.
The price broke and close below a support line of a rising wedge pattern
after a test of a strong daily resistance.
I expect a retracement to 110.85 level.
❤️Please, support my work with like, thank you!❤️
I am part of Trade Nation's Influencer program and receive a monthly fee for using their TradingView charts in my analysis.
AUDJPY: Time to Recover 🇦🇺🇯🇵
AUDJPY may continue recovering after an extended bearish wave.
I see a valid bullish breakout of strong daily resistance.
The price will likely reach 112.0 level soon.
❤️Please, support my work with like, thank you!❤️
I am part of Trade Nation's Influencer program and receive a monthly fee for using their TradingView charts in my analysis.
AUDJPY WEELY STRUCTUREAUDJPY Weekly Top-Down Analysis – Shavyfxhub Strategy + Fundamentals
1. Chart Structure (Weekly – Shavyfxhub Style)
Key Levels:
Major Supply Zone / Channel Top: Around 114.544 (upper red ascending channel resistance).
Intermediate Resistance / Demand Flip: 111.394 – 110.646.
Strong Demand Floors:
101.148
90.063
86.275 (major long-term demand)
Structure Notes:
Clear long-term ascending channel.
Multiple SS (Strength of Structure) points and circled reaction zones.
Price has rallied strongly into the upper part of the channel and is currently consolidating near the highs.
Projected arrows show two main scenarios: continuation higher toward the channel top or a corrective pullback toward the mid-channel demand (around 101–107 area).
Bias:
Bullish continuation remains valid while price holds above the rising channel support and the 110.646 zone.
A deeper correction would look for demand around 101.148.
2. Heads of the Central Banks
Reserve Bank of Australia (RBA): Governor Michele Bullock
Bank of Japan (BoJ): Governor Kazuo Ueda
3. Interest Rates
Central Bank,Policy Rate,Level
RBA,Cash Rate,4.35%
BoJ,Policy Rate,~1.00%
This strongly supports the Australian Dollar (positive carry for long AUD / short JPY).
4. 10-Year Bond Yields
Market,Approx. 10Y Yield
Australia (AU10Y),~4.94%
Japan (JP10Y),~2.79% – 2.80%
Bond Yield Differential: Australia is higher by roughly 2.14% – 2.15%.
Summary:
Technically, AUDJPY is in a strong long-term uptrend inside an ascending channel, currently testing the upper region. Fundamentally, both the interest rate and bond yield differentials heavily favour the Australian Dollar, supporting a bullish bias on AUDJPY while the structure holds.
Heading toward swing high resistance?AUD/JPY is rising to the resistance level, which is a swing high resistance that is slightly above the 61.8% Fibonacci projection and could reverse from this level to our take-profit
Entry: 114.88
Why we like it:
There is a swing high resistance level that is slightly above the 61.8% Fibonacci projection.
Stop loss: 115.78
Why we like it:
There is a resistance level at the 100% Fibonacci projection.
Take profit: 113.90
Why we like it:
There is an overlapping support level.
Enjoying your TradingView experience? Review us!
Please be advised that the information presented on TradingView is provided to Vantage (‘Vantage Global Limited’, ‘we’) by a third-party provider (‘Everest Fortune Group’). Please be reminded that you are solely responsible for the trading decisions on your account. There is a very high degree of risk involved in trading. Any information and/or content is intended entirely for research, educational and informational purposes only and does not constitute investment or consultation advice or investment strategy. The information is not tailored to the investment needs of any specific person and therefore does not involve a consideration of any of the investment objectives, financial situation or needs of any viewer that may receive it. Kindly also note that past performance is not a reliable indicator of future results. Actual results may differ materially from those anticipated in forward-looking or past performance statements. We assume no liability as to the accuracy or completeness of any of the information and/or content provided herein and the Company cannot be held responsible for any omission, mistake nor for any loss or damage including without limitation to any loss of profit which may arise from reliance on any information supplied by Everest Fortune Group.
AUD/JPY Technical Analysis📉🇦🇺 AUD/JPY Technical Analysis – Bearish Structure After Trendline Breakdown 🔥
The AUD/JPY 2-hour chart has undergone a significant shift in market structure. After respecting a well-defined ascending channel for several sessions, price failed to maintain bullish momentum and experienced a decisive breakdown. This change in character indicates that buyers have lost control, while sellers have taken over with strong momentum. The recent impulsive bearish move confirms that the market sentiment has turned negative in the short term.
📊 Market Structure
Price previously traded inside a healthy ascending channel, consistently forming higher highs and higher lows. However, after failing to break above the 114.68 resistance, buying pressure weakened and the market began printing lower highs. The eventual break below the rising trendline confirmed a bearish market structure shift (MSS), signaling the end of the previous uptrend.
The sharp bearish impulse that followed demonstrates aggressive institutional selling and suggests that the current trend favors the downside unless buyers can reclaim key resistance levels.
🚨 Bearish Momentum
The strong bearish candles indicate that sellers are dominating the market. Large-bodied candles with very little bullish response reflect high selling pressure and increasing downside momentum.
Instead of showing signs of immediate recovery, price continues trading below the broken trendline, reinforcing the bearish outlook.
🎯 Fair Value Gap (FVG) & Order Block
The highlighted Fair Value Gap (FVG) and Bearish Order Block between approximately 112.00–112.55 represent the most important area to monitor.
This zone could attract price for a temporary retracement before sellers re-enter the market.
📌 Why this zone matters:
🔴 Previous institutional selling originated from this area.
⚡ The Fair Value Gap may act as a liquidity magnet.
📉 Bearish rejection here would provide confirmation that sellers remain in control.
✅ A failed retest would strengthen the probability of another impulsive move lower.
📍 Key Levels
🔴 Resistance
114.68 – Major resistance from previous swing highs.
112.00–112.55 – Bearish Order Block and Fair Value Gap (primary sell zone).
🟢 Support
110.31 – Immediate support and the current downside objective.
A confirmed break below 110.31 could expose even lower price levels as bearish momentum accelerates.
📈 Possible Scenarios
🐻 Bearish Scenario (Preferred)
Price retraces into the FVG/Order Block.
Sellers reject the retracement.
Bearish momentum resumes.
🎯 Target: 110.31, with further downside if support fails.
🐂 Bullish Alternative
A bullish recovery would require:
Strong buying pressure.
A clean breakout above the Order Block.
Sustained trading above 112.55.
Without these confirmations, bullish rallies are more likely to be corrective pullbacks rather than a true trend reversal.
⚠️ Risk Management
Avoid chasing the current bearish move after such a strong decline. The higher-probability setup is to wait for price to retrace into resistance and look for bearish confirmation, such as rejection candles, bearish engulfing patterns, or lower-timeframe market structure shifts before considering short positions.
🧠 Conclusion
AUD/JPY has transitioned from a bullish trend into a confirmed bearish market structure after breaking its ascending channel. The strong downside impulse reflects increasing seller dominance, while the highlighted Fair Value Gap and Bearish Order Block provide an attractive area for a potential retracement. As long as price remains below 112.55, the bearish bias remains intact. A rejection from the supply zone would increase the probability of another decline toward 110.31 and potentially lower levels.
📌 Bias: 🐻 Bearish
🎯 Sell Zone: 112.00–112.55 (FVG + Order Block)
🎯 Target: 110.31 and below
🛑 Invalidation: Sustained close above 112.55 with strong bullish momentum.
Buyers gaining strength as upside pressure builds?AUD/JPY has bounced off the pivot and could potentially rise toward the 1st resistance.
Pivot: 111.24
1st Support: 110.04
1st Resistance: 112.23
Disclaimer:
The opinions given above constitute general market commentary and do not constitute the opinion or advice of IC Markets or any form of personal or investment advice.
Any opinions, news, research, analyses, prices, other information, or links to third-party sites contained on this website are provided on an "as-is" basis, are intended to be informative only, and are not advice, a recommendation, research, a record of our trading prices, an offer of, or solicitation for, a transaction in any financial instrument and thus should not be treated as such. The information provided does not involve any specific investment objectives, financial situation, or needs of any specific person who may receive it. Please be aware that past performance is not a reliable indicator of future performance and/or results. Past performance or forward-looking scenarios based upon the reasonable beliefs of the third-party provider are not a guarantee of future performance. Actual results may differ materially from those anticipated in forward-looking or past performance statements. IC Markets makes no representation or warranty and assumes no liability as to the accuracy or completeness of the information provided, nor any loss arising from any investment based on a recommendation, forecast, or any information supplied by any third party.
AUDJPY 4HR CHARTAUDJPY 4H Chart Analysis (Shavyfxhub Strategy) + Full Macro Context
1. Chart Structure (Shavyfxhub Style)
Price has been making consistent lower highs along the red descending trendline (DTL). Multiple RT/RS (role reversal) labels mark previous support turning into resistance.
Key Levels:
Supply Roof: The long-term descending red channel resistance + the cluster around 111.90 – 112.00 (recent rejection zone with “bar” labels).
Immediate resistance: Horizontal red zone near 111.27 – 111.60.
Demand Floors:
Broken demand around 111.00–110.60
Next visible demand zones lower (projected paths point toward 110.00 and below).
Current Price Action (≈ 110.96):
Price has broken lower aggressively from the descending channel. The red projected paths on the right side show continued downside pressure. Structure remains bearish as long as price stays below the descending trendline and the 111.90–112.00 supply roof.
Bias: Short-term bearish. Look for continued selling or weak corrective rallies into the supply roof for potential short setups. A strong reclaim and close above the descending channel would be required to flip the structure.
2. Interest Rates & Differential
Central Bank,Current Policy Rate,Status
RBA (Australia),4.35%,Held (last decision June 2026)
BoJ (Japan),≈ 1.00%,Held (July 30–31 2026 meeting)
This still supports a positive carry for long AUD/JPY in theory, but the chart is currently dominated by technical selling and risk sentiment rather than pure carry.
3. Bond Yields & Differential (as of early August 2026)
Australia 10-year yield: ≈ 4.97%
Japan 10-year JGB yield: ≈ 2.84% – 2.85%
Bond Yield Differential: ≈ +2.12% in favour of Australia.
The yield advantage remains solid for AUD, but it has not prevented the recent technical breakdown on AUDJPY.
4. Heads of Central Banks
Reserve Bank of Australia (RBA): Governor Michele Bullock
Bank of Japan (BoJ): Governor Kazuo Ueda
5. Upcoming Economic Docket / Key Meetings
RBA Monetary Policy Decision: 11 August 2026 (announcement at 14:30 AEST). Markets currently price a very high probability of a hold at 4.35%.
BoJ next Monetary Policy Meeting: 17–18 September 2026.
Other near-term focus: Australian inflation and labour data ahead of the RBA meeting, plus any BoJ commentary on the pace of further normalisation.
Summary (Shavyfxhub + Macro)
Technical (Shavyfxhub): Bearish descending channel, lower highs, recent breakdown. Supply roof at the descending trendline / 111.90–112.00. Demand floors below are being tested. Bias remains down while below the channel.
Macro:
Still solid interest-rate and bond-yield advantage for AUD (+3.35% policy rate gap, +2.12% 10-year yield gap).
However, price is currently ignoring the carry and following the technical structure lower.
Next major catalyst: RBA decision on 11 August.
AUDJPY: Confirmed Bullish Continuation 🇦🇺🇯🇵
AUDJPY broke and closed above a resistance line of a bullish flag pattern on an hourly time frame.
The market will likely continue rising and reach 111.7 level soon.
❤️Please, support my work with like, thank you!❤️
I am part of Trade Nation's Influencer program and receive a monthly fee for using their TradingView charts in my analysis.
AUDJPY MONTHLY PERSPECTIVEAUDJPY Monthly Chart Analysis – Full Shavyfxhub Strategy
1. Chart Structure (Monthly)
Major Historical Supply Roof (1981 SSL): 276.248
Current Major Supply Roof / SSL: 124.190
Key Intermediate Levels: 110.841 – 108.117
Important Demand Floors:
86.278
78.163 (Neckline of Inverted Head & Shoulders)
56.177 – 55.316 (major long-term demand)
Clear Ascending Trendline supporting the multi-year recovery.
Descending trendline from the 2008 high has been broken.
Multiple SS (Strength of Structure), RT/RS, and BAR (Break and Retest) points are clearly marked.
Price is currently trading near the upper structure with room toward the 124 Supply Roof.
Current Bias: Long-term structure is constructive above the ascending trendline and the 86–78 demand zone. A sustained break above 110–124 would open the path for a larger expansion.
2. Course of Major Drops (Especially 2008–2009)
Period,What Happened,Price Action,Main Drivers
2007–2008 Peak,High near 110–115 area,Formed major top,Strong risk-on + high carry
Sept–Oct 2008,Lehman collapse,Violent crash toward 55–60,Massive yen carry trade unwind
2008–2009 Bottom,Deep lows,Tested the 55–56 major demand zone,Extreme risk-off + AUD collapse
2020 COVID Crash,Sharp but shorter drop,Sold off then recovered quickly,Risk-off + commodity shock
AUDJPY is one of the most sensitive pairs to yen carry trade unwinds. When risk aversion spikes, traders close long AUD / short JPY positions, causing sharp drops. The 2008 crash was one of the most severe in the pair’s history.
3. Heads of the Central Banks
Central Bank,Governor
Reserve Bank of Australia,Michele Bullock
Bank of Japan,Kazuo Ueda
4. Interest Rates & Bond Yield Differential
,Current Level
RBA Cash Rate,4.35% inflation 3.8% above 2% mandate
BoJ Policy Rate,1.00%
Interest Rate Differential,Australia higher by ~3.35%
Australia 10Y Yield,~4.94%
Japan 10Y Yield,~2.79% – 2.80%
Bond Yield Differential,Australia higher by ~2.15%
Carry Trade Status:
Strongly favors Long AUD / Short JPY. The interest rate and yield differentials remain significantly positive for the Australian dollar, supporting the carry trade (unlike the 2008 period when risk-off overpowered the differential).
5. Upcoming Policy Meetings
Central Bank,Next Meeting
RBA,11 August 2026
Bank of Japan,17–18 September 2026
Summary (Shavyfxhub View):
AUDJPY remains in a long-term ascending structure after recovering from the deep 2008–2009 and 2020 lows. The major Supply Roof at 124.190 is the key ceiling to watch. Fundamentally, the carry trade still strongly favors the Australian dollar due to the large interest rate and bond yield advantage over Japan. The biggest risk remains a sharp risk-off event or faster-than-expected BoJ tightening that could trigger another carry unwind, similar to 2008.
STRUCTURE NEVER LIES,HISTORY NEVER LIES