AUDSGD Triangle Breakdown Setup | Bearish Pressure Building
AUDSGD is trading within a converging triangle structure while facing rejection from a key supply zone. Price is testing trendline support, and a confirmed breakdown could accelerate bearish momentum.
📉 Key Levels:
• Resistance Zone: 0.9065 - 0.9075
• 1st Target: 0.9010
• 2nd Target: 0.8970
A bre
AUSTRALIAN DOLLAR / SINGAPORE DOLLAR
No trades
No trades
Peers for comparison
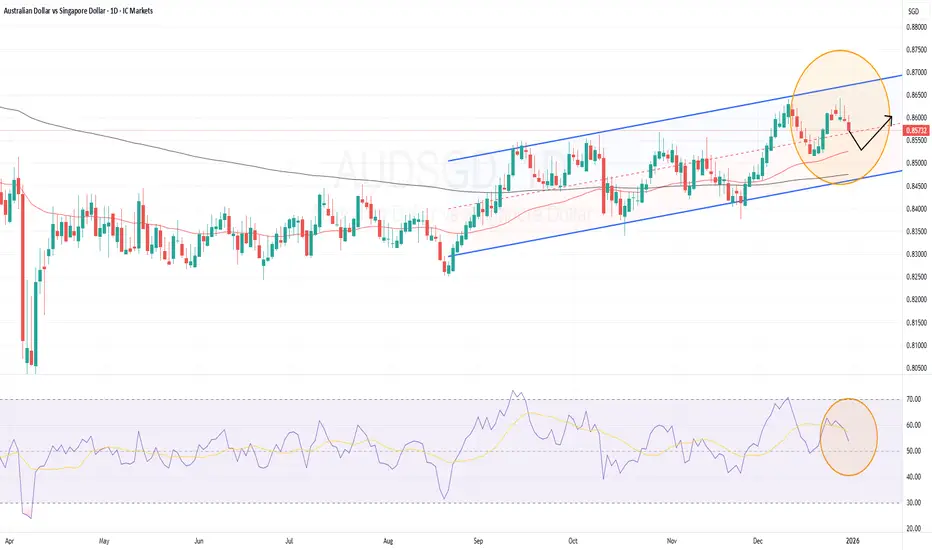
AUDSGD Trade Set up
AUD/SGD continues to trade within a well-defined upward channel on the Daily timeframe, with the 50-day EMA acting as reliable dynamic support. The pair is currently retracing from the upper region of the channel, showing signs of short-term exhaustion. RSI has eased from recent highs, indicating
AUDSGD: H1 DTL BreakI've been alerted by my trend-following signal. Here are the key observations across the two timeframes I've been monitoring.
Daily Timeframe:
Price is above EMA20 > indicating an uptrend
EMA20 above EMA60 > indicating an uptrend
H1 Timeframe:
Price crosses above DTL > indicates upsid
AUD/SGD – Sell Bias on Macro Fundamentals
AUD/SGD enters the week with no significant economic events for either the Australian or Singaporean dollar. In such a scenario, the Singapore dollar's defensive nature and stability tend to come into play, while the Australian dollar, as a risk-on currency, can weaken in quiet or uncertain global
AUDSGD – Bearish Momentum Building!AUDSGD shows strong rejection at the weekly supply zone.
On the 4H chart, price broke below the bullish trendline and is now trading under the 50EMA – a clear shift in structure! 📉
If we see a retest to the trendline or EMA50, this could offer a high-probability sell setup.
Wait for confirmation bef
AUDSGD MARKET ANALYSIS AND PRICE PREDICTIONAUDSGD , has finished consolidating at institutional renegotiation zone, price just broke a structure in favor of the Bulls. Price Will Retrace a bit to give the Bulls a perfect entry at 61.8% discount price. Take Profit 1 is at FVG at Trend line liquidity, Take Profit 2 will Be at Renegotiation Re
See all ideas
Summarizing what the indicators are suggesting.
Oscillators
Neutral
Oscillators
Neutral
Summary
Neutral
Summary
Neutral
Summary
Neutral
Moving Averages
Neutral
Moving Averages
Neutral
Displays a symbol's price movements over previous years to identify recurring trends.
Frequently asked questions
Today, AUD/SGD rate is 0.8800 SGD.
For broader market analysis, dive into the technicals on the AUDSGD live chart.
The safest way to trade AUDSGD is through a reliable broker. Create an account, fund it, and place a buy order.
You can trade AUDSGD directly from TradingView:
– Choose a broker: Explore our supported trading partners and pick one that fits your needs
– Compare options: View available brokers side by side to evaluate fees and features
– Connect your account: Open Supercharts, click "Trade", select your broker, and log in
– Start trading: Place orders without leaving the chart
Tip: If you're new to trading, try paper trading first — it lets you practice strategies in real market conditions without risking funds.
You can trade AUDSGD directly from TradingView:
– Choose a broker: Explore our supported trading partners and pick one that fits your needs
– Compare options: View available brokers side by side to evaluate fees and features
– Connect your account: Open Supercharts, click "Trade", select your broker, and log in
– Start trading: Place orders without leaving the chart
Tip: If you're new to trading, try paper trading first — it lets you practice strategies in real market conditions without risking funds.
It's worth checking AUDSGD rate change for various periods to get the full picture:
– 1 day — −0.23%
– 1 week — −1.11%
– 1 month — −0.80%
AUDSGD's all-time low was 0.7989 SGD (Mar 19, 2020), and its highest price is 1.3608 SGD (Feb 17, 2012). Track the dynamics with the latest forex news right on TradingView.
– 1 day — −0.23%
– 1 week — −1.11%
– 1 month — −0.80%
AUDSGD's all-time low was 0.7989 SGD (Mar 19, 2020), and its highest price is 1.3608 SGD (Feb 17, 2012). Track the dynamics with the latest forex news right on TradingView.
When trading AUDSGD, one should keep in mind many factors.
First, analyze the fundamentals:
– Macroeconomic data: Inflation, GDP, employment, and other key indicators in the economies behind both currencies
– Central bank policy: Interest rate decisions and monetary policy from the respective central banks
– Market sentiment: Check what other traders anticipate
– News flow: Geopolitical events and economic releases
Then check technical ratings:
– Today — sell
– 1-week — sell
– 1-month — sell
Identify the trend, watch key levels (support and resistance), consider volatility and upcoming economic events. Then, you'll be closer to an informed decision.
First, analyze the fundamentals:
– Macroeconomic data: Inflation, GDP, employment, and other key indicators in the economies behind both currencies
– Central bank policy: Interest rate decisions and monetary policy from the respective central banks
– Market sentiment: Check what other traders anticipate
– News flow: Geopolitical events and economic releases
Then check technical ratings:
– Today — sell
– 1-week — sell
– 1-month — sell
Identify the trend, watch key levels (support and resistance), consider volatility and upcoming economic events. Then, you'll be closer to an informed decision.
AUDSGD volatility measures how much the exchange rate fluctuates over time, i.e. how quickly and how strongly it moves up or down.
The current volatility rating is 0.34%.
What it means for traders:
– Higher volatility: Larger and faster price swings → higher risk and opportunity
– Lower volatility: More stable price movement → smaller trading ranges
– Market behavior: Volatility often increases during major economic news or central bank decisions
Volatility helps traders estimate risk and position sizing. It's also useful for adapting strategies to market conditions.
How to use volatility:
– Compare volatility across other currency pairs
– Combine with technical analysis (trends, support/resistance)
– Monitor economic events that may increase market movement
The current volatility rating is 0.34%.
What it means for traders:
– Higher volatility: Larger and faster price swings → higher risk and opportunity
– Lower volatility: More stable price movement → smaller trading ranges
– Market behavior: Volatility often increases during major economic news or central bank decisions
Volatility helps traders estimate risk and position sizing. It's also useful for adapting strategies to market conditions.
How to use volatility:
– Compare volatility across other currency pairs
– Combine with technical analysis (trends, support/resistance)
– Monitor economic events that may increase market movement
AUDSGD is quoted as how many SGD (quote currency) it takes to buy one AUD (base currency).
For example, if the pair trades at 1.50, it means 1 AUD = 1.50 SGD.
What can influence the rate:
– Supply and demand: Driven by trade, investment flows, and speculation
– Economic data: Inflation, GDP, employment reports
– Central bank policy: Interest rates and monetary decisions
Follow these and more events in the Economic Calendar.
For example, if the pair trades at 1.50, it means 1 AUD = 1.50 SGD.
What can influence the rate:
– Supply and demand: Driven by trade, investment flows, and speculation
– Economic data: Inflation, GDP, employment reports
– Central bank policy: Interest rates and monetary decisions
Follow these and more events in the Economic Calendar.