AUD/USD: THE 0.68900 MACRO WEDGE REJECTION!🇦🇺 🛑
Trapped right below the 0.70000 level after a sharp fake-out. Are you buying into this weak relief bounce, or lining up your shorts for the next leg down? 🤔
The Aussie dollar is struggling for momentum as global risk appetite softens against a resilient US dollar. On this 4-hour OANDA chart,
Australian Dollar / U.S. Dollar
No trades
No trades
Compare with AUD to USD
Details
The Australian Dollar and the US Dollar pair belong the Majors, a group of the most popular traded pairs in the world. This pair's popularity soared because traders were attracted to the interest rate differential of the pair. This has waned in recent years due to economic volatility worldwide.
AUDUSD is Nearing a Strong Support!Hey Traders, in today's trading session we are monitoring AUDUSD for a buying opportunity around 0.69800 zone, AUDUSD is trading in an uptrend and currently is in a correction phase in which it is approaching the trend at 0.69800 support and resistance area.
Trade safe, Joe.
AUDUSD is Nearing a Strong Support!Hey Traders, in today's trading session we are monitoring AUDUSD for a buying opportunity around 0.69800 zone, AUDUSD is trading in an uptrend and currently is in a correction phase in which it is approaching the trend at 0.69800 support and resistance area.
Trade safe, Joe
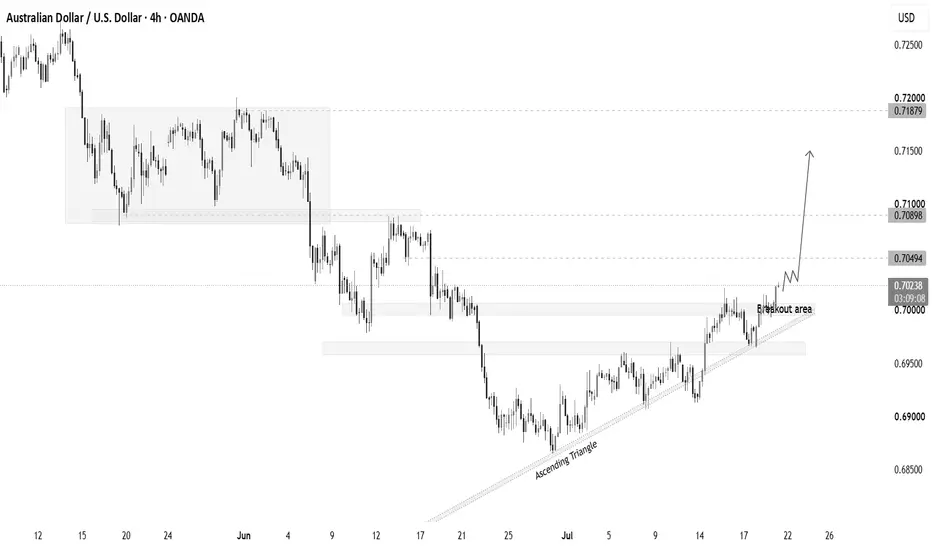
AUD/USD is show strong bullish structure with Ascending patternAUD/USD – 4H Time Frame
Bullish Ascending Triangle Breakout Setup
AUD/USD is showing a strong bullish structure with an Ascending Triangle pattern forming on the 4-hour chart. The breakout above the key resistance area around 0.70000 signals growing buying momentum and potential continuation to th
AUDUSD: Selling Pressure Mounts as Price Approaches ResistanceAUDUSD continues to trade within an ascending channel on the H1 timeframe; however, recent recovery attempts have repeatedly stalled around the 0.7010 level—a zone coinciding with the Ichimoku cloud and the upper boundary of the resistance area. This indicates that bullish momentum is fading, while
AUDUSD: Horizontal ConsolidationAUDUSD is partially trapped in a sideways channel, moving in momentum of support and resistance. The pair have been ranging horizontally for a couple of weeks now, in respect to the structure, giving the traders the chance to trade the both sides. Price is at the resistance level, as we anticipate a
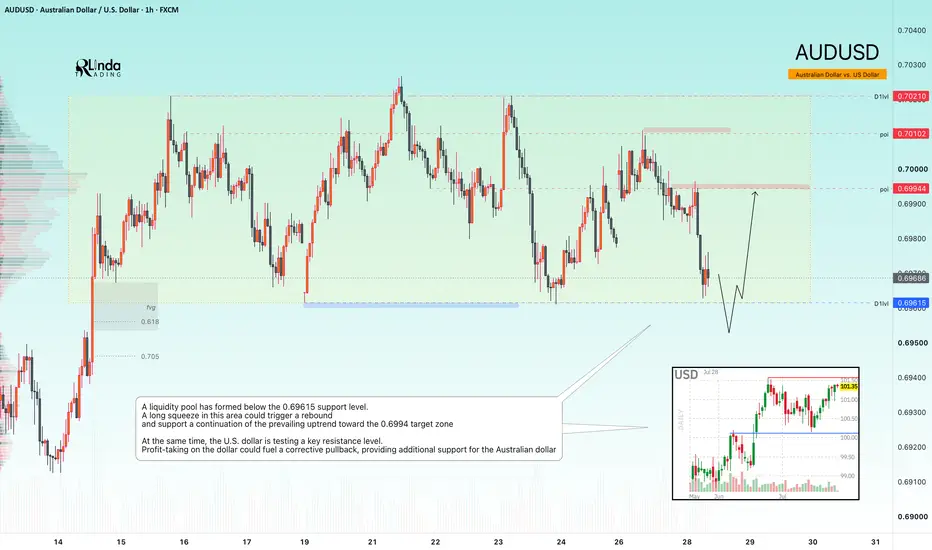
AUDUSD - A long squeeze could trigger a rally FX:AUDUSD is testing a key support zone, with a significant liquidity pool positioned just below it. The broader daily trend remains bullish, giving buyers an opportunity to regain control
At the same time, the U.S. Dollar Index is testing resistance. Profit-taking near the 101.5 area could tr
AUDUSD H1 | Bullish Bounce Off Pullback SupportMomentum: Bullish
Price is currently above the ichimoku cloud.
Buy entry: 0.70065
- Pullback support
- 61.8% Fib retracement
Stop Loss: 0.69905
- Swing low support
Take Profit: 0.70266
- Swing high resistance
High Risk Investment Warning
Stratos Markets Limited (fxcm.com/uk), Stratos Europe Ltd
AUDUSD H4 | Possible Bullish Bounce AheadBased on the H4 chart analysis, we could see the price fall to our buy entry level at 0.6960, which is a pullback support that aligns with the 50% Fibonacci retracement and the 100% Fibonacci projection.
Our stop-loss is set at 0.6915, which is a pullback support.
Our take profit is set at 0.7013,
See all ideas
Summarizing what the indicators are suggesting.
Oscillators
Neutral
SellBuy
Strong sellStrong buy
Strong sellSellNeutralBuyStrong buy
Oscillators
Neutral
SellBuy
Strong sellStrong buy
Strong sellSellNeutralBuyStrong buy
Summary
Neutral
SellBuy
Strong sellStrong buy
Strong sellSellNeutralBuyStrong buy
Summary
Neutral
SellBuy
Strong sellStrong buy
Strong sellSellNeutralBuyStrong buy
Summary
Neutral
SellBuy
Strong sellStrong buy
Strong sellSellNeutralBuyStrong buy
Moving Averages
Neutral
SellBuy
Strong sellStrong buy
Strong sellSellNeutralBuyStrong buy
Moving Averages
Neutral
SellBuy
Strong sellStrong buy
Strong sellSellNeutralBuyStrong buy
Displays a symbol's price movements over previous years to identify recurring trends.
Frequently asked questions
The current rate of AUDUSD is 0.69676 USD — it has decreased by −0.07% in the past 24 hours. See more of AUDUSD rate dynamics on the detailed chart.
The value of the AUDUSD pair is quoted as 1 AUD per x USD. For example, if the pair is trading at 1.50, it means it takes 1.5 USD to buy 1 AUD.
The term volatility describes the risk related to the changes in an asset's value. AUDUSD has the volatility rating of 0.49%. Track all currencies' changes with our live Forex Heatmap and prepare for markets volatility.
The AUDUSD showed a 0.16% rise over the past week, the month change is a 1.29% rise, and over the last year it has increased by 6.04%. Track live rate changes on the AUDUSD chart.
Learn how you can make money on rate changes in numerous trading ideas created by our community.
AUDUSD is a major currency pair, i.e. a popular currency paired with USD.
Currencies are usually traded through forex brokers — choose the one that suits your needs and go ahead. You can trade AUDUSD right from TradingView charts — just log in to you broker account. Check out the list of our integrated brokers and find the best one for your needs and strategy.
When deciding to buy or sell currency one should keep in mind many factors including current geopolitical situation, interest rates, and other. But before plunging into a deep research, you can start with AUDUSD technical analysis. The technical rating for the pair is sell today, but don't forget that markets can be very unstable, so don't stop here. According to our 1 week rating the AUDUSD shows the neutral signal, and 1 month rating is buy. See more of AUDUSD technicals for a more comprehensive analysis.