EURUSDHello Traders! 👋
What are your thoughts on EURUSD?
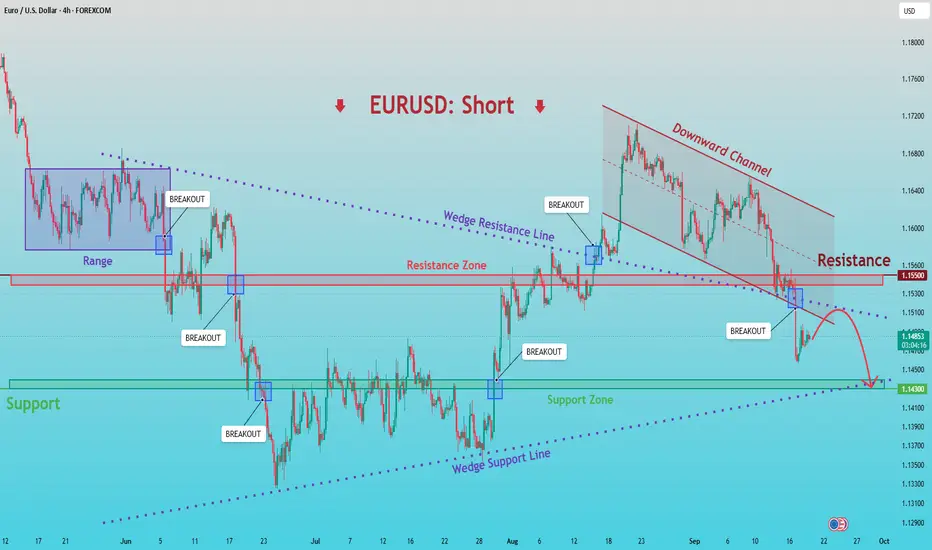
EURUSD remains under bearish pressure after breaking below a key support zone. This area, which previously acted as support, has now turned into resistance and is reinforced by a descending trendline and the 50%–61.8% Fibonacci retracement, creating a strong confluence resistance zone.
The recent rally is viewed as nothing more than a corrective move and a pullback toward the broken support. After reaching this resistance area, price has already shown signs of rejection, suggesting that selling pressure is beginning to return. A period of short-term consolidation around the current levels is possible, but as long as price remains below the resistance zone, the broader bearish outlook remains intact. In this scenario, the next downside target is located around 1.1250.
On the other hand, a sustained breakout and daily close above the resistance zone and the descending trendline would invalidate the bearish scenario.
If you found this analysis helpful, please support it with a like and share your thoughts in the comments! Good luck with your trades!❤️
Forex market
EURUSD - Daily CLS - Model 1Hi Friends, New CLS Range has been created and Im looking for Long Model 1 trade setup. As always after the manipulation in to the Key Level, below the CLS range and reaction, we need to see a confirmation switch from the manipulation phase - CIOD (change in order flow) in the the expansion.
⏳ Stay patient and enter only after candle close.
🎯 Target: 50% Liquidity - of the CLS range.
🎥 CLS Model 1 Video Explanation 📚 Bullish CLS Strategy Structure ⚠️ Risk Control is Key to Long Term Success
📍 Always place a proper stop loss
📍 Manage your risk per trade
📍 Stay disciplined & avoid emotional trading
📍Take the Trade only if you understand logic behind it
📍 Protect Capital First
🚀Boost | 🔁 Share | 💬 Comment | ✅Follow for more CLS setups
Adapt useful, Reject useless and add what is specifically yours.
David Perk
USDCHF - Safe-Haven Swiss Franc Strength Weighs (20.07.2026)Usd/chf – M30 – Symmetrical Triangle Breakdown Pattern
Usd/chf has broken below the lower boundary of a well-defined symmetrical triangle, indicating a potential continuation of bearish momentum. Price also struggled beneath the nearby resistance zone and Ichimoku cloud resistance, reinforcing seller dominance. A sustained move below the breakout point could expose the next downside support levels, while any recovery into the resistance zone may attract fresh selling pressure. Traders should monitor upcoming macroeconomic releases for confirmation of the directional move.
SELL Setup
🔴 1st Support : 0.80315
🔴 2nd Support : 0.80118
🟢 Resistance Zone : 0.80842 – 0.80927
⚠️ Disclaimer: This analysis is for educational purposes only.
Support the idea 🚀 Boost | 💬 Comment | 🔁 Share
🔸🔸 Charts Don't Lie, Traders Don't Quit 🔸🔸
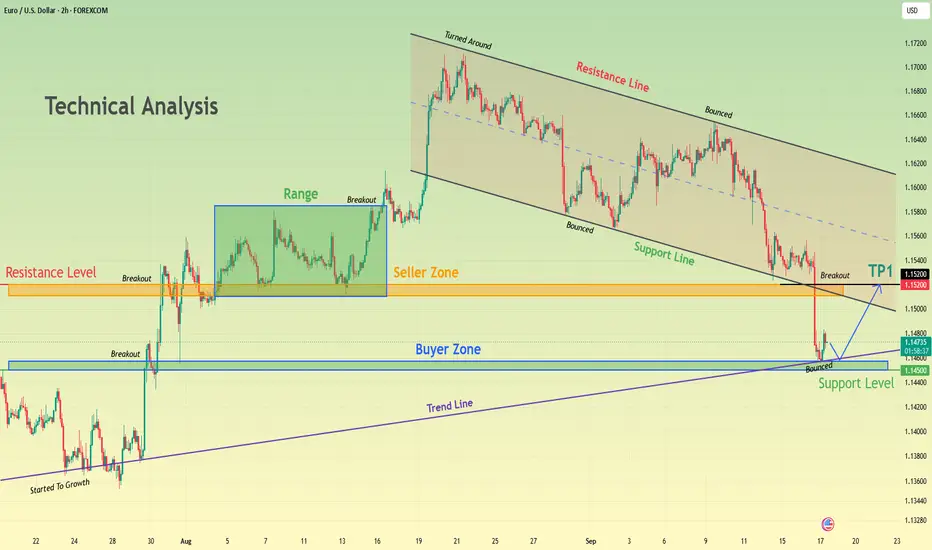
Euro Approaches Major Resistance While Bearish Trendline HoldsHello traders! Here’s my technical outlook based on the current EURUSD (3H) chart structure. EURUSD previously traded below a long-term descending trendline before breaking down from a consolidation range, confirming bearish momentum. After finding support near the 1.1400 Buyer Zone, price recovered into a rising channel but continues to face strong resistance around the 1.1480 Seller Zone. Currently, EURUSD is trading above the 1.1400 Buyer Zone while testing both the upper channel boundary and the long-term descending trendline. The latest rejection from this confluence suggests sellers remain active at resistance. As long as EURUSD remains below the 1.1480 Seller Zone and the descending trendline, the bearish scenario remains valid. A rejection from current levels could push price back toward the 1.1400 Buyer Zone (TP1), where buyers may attempt to defend support. Please share this idea with your friends and click "Boost" 🚀
USDJPY Bullish Breakout | Support Holding Strong (1H)
USDJPY is holding firmly above the highlighted support zone after breaking out of the triangle pattern. Buyers remain in control, increasing the probability of a continuation toward higher resistance levels.
The overall market structure remains bullish while price trades above support.
Key Levels:
* 🟢 Support: 162.10 – 162.20
* 🔴 1st Resistance: 162.80
* 🔴 2nd Resistance: 163.20
* 📈 Bias: Bullish above support.
Analysis:
As long as price holds above the marked support zone, buyers could push the market toward the first resistance. Continued bullish momentum may extend the move toward the second resistance. A confirmed breakdown below support would invalidate the bullish scenario.
⚠️ Educational purposes only. Always use proper risk management before entering any trade.
EURUSD H4 Order Block BounceEURUSD is trading inside a high-confluence H4 Order Block after sweeping short-term sell-side liquidity. If buyers defend this area, the path toward overhead buy-side liquidity remains intact.
The best trades begin where everyone else gives up.
Market Structure
• Price is reacting from a higher-timeframe H4 Order Block.
• Short-term sell-side liquidity has already been engineered.
• Current discount pricing favors bullish continuation if confirmation appears.
• Buy-side liquidity above remains the primary draw.
Bullish Scenario
🟢 Hold the H4 Order Block after the liquidity sweep.
🟢 Print bullish displacement from the discount zone.
🎯 TP1: Internal Buy-Side Liquidity.
🎯 TP2: External Buy-Side Liquidity (Swing High).
Execution Plan
✅ Wait for bullish confirmation before entering.
✅ Use the H4 Order Block as the decision zone.
🛑 Invalidation below the recent liquidity sweep.
🎯 Scale out at each liquidity objective.
GBPUSD - Under Pressure & Bearish Momentum (21.07.2026)FX:GBPUSD has confirmed a bearish breakdown from its rising intraday channel after failing to sustain above the highlighted resistance zone around 1.3462–1.3483. Price rejected the breakout retest and is now showing signs of renewed selling pressure, suggesting bears remain in control. A sustained move below current levels could expose the next downside support areas while only a decisive recovery above the resistance zone would invalidate the bearish outlook.
(SELL Setup)
🔴 1st Support: 1.33431
🔴 2nd Support: 1.32899
🟢 Resistance Zone: 1.34624 – 1.34828
✅ Sterling remains cautious following the UK's political transition, with markets assessing the new government's fiscal direction.
⚠️ Disclaimer: This analysis is for educational purposes only.
Support the idea 🚀 Boost | 💬 Comment | 🔁 Share
🔸🔸 Charts Don’t Lie, Traders Don’t Quit 🔸🔸
EURUSD Long: Holds Ascending Channel — Next Retest 1.1480?Hello traders! Here’s my technical outlook based on the current EURUSD (1H) chart structure. EURUSD previously traded inside a range before breaking below support, confirming a bearish continuation. After reaching the 1.1420 Demand Zone, buyers stepped in and price formed a steady ascending channel, signaling a gradual recovery. The latest pullback found support near the lower boundary of the channel, keeping the bullish structure intact.
Currently, EURUSD is trading above the 1.1420 Demand Zone while remaining below the 1.1480 Supply Zone. Price continues to respect the ascending channel, suggesting buyers still have the advantage despite the recent correction.
As long as EURUSD remains above the 1.1420 Demand Zone and continues respecting the ascending channel, the bullish scenario remains valid. A continuation higher could push price toward the 1.1480 Supply Zone (TP1). Manage your risk!
CHFJPY: Contracting Triangle Signals Bullish BreakoutCHFJPY: Contracting Triangle Signals Bullish Breakout
CHFJPY is forming a contracting triangle, with higher lows pushing into a horizontal resistance area around 201.40.
This is typically a bullish continuation pattern. Once the price breaks out of the pattern, it will signal an upward continuation move towards the targets shown on the chart near 201.80 and 202.30.
While the quick target can be easily reached as it is also part of the developing pattern.
You can find more details on the chart.
Thank you and good luck! 🍀
⚠️PS: Do your own analysis and use your own strategy to join the trade.
❤️ If this analysis helps your trading day, please support it with a like or comment ❤️
GBPUSD Price Update – Clean & Clear Explanationrecent rejection from the 1.3550–1.3565 resistance zone suggests that buyers lost momentum after an aggressive bullish rally. This area attracted strong selling pressure, leading to profit-taking and fresh short positions.
Fundamental factors could also be contributing to the current price action. Traders are closely monitoring upcoming UK and U.S. economic releases, inflation expectations, central bank policy outlooks, and overall U.S. Dollar strength. Any improvement in USD demand or weaker sentiment toward the British Pound can increase selling pressure on GBP/USD.
Technically Price also failed to maintain its move above the rising trendline, indicating a potential short-term shift in market structure. The current pullback is likely a healthy correction as the market searches for liquidity at lower support levels before deciding on its next direction.
As long as price remains below the recent high, the bearish correction may continue toward the next support zones. However, a strong recovery above resistance would invalidate this bearish outlook and could resume the broader uptrend.
This analysis is shared for educational purposes only and should not be considered financial advice.
USDCHF H2: Why 0.8063 Is the Only Level That Matters▪️ USDCHF H2 SNAPSHOT — EXECUTIVE SUMMARY
▪️ the swissy has faded to 0.8072 after stalling beneath 0.8095. The rejection has shifted the near-term tone lower.
▪️ Primary outlook is bullish overall — 0.8095 caps the recovery. Sellers stay in charge until it is reclaimed on a close.
▪️ Key resistance zone: 0.8095, defended 20 times on the fade. Above it the chart is thin — a clean break has room to extend.
▪️ Major defense line: 0.8034 — a very strong level at 72 retests, the shelf that stands between a pullback and a trend change.
▪️ Primary downside targets: 0.8034 first, with 0.8013 below it, where liquidity is parked.
▪️ Major liquidity magnet below: 0.8034–0.8013 — the zone that would draw a deeper flush.
▪️ Bullish scenario: Reclaim 0.8095 and 0.80950 becomes the objective bulls want.
▪️ KEY LEVELS
▪️ Current Price: 0.8073
RESISTANCEs
▪️ 0.8095 — ★★★ 7.8 Strong · 20 retests
SUPPORTs
▪️ 0.8063 — ★★★ 7.5 Strong · 15 retests
▪️ 0.8034 — ★★★★ 8.2 Very Strong · 72 retests
▪️ 0.8013 — ★★ 6.7 Moderate · 39 retests
▪️ ProjectSyndicate Levels Desk — Overview of key S/R zones for FX, NVDA, NQ, ES & GC traders every week. Subscribe to stay up to date with the latest levels.
EUR/NZD Melted , Best Place For Buy Cleared To Get 250 Pips !Here Is My 8H EUR/NZD Chart And This Is My Opinion , We have a great movement to downside and we entered a sell trade from the highest place and the price moved more than 500 pips as mentioned in the link below , and now as usual i`m looking for the best place to buy and finally i have the best place for buy , this daily support mentioned on the chart , this d support pushed the prices to upside last time more than 700 pips so it`s a very strong and sold support and we can buy from it , so i`m waiting the price to touch it and we can enter a buy trade and we can targeting from 100 to 200 pips at least to have a small correction after this massive movement to downside , if we have a daily closure below this support then this idea will not be valid anymore .
Entry Reasons :
- Daily Support
- Over Sold
- Big Movement Without Correction
EURUSD is Nearing a Decent Support!Hey Traders, in today's trading session we are monitoring EURUSD for a buying opportunity around 1.14000 zone, EURUSD is trading in an uptrend and currently is in a correction phase in which it is approaching the trend at 1.14000 support and resistance area.
Trade safe, Joe.
EURUSD Bulls Defend Channel SupportEURUSD Bulls Defend Channel Support
EURUSD continues to respect the channel that has guided price action throughout July, keeping the broader bullish structure intact.
After rejecting the lower boundary of the channel, buyers stepped back into the market and defended trend support once again.
The recent pullback appears corrective rather than impulsive, suggesting the pair may be preparing for another move toward the upper boundary of the channel.
As long as price remains above the channel support, the bias remains positive.
Main Targets:
1.1445
1.1475
You can find more details on the chart.
Thank you and good luck! 🍀
⚠️PS: Do your own analysis and use your own strategy to join the trade.
❤️ If this analysis helps your trading day, please support it with a like or comment ❤️
EURGBP at Major Support — Is a Bullish Reversal Finally Here?EURGBP ( FX:EURGBP ) is currently trading inside a heavy support zone(0.8511 GBP-0.8444 GBP)). On the higher timeframe, we can also see a Positive Regular Divergence (RD+) between two consecutive valleys, which could be an early sign of a potential bullish reversal.
From an Elliott Wave perspective, EURGBP appears to have completed its five-wave bearish structure, suggesting that a corrective move to the upside may begin soon.
The key trading level to monitor if EURGBP starts moving higher is 0.8522 GBP.
I expect EURGBP to rebound from the Potential Reversal Zone(PRZ) and continue its bullish correction, with an initial target around 0.8510 GBP.
First Target: 0.8510 GBP
Second Target: 0.8519 GBP
Stop Loss(SL): 0.8465 GBP
What’s your view on EURGBP? Do you think the pair can resume its bullish trend, or should we expect another bearish move first?
💡 Please respect each other's opinions and express agreement or disagreement politely.
📌Euro/ British Pound Analyze (EURGBP), 1-hour time frame.
🛑 Always set a Stop Loss(SL) for every position you open.
✅ This is just my idea; I’d love to see your thoughts too!
🔥 If you find it helpful, please BOOST this post and share it with your friends.
EUR/USD: THE 1.1460 WEDGE REBOUND! 💶 🚀
Slamming down toward the 1.1395 support floor. Are you panic-selling this local dip, or preparing to buy the ultimate trendline bounce? 🤔
The euro is undergoing a short-term liquidity flush as traders adjust positions ahead of upcoming economic data. On this 1-hour OANDA chart, EUR/USD is coiling inside a giant Wedge pattern, sliding down toward its primary macro Support line following the recent False break above overhead resistance. 📈💥
Look closely at the purple blueprint trajectory mapping out the upcoming path. The algorithm is poised to complete this localized markdown sequence directly into the 1.1390 - 1.1405 support zone, where institutional buy-limit blocks are loaded to absorb panic sales before sparking a high-velocity reversal straight back toward the 1.1460 Resistance line. 🎯🪤
Maintaining strict discipline is your true advantage in this market. Trying to short directly into a well-defined macro support floor is a quick way to get caught in a violent squeeze. Smart money waits for the price to hit verified demand blocks before stepping in alongside the whales. 🧘♂️⚡
Trade Parameters:
🛒 Long Zone: 1.1390 - 1.1405 🛍️
🛑 Stop-Loss: Hourly close below 1.1365 ❌
💰 Take-Profit: 1.1460 🎯
The bears are getting comfortable pushing this short-term slide, completely unaware of the massive buy wall waiting at the wedge floor. Stay focused, stick to your plan, and let the algorithm carry the trade up to our target. See you at the top resistance! 🚀💎
EURUSD H1 AnalysisPrice is approaching the demand zone, a key area to watch for potential bullish reactions. A strong rejection from this zone could lead to a move toward the resistance level. However, a breakdown below demand may invalidate the bullish outlook.
Educational Purpose Only Not Financial Advice
USD/JPY Bullish BOS Targets Weak High LiquidityMarket Thesis:
USD/JPY maintains a bullish intraday structure on the 15-minute timeframe, supported by successive bullish CHoCH and BOS signals. Price has broken above the recent consolidation and is now trading directly beneath the marked Weak High at 162.672, making that liquidity level the immediate objective.
The bullish bias remains valid while price holds above the 162.390–162.420 demand area and the marked Strong Low near 162.400.
Visible Confluences — 15-Minute Chart:
Current price: approximately 162.642.
Bullish BOS confirmed above approximately 162.590–162.600.
Immediate buy-side liquidity: Weak High at 162.672.
Recent consolidation range: approximately 162.450–162.540.
Primary marked demand zone: 162.390–162.480.
Protected structural level: Strong Low near 162.400.
Secondary marked demand zone: approximately 162.100–162.160.
Deeper support zones remain visible around 162.030–162.090 and 161.890–161.970.
Multiple LuxAlgo bullish BOS and CHoCH signals confirm improving upward order flow.
Repeated EQH/EQL markings inside the prior range indicate liquidity accumulation before the latest expansion.
Trade Scenarios:
Setup 1: Bullish Breakout Continuation
Direction: Buy
Entry Zone: 162.675–162.690
Trigger: A confirmed 15-minute close above 162.672, followed by a successful retest or strong bullish momentum candle.
Stop Loss: 162.585
TP1: 162.750
TP2: 162.820
TP3: 162.900
This setup requires genuine acceptance above the Weak High. Avoid entering solely on an intrabar spike.
Setup 2: BOS Retest Buy
Direction: Buy
Entry Zone: 162.575–162.605
Trigger: Lower-timeframe bullish CHoCH, rejection wick, or displacement candle after the former BOS level is retested.
Stop Loss: 162.495
TP1: 162.672
TP2: 162.750
TP3: 162.820
This is the preferred continuation setup because it uses the broken structural level as potential support.
Setup 3: Deep Pullback Into Demand
Direction: Buy
Entry Zone: 162.395–162.445
Trigger: Liquidity sweep below the local range, followed by an LTF bullish CHoCH and recovery above 162.420.
Stop Loss: 162.345
TP1: 162.500
TP2: 162.600
TP3: 162.672
A sustained 15-minute close below 162.390 would weaken the immediate bullish thesis and expose the lower marked demand zones.
Refinement Tip:
For the best Risk/Reward, monitor the identified zones on the 1-minute to 5-minute timeframes. Execute only after a clear structural shift, such as an LTF bullish CHoCH, strong rejection, or momentum displacement. At the current price, chasing directly beneath 162.672 liquidity offers inferior positioning compared with a confirmed breakout or controlled retracement.
⚠️ Disclaimer:
Trading financial markets involves significant risk, and no setup is guaranteed. This analysis reflects the visible 15-minute market structure and probability-based scenarios at the time of observation. It is provided strictly for educational and analytical purposes. Always apply independent confirmation, disciplined position sizing, and predefined risk management.
NZD/USD Holds Strong – Can Bulls Reach 0.5940?NZD/USD Holds Strong – Can Bulls Reach 0.5940?
From our previous analysis, NZDUSD reached the first target near 0.5855 and the price started to rally again.
It seems that the price is well positioned to rise further from this area considering that the bullish trend has not changed all these days.
On the other hand, NZD continues to hold strong the bullish momentum created after the RBNZ meeting. With or without a strong reason, this is another topic, but NZD could recover again.
The question is only what market catalyst can create this move.
Targets:
0.5900
0.5940
You can find more details on the chart.
Thank you and good luck! 🍀
⚠️PS: Do your own analysis and use your own strategy to join the trade.
❤️ If this analysis helps your trading day, please support it with a like or comment ❤️
NZDCAD - Major Resistance Back in FocusNZDCAD is approaching a high-confluence resistance area, where multiple technical factors are coming together. 📊
Price is currently retesting the intersection of:
• The upper bound of the rising red triangle.
• The previous major highs, which have repeatedly acted as resistance.
📌 As long as this confluence continues to hold, we will be looking for trend-following short setups, anticipating another rejection from this key resistance area.
As always, rather than selling blindly into resistance, we will wait for bearish confirmation before considering any short positions.
Will sellers defend this confluence once again and trigger the next move lower? 🤔
⚠️ Disclaimer: This is not financial advice. Always do your own research and manage risk properly.
📚 Stick to your trading plan regarding entries, risk, and management.
Good luck! 🍀
All Strategies Are Good; If Managed Properly!
~Richard Nasr
#GBPUSD: 400+ Pips Selling Opportunity! Get Ready! Price initially extended the bullish momentum but then dropped. Analysing the drop and closing candles suggests a potential further selling decline. A possible entry point is at a minor correction. If the rejection occurs at the target level, a selling entry can be confirmed. The potential targets are 1.30 or 1.28, both of which offer significant potential. If you agree with our idea, please like and comment for more!
Team Setupsfx_