# EURJPY Week W38-2026: BOJ Hikes to 1.25% but Yen Weakens...# EURJPY Week W38-2026: BOJ Hikes to 1.25% but Yen Weakens Anyway, Exposing the Carry-Unwind Trap as Price Holds Above VWAP 178.9 | 18 September 2026
**Reference data** | week 2026-W38
- Symbol: EURJPY
- Week: 2026-W38
- Bias: bearish
- Positioning decision: stand aside
- Market regime: downward trend
- Approach: trend following
- Multi-timeframe structure: bearish alignment
- VWAP weekly: 178.9
- TrendSL weekly: 182.78
- Thesis snapshot close: 180.44
- Current market price: 179.27 (as of 2026-09-18T05:53:00+00:00; source mt5:EURJPY:1m)
- US 10Y yield: 5.01%
- US 2Y yield: 4.74%
- US 10Y real yield: 2.68%
- DXY current reference: 100.291; weekly model bias remains bearish
## L0 - Regime Identification
The dominant news backdrop for this week is the Bank of Japan's decision on September 18 to raise its policy rate by 25 basis points, moving from 1.00% to 1.25% in a 7-2 vote. That takes the BOJ's rate to its highest level in 31 years. And yet, the yen weakened by as much as 0.8% after the announcement, with USDJPY touching approximately 157.145. The hike had been widely expected, and the price reaction shows that the announcement did not deliver enough of a hawkish surprise to generate immediate yen strength. Carry-unwind risk remains a structural scenario for EURJPY, but this morning's price action does not show that scenario being activated. Friday's EURJPY price of 179.27 as of 05:53 UTC (source: mt5:EURJPY:1m) is above weekly VWAP at 178.9, so short-term momentum is running against the bearish structure.
The dissenting votes from BOJ board members Asada and Sato -- who argued growth was insufficient and inflation had not accelerated enough -- add genuine ambiguity to whether the pace of future hikes will meet market expectations. Japan's August core CPI printed at 1.7% year-over-year versus 1.8% expected, a miss that supports the dissenters' caution. The ECB had also raised its deposit rate by 25 basis points to 2.50% on September 10. Because both central banks moved by 25 basis points, the direct policy-rate gap remains about 1.25 percentage points. The latest decisions did not widen or narrow that spread; its future direction depends on which central bank delivers the next move.
## L1 - Driver Stack
The forces shaping this pair are in genuine conflict right now:
-> **BOJ hawkishness **: The 25bp hike to 1.25% did not narrow the latest policy gap because the ECB also raised its deposit rate by 25bp. If the BOJ delivers another hike without a matching ECB increase, the interest-rate gap would narrow and reduce the economic support for EURJPY longs.
-> **ECB's recent hike to 2.50% **: The ECB moved its deposit rate higher by the same 25bp increment as the BOJ. The gap therefore remains about 1.25 percentage points, preserving rather than expanding the existing carry advantage for EUR over JPY.
-> **Post-hike yen weakness **: When a currency fails to rally on its own central bank's rate hike, that is a sign of exhausted expectations. However, yen weakness in the immediate aftermath actually keeps EURJPY elevated, complicating near-term short entries.
-> **Retail crowd 62% net long **: When retail participants are heavily skewed long, informed market participants often lean the other way. This is crowding risk -- the risk that an overcrowded position unwinds sharply when sentiment shifts. This is context only; it has not triggered a calibrated directional signal.
-> **Price action score **: Technical signals are scoring positively, which directly conflicts with the macro overlay. The structural/macro layer overrides this, but traders should watch which driver takes control as the week develops.
-> **US liquidity contraction **: The Fed liquidity proxy fell approximately 59.5 billion USD over four weeks to 5,749.5 billion USD (FRED, as of September 16). TGA growth of 5.91% over the same period can drain reserves from the banking system, adding a mild tightening impulse to dollar funding conditions. This is background context for risk appetite, not a standalone directional signal for EURJPY.
## L2 - Macro Snapshot
The US yield curve adds an important layer here. The 10Y yield sits at 5.01%, the 2Y at 4.74%, and critically, the 10Y real yield -- what you actually earn after stripping out inflation expectations -- is at 2.68%. A real yield above 2.5% historically exerts significant drag on risk assets and carry currencies, because it raises the opportunity cost of holding riskier positions when you can earn a substantial inflation-adjusted return in safe US paper. That dynamic indirectly pressures EURJPY by dampening the global risk appetite that typically sustains carry trades.
The CNN Fear and Greed index at 29 out of 100 registers fear in US equities (as of September 18). VIX at 15.44 on September 17 is within normal range, so there is no acute volatility spike -- but the equity sentiment backdrop is cautious rather than buoyant. Carry trades thrive in low-volatility, high-risk-appetite environments; a fearful equity market reduces that tailwind. SOFR minus IORB at negative 3 basis points (FRED, September 16) indicates money market rates are fractionally below the Fed's interest on reserve balances, which is normal funding noise and does not signal a funding crisis.
The BOJ's retained guidance -- that underlying inflation should gradually approach the 2% target from the second half of fiscal 2026 through fiscal 2027 -- matters more than the September hike itself. If that timeline holds, additional hikes are coming, and each one compresses the EUR-JPY rate differential further. That is the slow-burning structural case for EURJPY downside. But 'gradually' and 'if the outlook is realised' are deliberately conditional language, and the miss in August core CPI at 1.7% versus 1.8% expected gives the BOJ room to pause.
## L3 - Technical Structure
At the time of this writing -- Friday, 18 September 2026, 05:53 UTC -- EURJPY is trading at 179.27 (source: mt5:EURJPY:1m). The thesis snapshot close used when this analysis was built was 180.44, so current price is already 1.17 handles below that reference point. The weekly VWAP sits at 178.9 and price is currently above it by 0.37 points, testing from above. This is not a minor distinction: price above VWAP means that the average participant who transacted this week is still in profit on longs, which reduces immediate selling pressure from that cohort and means the bearish thesis is not yet confirmed by participation-weighted price.
The weekly TrendSL -- a structural trend line used as the primary invalidation ceiling -- sits at 182.78, which is 3.51 points above current price. As long as price remains below 182.78, the trending-down structure is intact on the weekly chart. The multi-timeframe alignment is uniformly bearish across all timeframes, which means higher-timeframe sellers have structural permission to press, but near-term price is not yet cooperating by breaking cleanly below VWAP.
## L4 - Intermarket Cross-Check
The DXY cross-reference for this week shows a bearish bias as well, with the thesis snapshot price at 99.325 and current market price at 100.291 as of September 18, 05:43 UTC (source: yfinance:DX-Y.NYB:1m). DXY trading above its own thesis snapshot but carrying a bearish bias mirrors what is happening in EURJPY: price holding up short-term against a structural bearish lean. The DXY conviction is also at a stand-aside level, meaning the USD directional signal is similarly unresolved.
For EURJPY, the DXY dynamic matters through the USD/JPY channel. A weaker dollar would ordinarily support JPY crosses by reducing the appeal of dollar-funded carry, but with DXY currently above its thesis-time reference, that pressure is not yet materializing. The rate differential story -- 5.01% on the US 10Y versus 1.25% on the BOJ policy rate -- remains the dominant cross-market anchor for yen pricing, and until that gap compresses meaningfully, JPY strength will be episodic rather than sustained.
## L5 - Event Risk
The events most likely to shift this picture in the next three weeks:
-> BOJ communication: Any speech, minutes release, or board member commentary that either reinforces or softens the forward-hike guidance is the single highest-priority catalyst. The pair's reaction to the September 18 hike -- yen weakness despite a hawkish act -- shows that guidance language moves markets more than the mechanical rate decision.
-> ECB speakers and eurozone data: Any signal that the ECB is near the end of its hiking cycle would compress EUR yields and narrow the rate differential from the EUR side, adding bearish pressure on EURJPY from above.
-> Japanese inflation data: Given that August core CPI missed at 1.7% versus 1.8%, further softness in upcoming releases would reinforce the Asada/Sato dissent view and reduce market confidence in the BOJ's hike trajectory.
-> US risk sentiment: A meaningful VIX spike or a continuation of CNN Fear and Greed into extreme-fear territory could accelerate a carry-unwind move -- the sudden, sharp unwinding of JPY-funded positions that happens when risk appetite deteriorates rapidly. That is when EURJPY can fall hard and fast.
| Scenario | Probability |
|---|---|
| BOJ softens forward guidance, yen weakens, EURJPY recovers toward 181 area | Moderate |
| Risk-off shock triggers carry-unwind, EURJPY breaks below VWAP and accelerates lower | Moderate |
| Sideways consolidation as conflicting signals cancel out, no resolution this week | Higher near-term |
| BOJ delivers additional hawkish surprise in communications, yen strengthens sharply | Lower |
## L6 - Conviction Scorecard
The bearish structural bias is present but the evidence is not yet convincing enough to size a position -- this is a deliberate decision to stand aside, not a low-confidence score to be pushed through with reduced size. The reason is real: the directional lean is being driven by the macro and structural overlay (BOJ carry-unwind risk, all-timeframe bearish alignment) while the technical price signal is pointing in the opposite direction. When the two primary analytical pillars disagree, forcing a directional entry means choosing one to trust over the other without confirmation -- and that is a bet on the framework's hierarchy, not on market evidence. The retail crowd at 62% net long provides a contrarian lean, but that alone does not resolve the conflict. Traders should treat this as a waiting environment, not a trading environment.
## L7 - Time Horizon
**Near-term (this week):** The post-BOJ reaction has EURJPY above weekly VWAP at 178.9, with price at 179.27 as of Friday morning. The yen failed to rally on the rate hike, which means short-term momentum favors the upside of the current range. Bears need to see price reject current levels and close the week back at or below VWAP before the near-term picture shifts.
**3-week window (the stated timeline):** This is where the structural case builds. If the BOJ retains its forward-guidance language and subsequent Japanese inflation data supports continued hiking expectations, the rate differential compression thesis gains traction. The crowded retail long position (62%) becomes a potential accelerant on the downside if sentiment shifts -- longs forced to exit can amplify a move lower. The ECB's own trajectory and eurozone economic data will determine how wide the EUR-JPY rate differential stays.
**Medium-term (beyond 3 weeks):** The BOJ's own framing -- inflation approaching target 'from the second half of fiscal 2026 through fiscal 2027' -- sets the structural timeline for ongoing yen appreciation pressure. If realized, each subsequent hike compresses the carry advantage further. However, the ECB hiking simultaneously means this is not a one-sided equation, and the medium-term path depends heavily on the relative velocity of both central banks.
## L8 - Invalidation Conditions
-> ** ** Price at 179.27 is already above weekly VWAP at 178.9. Short-term momentum is already running against the bearish thesis. This is not a future contingency -- it is the state of the market right now. Traders not yet positioned should factor this into their timing; those already holding short exposure should reassess their own risk tolerance against this condition before the weekly close.
-> ** ** A weekly close above the TrendSL at 182.78 would be the structural invalidation of the bearish setup. That level is 3.51 points above current price and has not been reached. If and when a weekly candle closes above 182.78, the bearish structure loses its foundation and shorts would need to be exited and the entire thesis reassessed from the beginning.
---
*This analysis is for informational and educational purposes only and does not constitute financial advice.*
#EURJPY #ForexTrading #BOJ #BankOfJapan #YenTrading #CarryTrade #CarryUnwind #JPY #EUR #ForexAnalysis #FXMarkets #WeeklyOutlook #MacroFX #CentralBanks #RateDifferential
Potential bullish bounce?EUR/JPY is falling towards the pivot and could bounce towards the 1st resistance.
Pivot: 179/46
1st Support: 177.84
1st Resistance: 181.97
Disclaimer:
The opinions given above constitute general market commentary and do not constitute the opinion or advice of IC Markets or any form of personal or investment advice.
Any opinions, news, research, analyses, prices, other information, or links to third-party sites contained on this website are provided on an "as-is" basis, are intended to be informative only, and are not advice, a recommendation, research, a record of our trading prices, an offer of, or solicitation for, a transaction in any financial instrument and thus should not be treated as such. The information provided does not involve any specific investment objectives, financial situation, or needs of any specific person who may receive it. Please be aware that past performance is not a reliable indicator of future performance and/or results. Past performance or forward-looking scenarios based upon the reasonable beliefs of the third-party provider are not a guarantee of future performance. Actual results may differ materially from those anticipated in forward-looking or past performance statements. IC Markets makes no representation or warranty and assumes no liability as to the accuracy or completeness of the information provided, nor any loss arising from any investment based on a recommendation, forecast, or any information supplied by any third party.

Could we see a reversal from here?Loonie (USD/CAD) is rising towards the pivot, which acts as a pullback resistance, and could reverse towards the 1st support, which is a pullback support.
Pivot: 1.4004
1st Resistance: 1.4081
1st Support: 1.3936
Disclaimer:
The opinions given above constitute general market commentary and do not constitute the opinion or advice of IC Markets or any form of personal or investment advice.
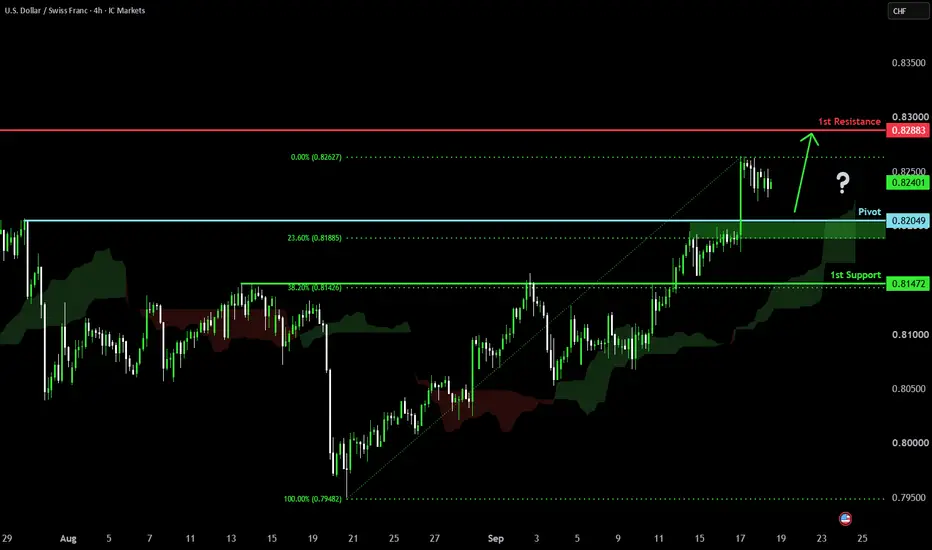
Any opinions, news, research, analyses, prices, other information, or links to third-party sites contained on this website are provided on an "as-is" basis, are intended to be informative only, and are not advice, a recommendation, research, a record of our trading prices, an offer of, or solicitation for, a transaction in any financial instrument and thus should not be treated as such. The information provided does not involve any specific investment objectives, financial situation, or needs of any specific person who may receive it. Please be aware that past performance is not a reliable indicator of future performance and/or results. Past performance or forward-looking scenarios based upon the reasonable beliefs of the third-party provider are not a guarantee of future performance. Actual results may differ materially from those anticipated in forward-looking or past performance statements. IC Markets makes no representation or warranty and assumes no liability as to the accuracy or completeness of the information provided, nor any loss arising from any investment based on a recommendation, forecast, or any information supplied by any third party. Bullish continuation for the Swissie?The price is falling towards the pivot, which is a pullback support that is slightly above the 23.6% Fibonacci retracement and could bounce towards the pullback resistance.
Pivot: 0.8204
1st Support: 0.8147
1st Resistance: 0.8288
Disclaimer:
The opinions given above constitute general market commentary and do not constitute the opinion or advice of IC Markets or any form of personal or investment advice.
Any opinions, news, research, analyses, prices, other information, or links to third-party sites contained on this website are provided on an "as-is" basis, are intended to be informative only, and are not advice, a recommendation, research, a record of our trading prices, an offer of, or solicitation for, a transaction in any financial instrument and thus should not be treated as such. The information provided does not involve any specific investment objectives, financial situation, or needs of any specific person who may receive it. Please be aware that past performance is not a reliable indicator of future performance and/or results. Past performance or forward-looking scenarios based upon the reasonable beliefs of the third-party provider are not a guarantee of future performance. Actual results may differ materially from those anticipated in forward-looking or past performance statements. IC Markets makes no representation or warranty and assumes no liability as to the accuracy or completeness of the information provided, nor any loss arising from any investment based on a recommendation, forecast, or any information supplied by any third party. Bearish reversal setup?Aussie (AUD/USD) is reacting off the pivot, which is an overlap resistance that is slightly below the 38.2% Fibonacci retracement and could reverse towards the 1st support, which is a pullback support that is slightly below the 50% Fibonacci retracement.
Pivot: 0.7129
1st Support: 0.7068
1st Resistance: 0.7190
Disclaimer:
The opinions given above constitute general market commentary and do not constitute the opinion or advice of IC Markets or any form of personal or investment advice.
Any opinions, news, research, analyses, prices, other information, or links to third-party sites contained on this website are provided on an "as-is" basis, are intended to be informative only, and are not advice, a recommendation, research, a record of our trading prices, an offer of, or solicitation for, a transaction in any financial instrument and thus should not be treated as such. The information provided does not involve any specific investment objectives, financial situation, or needs of any specific person who may receive it. Please be aware that past performance is not a reliable indicator of future performance and/or results. Past performance or forward-looking scenarios based upon the reasonable beliefs of the third-party provider are not a guarantee of future performance. Actual results may differ materially from those anticipated in forward-looking or past performance statements. IC Markets makes no representation or warranty and assumes no liability as to the accuracy or completeness of the information provided, nor any loss arising from any investment based on a recommendation, forecast, or any information supplied by any third party. gbpusd: the bullish comeback — from demand to new highsGBPUSD 4H — Bullish SMC Analysis 🎯
Current Price: ~1.33708
Timeframe: 4H
Market Bias: Potential bullish recovery from the current demand area, subject to confirmation.
🟢 1. Market Structure
GBPUSD has experienced a significant bearish move from the 1.3650–1.3670 region toward the 1.3330 area.
The chart shows previous bullish and bearish swings, with price currently attempting to recover from the lower support region. A confirmed bullish Break of Structure (BOS) would provide stronger evidence of a potential trend shift.
🟢 2. Key Demand & Support Zone
Support Area: 1.3330–1.3350
This region is near the recent low and the marked gray support zone.
Price has reacted upward from this area.
Buyers may attempt to defend the zone.
A sustained break below support would weaken the bullish setup.
Important: Support holding alone does not confirm a bullish reversal.
📈 3. Bullish Trade Projection
The chart displays a bullish projection with an entry around 1.3370 and a stop-loss region near 1.3295.
The projected upside levels are:
Target
Price
TP1
1.3450
TP2
1.3568
TP3
1.3673
These are the levels shown or approximated from the chart's projected targets, not guaranteed outcomes.
🎯 4. Potential Resistance Levels
Resistance 1: 1.3450–1.3470
An initial reaction area where price may encounter selling pressure.
Resistance 2: 1.3560–1.3580
A significant intermediate level near the chart's projected second target.
Major Resistance: 1.3650–1.3675
This region aligns with the previous swing-high area and the upper projected target. It may act as a major supply or resistance zone.
🧠 5. SMC Analysis — BOS, CHoCH & FVG
BOS (Break of Structure): The chart contains prior structural swings, but a fresh bullish BOS is not clearly confirmed in the current price area.
CHoCH (Change of Character): A bullish CHoCH would require a meaningful break of a relevant lower-timeframe swing high, followed by supporting price action.
FVG (Fair Value Gap): The chart does not clearly label all FVG boundaries. Exact FVG identification requires examining the individual candle formations, so specific zones should be verified before using them for entries.
📊 6. Supertrend Confirmation
The displayed Supertrend is approximately 1.34389, above the current price near 1.33708.
This indicates that the current Supertrend reading has not yet confirmed a bullish trend. Reclaiming the indicator and establishing higher highs could strengthen the bullish recovery case.
🚀 7. Bullish Scenario
Support Holds → Bullish CHoCH → BOS Confirmation → Upside Continuation
If price defends the 1.3330–1.3350 region and breaks above nearby swing resistance, the projected upside path could be:
1.3450 → 1.3568 → 1.3673
Each level should be monitored for rejection, consolidation, or confirmed breakout.
🔴 8. Bearish Invalidation
A sustained breakdown below the 1.3330–1.3350 support region would weaken the bullish setup.
The marked stop-loss region is near 1.3295, but the appropriate invalidation level depends on your trade plan and risk tolerance.
📌 Final GBPUSD Outlook
GBPUSD is attempting a recovery after a strong decline. The key area to monitor is 1.3330–1.3350, while the displayed bullish projection targets 1.3450, 1.3568, and 1.3673.
🟢 Support: 1.3330–1.3350
🎯 TP1: 1.3450
🎯 TP2: 1.3568
🎯 TP3: 1.3673
🔴 Major Resistance: 1.3650–1.3675
📊 Supertrend: ~1.34389 GBPUSD – Sellers Are Still Setting the PaceGBPUSD is sending a fairly clear message: the recovery attempts are still not strong enough to change the broader direction . Price is trading around 1.3370 after a sharp decline, while pressure from the U.S. dollar and the 12H structure keeps my short-term view tilted to the downside.
From a macro perspective, the U.S. dollar still holds the advantage after the Fed maintained a hawkish policy stance . In the UK, the Bank of England also remains cautious about persistent inflation risks , but that has not yet generated enough demand to produce a meaningful recovery in sterling. GBP may still see temporary rebounds, but there is currently no clear catalyst strong enough to reverse the pressure on GBPUSD.
On the 12H chart, the bearish structure remains well defined, with a sequence of lower highs developing beneath the descending trendline. Following the latest selloff, price is attempting a modest recovery toward 1.3400, but it remains below the trendline and Ichimoku structure. If buyers fail to regain control here, the 1.3245–1.3290 area becomes the next zone to watch.
My preferred scenario is that the current recovery gives sellers another opportunity to step back in rather than marking the beginning of a new bullish trend. As long as GBPUSD remains capped beneath the resistance structure above, bearish continuation remains my primary scenario , with the 1.3250 area as the next key downside target.

 Long
Long