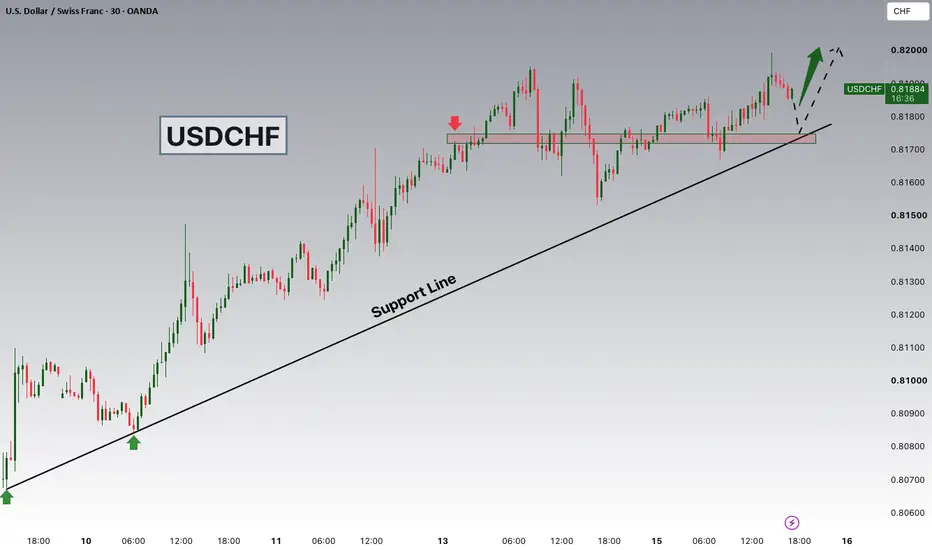
EUR/CHFEffective immediately, the 2026 budget is available in electronic format on the website of the Federal Finance Administration (FFA). The hard copy will be released in mid-September.
Following the Federal Council's announcement of the figures for the 2026 budget on June 25, 2025, the detailed budget is now available. During its meeting on August 20, 2025, the Federal Council adopted the dispatch on the 2026 budget with the integrated task and financial plan (ITFP) for 2027 to 2029. It contains all of the federal receipts and expenditure envisaged for 2026, as well as the outlook for the three subsequent years of the plan.
A financing deficit of CHF 845 million is budgeted for 2026. The Confederation will have to take on new debt in this amount. The financing deficit in the ordinary budget is CHF 609 million, which means that the cyclical deficit permitted by the debt brake (-717 mn) is not fully utilized.
www.admin.ch
www.efv.admin.ch
Forex market
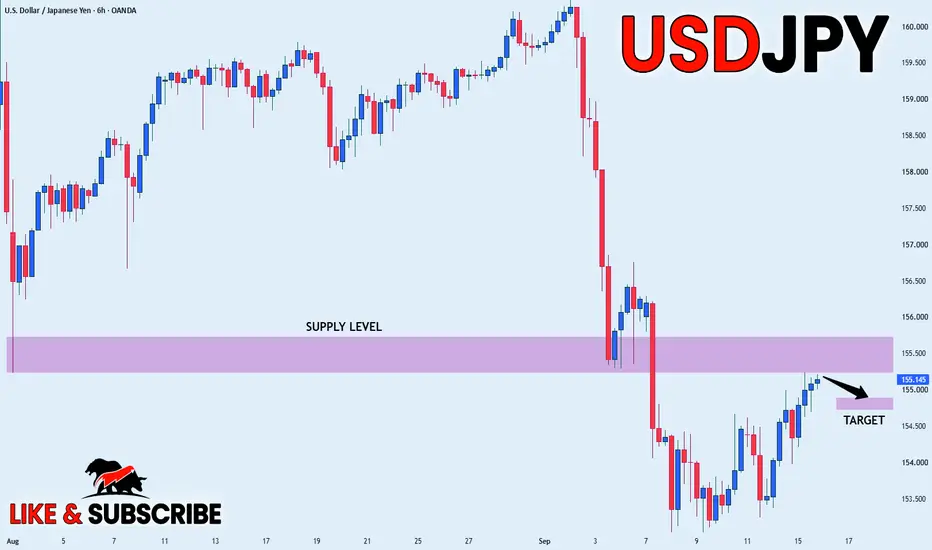
USDJPY 30Min Engaged ( Bullish Reversal Detected )HANZO MARKET LIQUIDITY REPORT
USDJPY
Timeframe: 30min (Volume Basis)
Scale: Higher Timeframe Context / Deep Volume analysis
━━━━━━━━━━━━━━━━━━━━━━
Market Observation
This analysis is focusing on structural behavior, liquidity zones, Volume analysis
and key areas of interest within the current range.
━━━━━━━━━━━━━━━━━━━━━━
Market Bias
Full liquidity Map
━━━━━━━━━━━━━━━━━━━━━━
🔥Bearish Reversal
Key Volume Zone : 162.250 Area
━━━━━━━━━━━━━━━━━━━━━━
Structure Factors:
• Higher timeframe Volume reaction level
• High-volume / Hidden
• Range Defend structure
• Volume Stacking
• Quarter Volume
GBPJPYGBPJPY: Long Setup Building
Not ready for entry yet. We are still awaiting confirmations.
Price is grinding higher inside a clean ascending channel, and the structure has held every pullback since late June.
The trigger: we need a settled 4H candle close above 217.816. Anything less is noise. From there we expect a liquidity retracement back into the level before the move develops.
The target: TP 1 at 219.800, with the channel guiding price gradually higher into it.
The macro backs the long. The BoE holds at 3.75% against the BoJ at 1.00%, a gap of roughly 275bps that keeps yen-funded carry trades alive and the cross bid. Two MPC members already voted for a hike in June, and easing UK political uncertainty is lending sterling further support.
EURAUD 4H | FSSM Type 3 Short Setup from Daily AOIEURAUD | 4H
The market has retraced into a higher-timeframe Area of Interest after a bearish impulse, presenting a potential Type 3 opportunity.
My current bias remains bearish, but execution depends entirely on confirmation rather than anticipation.
Technical observations:
• Daily bearish order flow remains intact.
• Price has retraced into the Daily AOI.
• 62%, 70.5% and 79% retracement levels are being monitored as potential reaction areas.
• Looking for bearish confirmation before considering continuation toward the next downside liquidity.
Trade Plan
• Bias: Bearish 📉
• Entry Model: FSSM Type 3
• Confirmation: Bearish price action within the AOI
• Invalidation: Sustained acceptance above the swing high
• Target: Next downside liquidity
No confirmation = No trade.
This analysis reflects my current market view and will be updated if market structure changes.
Plan Your Trade | Trade Your Plan
Educational market analysis only. Not financial advice.
AUDJPY - 2 ScenariosHello Traders,
AUDJPY has formed a rectangle pattern, signaling a potential breakout. Here are the two key scenarios to watch:
🟢 Bullish Scenario
If price breaks and closes above the resistance zone at 112.684 – 112.810, it would confirm a bullish breakout.
🎯 Target: 113.330
🔴 Bearish Scenario
If price breaks and closes below the support zone at 112.181 – 112.302, it would confirm a bearish breakout.
🎯 Target: 111.540
⚠️ Wait for a confirmed candle close before entering a trade, and always manage your risk accordingly.
CADCHF Will Go Lower From Resistance! Sell!
Please, check our technical outlook for CADCHF.
Time Frame: 4h
Current Trend: Bearish
Sentiment: Overbought (based on 7-period RSI)
Forecast: Bearish
The market is testing a major horizontal structure 0.576.
Taking into consideration the structure & trend analysis, I believe that the market will reach 0.571 level soon.
P.S
The term oversold refers to a condition where an asset has traded lower in price and has the potential for a price bounce.
Overbought refers to market scenarios where the instrument is traded considerably higher than its fair value. Overvaluation is caused by market sentiments when there is positive news.
Like and subscribe and comment my ideas if you enjoy them!
The Day Ahead The spotlight remains on inflation and central banks, with US June PPI providing the next key read on pipeline price pressures following Tuesday's CPI report. Markets will also hear from Fed Chair Kevin Warsh, who continues his Humphrey–Hawkins testimony before the Senate Banking Committee, while the Fed's Beige Book offers an updated assessment of economic conditions ahead of the July FOMC meeting. Additional Fed speakers, including Cook, Williams and Musalem, could also influence expectations for the path of interest rates.
Overnight, attention will be on China's Q2 GDP and the accompanying monthly activity data covering retail sales, industrial production, fixed asset investment and home prices, which should provide the clearest picture yet of the strength of China's economic recovery. In Europe, Eurozone industrial production will offer another gauge of manufacturing momentum.
The Bank of Canada is also expected to announce its latest policy decision, with investors watching for any changes to the outlook on inflation and growth.
Corporate earnings continue to gather pace, with technology in focus as ASML reports, providing an important update on global semiconductor demand and AI-related investment. In the US, results from Johnson & Johnson, Morgan Stanley, BlackRock, Progressive and Bank of New York Mellon will offer further insight into the health of the financial sector, investment activity and broader corporate earnings trends.
The information provided does not constitute investment advice nor take into account the individual financial circumstances or objectives of any investor. Any information that may be provided relating to past performance is not a reliable indicator of future results or performance. To the extent permitted by law, in no event shall Trade Nation (or any affiliate or employee) have any liability for any loss arising from the use of the information provided. Any person acting on the information does so entirely at their own risk. Any information which could be construed as “investment research” has not been prepared in accordance with legal requirements designed to promote the independence of investment research and as such is considered to be a marketing communication.
Financial Spread Bets and CFDs are complex instruments and come with a high risk of losing money rapidly due to leverage. 73.7% of retail investor accounts lose money when trading CFDs with this provider. You should consider whether you understand how CFDs work and whether you can afford to take the high risk of losing your money.
EURUSD Bearish Rejection at Resistance | 1H Analysis
EURUSD is showing signs of weakness after rejecting the highlighted resistance zone. Price failed to sustain bullish momentum and is now trading below resistance, increasing the probability of a move toward the next support levels.
As long as price remains below the marked supply area, the bearish outlook stays valid.
Key Levels:
* 🔴 Resistance: 1.1440 – 1.1455
* 🟦 1st Support: 1.1385
* 🟦 2nd Support: 1.1330
* 📉 Bias: Bearish below resistance.
NZDCAD Will Go Down From Resistance! Short!
Here is our detailed technical review for NZDCAD.
Time Frame: 1h
Current Trend: Bearish
Sentiment: Overbought (based on 7-period RSI)
Forecast: Bearish
The market is approaching a key horizontal level 0.817.
Considering the today's price action, probabilities will be high to see a movement to 0.815.
P.S
We determine oversold/overbought condition with RSI indicator.
When it drops below 30 - the market is considered to be oversold.
When it bounces above 70 - the market is considered to be overbought.
Like and subscribe and comment my ideas if you enjoy them!
GBPJPY CRASH IMMINENT: Major Trendline Breakdown Confirmed!GBPJPY CRASH IMMINENT: Major Trendline Breakdown Confirmed! 📉
Description:
GBPJPY has confirmed a significant bearish market structure shift on the 2h timeframe. After approaching the "Resistance" zone, price encountered strong institutional selling pressure and failed to sustain bullish momentum. Following this rejection, price has aggressively forced a clean breakdown below the long-standing dynamic ascending trendline support. This structural displacement confirms that the immediate institutional order flow has shifted from buy-side accumulation to sell-side dominance. We anticipate a continued bearish expansion to clear internal liquidity and reach the projected downside targets.
Key Structural Levels:
🔴 Major Resistance / Invalidation Zone: 217.800 – 218.200 (Body close back above the broken trendline)
📈 Current Reaction Level: 217.397
🔵 1st Bearish Objective: 215.917 (1ST SUPPORT)
🔵 2nd Bearish Objective: 213.920 (2nd support)
Trading Perspective:
Look for high-probability short execution setups on lower timeframes (M15/M5) inside local supply zones or on any minor corrective pullback to test the broken trendline area as resistance. A clean 2h candle body close back above the broken trendline zone will fully invalidate this bearish setup.
This analysis is based on technical structure and market behavior, not financial advice.
EURCHF: Bullish Continuation 🇪🇺🇨🇭
EURCHF formed a double bottom pattern after a retest of the recently
horizontal broken structure.
I took a long trade this morning, and I expect a bullish continuation to 0.9266
❤️Please, support my work with like, thank you!❤️
I am part of Trade Nation's Influencer program and receive a monthly fee for using their TradingView charts in my analysis.
CHF/JPY SENDS CLEAR BEARISH SIGNALS|SHORT
CHF/JPY SIGNAL
Trade Direction: short
Entry Level: 200.410
Target Level: 199.625
Stop Loss: 200.933
RISK PROFILE
Risk level: medium
Suggested risk: 1%
Timeframe: 1h
Disclosure: I am part of Trade Nation's Influencer program and receive a monthly fee for using their TradingView charts in my analysis.
✅LIKE AND COMMENT MY IDEAS✅
Will the Polish Zloty Unseat the Euro's Eastern Moat?The Illusion of Euro Dominance
The EUR/PLN exchange rate sits at a fascinating crossroads in July 2026. Recent trading pushed the pair toward the 4.33 level. A dovish shift from the National Bank of Poland (NBP) triggered this temporary weakness. However, underlying economic fundamentals paint a vastly different picture.
The Eurozone faces structural stagnation. Germany expects a meager 0.6% GDP growth this year. France grapples with rising debt and 0.8% growth.
In contrast, Poland boasts a robust 3.5% growth forecast. Massive inflows of European Union funds will soon flood the Polish economy. This fiscal divergence positions the Polish Zloty for a major long-term rally against the Euro.
Macroeconomics and Monetary Divergence
The interest rate differential between the NBP and the ECB continues to support the Zloty. The NBP maintains its benchmark rate at 3.75%. Meanwhile, the European Central Bank (ECB) struggles to balance inflation against high debt.
Poland’s central bank holds substantial ammunition to combat currency depreciation. Analysts at major banks predict the EUR/PLN rate will descend back toward 4.25.
Record-breaking structural conversions will drive this appreciation. Poland will receive €43 billion in EU recovery funds throughout 2026. Converting these massive euro reserves into zlotys creates relentless upward pressure on the currency.
Metric (2026 Forecast) Poland Eurozone Core
GDP Growth 3.5%,0.9%
Central Bank Rate 3.75% 2.25%
FDI Sentiment 94.5% Positive Sluggish / Declining
Geopolitics and the Rise of Military Keynesianism
Poland is rapidly transforming into Europe's front-line defense fortress. Geostrategic realities force Warsaw to prioritize national defense. The nation remains the prime beneficiary of the Security Action for Europe (SAFE) instrument.
Poland secured €43.7 billion in defense loans to modernize its forces. The program represents a form of military Keynesianism. Nearly 90% of these funds flow directly into domestic defense manufacturers.
This capital injection stimulates industrial production. It attracts secondary investments without adding immediate fiscal pressure on the state. Consequently, geopolitics bolsters the Zloty's long-term sovereign value.
The Strategic Shift: Poland is leveraging massive EU inflows and military investments to transition from a cheap industrial hub into a high-tech powerhouse.
High-Tech, Patents, and Innovation
Military modernization demands advanced physical technology. Polish private defense contractors, like WB Group, lead this charge. Patent analysis shows a massive spike in Polish aerospace and communications filings.
Engineers actively patent novel drone guidance systems and secure tactical networks. These technological innovations attract substantial foreign venture capital.
Furthermore, this high-tech boom trickles down into civilian sectors. Startups leverage military research to develop commercial automation tools. This scientific progress ensures that Poland remains a high-value industrial hub, not just a cheap assembly line.
Cybersecurity and Financial Integrity
Securing these vital technological networks is paramount. Poland faces constant cyber threats from eastern state-sponsored actors. The nation has deployed state-of-the-art cybersecurity command centers to protect its infrastructure.
These centers safeguard sensitive transaction databases and critical supply chains. Financial institutions in Warsaw utilize advanced cryptography to defend regional capital markets.
This security framework guarantees flawless transaction integrity. Investors value this cyber resilience. It reassures global markets that Polish financial assets remain exceptionally safe.
The Biotech and Pharmaceutical Connection
Poland's high-tech evolution extends to the pharmaceutical industry. The domestic biotechnology sector relies heavily on secure cross-border payment networks.
Biotech firms use the strong Zloty to import critical chemical precursors. Fast, secure transactions streamline clinical trials and drug manufacturing.
This currency strength directly lowers the procurement costs of essential medicinal ingredients. Polish scientific research institutes utilize secure financial rails to purchase high-end laboratory equipment. Therefore, EUR/PLN dynamics play a key role in regional healthcare logistics.
Industry Trends and Agile Business Models
Global corporations are rewriting their supply chain strategies. Companies are near-shoring production to stable European nations. Poland’s highly skilled workforce and strategic geography make it an ideal target.
Industry trends show massive foreign direct investment flowing into Poland. An impressive 94.5% of foreign firms state they would invest in Poland again.
Agile corporate business models leverage Poland's cost advantages to maximize global efficiency. The country's strong service sector surplus offsets goods deficits. This consistent investment inflow generates persistent, non-speculative demand for the Zloty.
Management, Leadership, and Company Culture
Polish technology companies cultivate an agile, flat company culture. This structural design enables rapid innovation and iteration.
Corporate leadership prioritizes technical execution over bureaucratic hierarchy. Executives quickly adapt to changing market conditions. This dynamic management style attracts elite global talent to Warsaw.
A high-performance work culture drives productivity across the nation. This productivity leap supports higher wages. Higher productivity ultimately builds a foundation of real value for the domestic currency.
Strategic Conclusion
The Zloty's temporary decline against the Euro represents a buying opportunity. The Euro struggles under the weight of German industrial decline. Conversely, Poland’s economy is soaring.
Massive EU fund conversions, defense spending, and technological leadership support the Zloty. The EUR/PLN exchange rate reflects a changing European order. The Polish Zloty is emerging as the premier anchor of stability in Central Europe.
AUDUSD Analysis | Breakout Retest Holds – Bulls Target Higher AUDUSD has confirmed a bullish breakout above its previous consolidation range and is now holding above a key demand zone. The recent price action suggests buyers remain in control, with the breakout retest providing a strong foundation for another move higher.
As long as price stays above the highlighted support, the bullish trend remains favored.
---
🔍 Technical Analysis
After weeks of bearish pressure, AUDUSD established a higher low and successfully broke above the 0.6960–0.6970 resistance zone. Price is now consolidating above this level, indicating that previous resistance has flipped into support.
The highlighted demand zone is likely to attract fresh buying interest if a minor pullback occurs. A bullish reaction from this area would reinforce the continuation pattern and increase the probability of another impulsive move higher.
The next major resistance is located around 0.7043, which aligns with the previous swing high.
---
📊 Trade Idea
🟢 Buy Zone
0.6960–0.6970 after bullish confirmation.
🎯 Target 1
0.7000
🎯 Target 2
0.7020
🎯 Target 3
0.7043
🛑 Stop Loss
Below the highlighted demand zone.
---
✅ Why I'm Bullish
Breakout above previous resistance confirmed.
Successful retest of the breakout zone.
Higher highs and higher lows indicate bullish market structure.
Demand zone continues to attract buyers.
Strong risk-to-reward for trend continuation.
---
📈 Market Outlook
The recent breakout suggests momentum is shifting in favor of the bulls. If buyers continue defending the highlighted demand zone, AUDUSD could extend its rally toward 0.7043, where the next major resistance awaits.
A decisive close above 0.7043 would further strengthen the bullish outlook and could signal the start of a larger upward trend.
---
⚠️ Invalidation
A sustained close below the highlighted demand zone would invalidate the bullish setup and increase the probability of a deeper pullback.
Wait for confirmation before entering any position, and always follow proper risk management.
Do you think AUDUSD will continue its breakout toward 0.7043, or will sellers force a deeper retracement first? Share your analysis below!
#AUDUSD #Forex #TradingView #TechnicalAnalysis #PriceAction #SmartMoney #SupportAndResistance #ForexTrading #SwingTrading #RiskManagement #Bullish #MarketAnalysis
Framing Trades Using ICT Fractal ConceptsHere is my analysis on EURUSD, as well as a trade that I go through live. However, the limit to the video length is only 20 minutes, so you will have to check yourself if the target hit, as well as my overall bias. I'll leave a comment if it does.
- 2F Trading
AUDUSD: One More Push Higher Before the Real Move DownBearish on the Aussie this week - but the path lower probably doesn't go straight there.
The weekly candle opened flat right at the top of the range.
In ICT terms that's often a signal the market intends to sweep liquidity first before the real move - in plain terms, price tends to push up just enough to trap late buyers before reversing hard.
The zone worth watching is the weekly fair value gap and breaker sitting between 0.6969 and 0.6979.
That's where the manipulation likely exhausts - a previous weekly high sitting right in the middle of an unfilled weekly gap, with a breaker acting as resistance above.
Three layers of confluence at the same level.
The timing lines up too. Red folder events on DXY Tuesday and Wednesday could easily be the catalyst that drives that push higher - dollar weakness spiking AUD into the zone - before the real trend reasserts itself lower toward external range liquidity at 0.6865.
Invalidation: A clean daily close above 0.6985 - above the full FVG zone means buyers are genuinely in control and this read is off the table.
Timeframe: Watching this play out across the week, targeting 0.6865 by the weekly close.
Are you watching AUDUSD for a sweep and reverse this week, or do you think the bullish momentum continues? Drop your bias below.
Idea-sharing only, not financial advice.
USDCAD Supply Zone 45MInSupply Zone identified at 1.41100–1.41170. Price remains below the 20 EMA & 50 EMA, maintaining bearish structure. Looking for bearish confirmation inside the zone for continuation toward 1.40750 and lower. Risk management is essential. #USDCAD #Forex #SupplyZone #PriceAction #TradingView
EURAUD – H4 Long Setup From SupportSupport
🔍 Market Overview
EURAUD is currently testing an important support area on the 4-hour timeframe after a sharp pullback from the recent highs.
The broader structure still suggests that this move may be a correction rather than a full bearish reversal. For now, we are watching the current zone around 1.6351 as a possible base for a bullish recovery.
📈 Bullish Scenario
As long as price holds above the 1.6255 support area, we may see buyers step back in and push the pair higher.
Our upside objective is:
Main target: 1.6464
This would represent a recovery toward the next resistance area after the recent sell-off.
📉 Alternative Scenario
If price breaks and closes below 1.6255, the long setup would be invalidated.
In that case, the bullish idea would lose strength and we would prefer to wait for a new structure before looking for another long opportunity.
🎯 Key Levels
Entry area: around 1.6351
Invalidation: below 1.6255
Target: 1.6464
💡 Trading Perspective
We are treating this as a recovery setup from support, not a guaranteed reversal. The recent decline has been aggressive, so confirmation and risk management remain important.
If buyers manage to defend the current area, EURAUD may attempt a move back toward the 1.6464 zone. Until then, we remain focused on price holding above support.