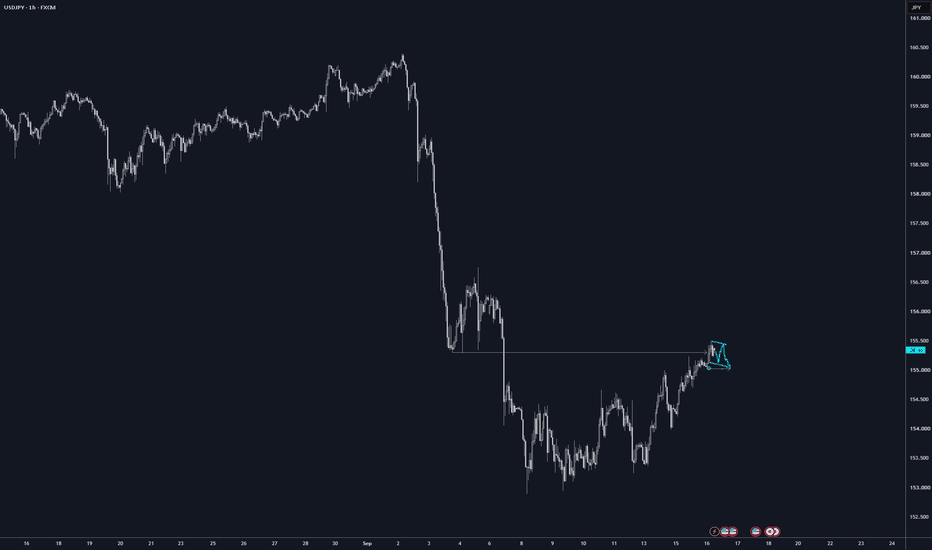
Bullish pressure builds?Ninja (USD/JPY) is falling towards the pivot, which acts as a pullback support and could bounce towards the 1st resistance.
Pivot: 154.51
1st Support: 153.31
1st Resistance: 156.24
Disclaimer:
The opinions given above constitute general market commentary and do not constitute the opinion or advice of IC Markets or any form of personal or investment advice.
Any opinions, news, research, analyses, prices, other information, or links to third-party sites contained on this website are provided on an "as-is" basis, are intended to be informative only, and are not advice, a recommendation, research, a record of our trading prices, an offer of, or solicitation for, a transaction in any financial instrument and thus should not be treated as such. The information provided does not involve any specific investment objectives, financial situation, or needs of any specific person who may receive it. Please be aware that past performance is not a reliable indicator of future performance and/or results. Past performance or forward-looking scenarios based upon the reasonable beliefs of the third-party provider are not a guarantee of future performance. Actual results may differ materially from those anticipated in forward-looking or past performance statements. IC Markets makes no representation or warranty and assumes no liability as to the accuracy or completeness of the information provided, nor any loss arising from any investment based on a recommendation, forecast, or any information supplied by any third party. Bullish continuation ahead?Swissie (USD/CHF) could fall towards the pivot, which is a pullback support, and could bounce towards the pullback resistance.
Pivot: 0.8141
1st Support: 0.8101
1st Resistance: 0.8203
Disclaimer:
The opinions given above constitute general market commentary and do not constitute the opinion or advice of IC Markets or any form of personal or investment advice.
Any opinions, news, research, analyses, prices, other information, or links to third-party sites contained on this website are provided on an "as-is" basis, are intended to be informative only, and are not advice, a recommendation, research, a record of our trading prices, an offer of, or solicitation for, a transaction in any financial instrument and thus should not be treated as such. The information provided does not involve any specific investment objectives, financial situation, or needs of any specific person who may receive it. Please be aware that past performance is not a reliable indicator of future performance and/or results. Past performance or forward-looking scenarios based upon the reasonable beliefs of the third-party provider are not a guarantee of future performance. Actual results may differ materially from those anticipated in forward-looking or past performance statements. IC Markets makes no representation or warranty and assumes no liability as to the accuracy or completeness of the information provided, nor any loss arising from any investment based on a recommendation, forecast, or any information supplied by any third party. Price approaching strong support?Cable (GBP/USD) is falling towards the pivot, which is an overlapping support that aligns with the 61.8% Fibonacci retracement and is also near the 61.8% Fibonacci projection and could bounce towards the 1st resistance.
Pivot: 1.3430
1st Support: 1.3353
1st Resistance: 1.3528
Disclaimer:
The opinions given above constitute general market commentary and do not constitute the opinion or advice of IC Markets or any form of personal or investment advice.
Any opinions, news, research, analyses, prices, other information, or links to third-party sites contained on this website are provided on an "as-is" basis, are intended to be informative only, and are not advice, a recommendation, research, a record of our trading prices, an offer of, or solicitation for, a transaction in any financial instrument and thus should not be treated as such. The information provided does not involve any specific investment objectives, financial situation, or needs of any specific person who may receive it. Please be aware that past performance is not a reliable indicator of future performance and/or results. Past performance or forward-looking scenarios based upon the reasonable beliefs of the third-party provider are not a guarantee of future performance. Actual results may differ materially from those anticipated in forward-looking or past performance statements. IC Markets makes no representation or warranty and assumes no liability as to the accuracy or completeness of the information provided, nor any loss arising from any investment based on a recommendation, forecast, or any information supplied by any third party. Fundamental Market Analysis for September 16, 2026 GBPUSDThe pound approaches the session with weakened internal support following fresh UK labor market data. Wage growth excluding bonuses slowed to 3.5%, job vacancies fell to 702 thousand, and employment on payrolls decreased in August. This backdrop reduces pressure on the Bank of England from wages and limits arguments for accelerated policy tightening.
Today, the market awaits UK inflation data for August, and on Thursday, the Bank of England's decision. Consensus expects headline inflation to accelerate to 3.1%, but the regulator is widely expected to keep rates unchanged. Expensive oil creates a double risk: it intensifies price pressures, but for an energy importer, it increases costs for businesses and households, dampening economic activity.
On the external side, the dollar retains its advantage ahead of the Fed's decision amid high US bond yields and a rate hike that is almost fully priced in. Stronger UK inflation could support the pound, but a weak labor market reduces the likelihood that the local factor will consistently outweigh the dollar's momentum. Under current conditions, the priority remains a decline in GBP/USD.
Trading idea: SELL 1.34800, SL 1.35150, TP 1.34000 Bearish momentum building?Fiber (EUR/USD) is rising towards the pivot, which is pullback resistance and could reverse towards the 1st support, which is pullback support that aligns with the 61.8% Fibonacci retracement.
Pivot: 1.1569
1st Support: 1.1482
1st Resistance: 1.1642
Disclaimer:
The opinions given above constitute general market commentary and do not constitute the opinion or advice of IC Markets or any form of personal or investment advice.
Any opinions, news, research, analyses, prices, other information, or links to third-party sites contained on this website are provided on an "as-is" basis, are intended to be informative only, and are not advice, a recommendation, research, a record of our trading prices, an offer of, or solicitation for, a transaction in any financial instrument and thus should not be treated as such. The information provided does not involve any specific investment objectives, financial situation, or needs of any specific person who may receive it. Please be aware that past performance is not a reliable indicator of future performance and/or results. Past performance or forward-looking scenarios based upon the reasonable beliefs of the third-party provider are not a guarantee of future performance. Actual results may differ materially from those anticipated in forward-looking or past performance statements. IC Markets makes no representation or warranty and assumes no liability as to the accuracy or completeness of the information provided, nor any loss arising from any investment based on a recommendation, forecast, or any information supplied by any third party.
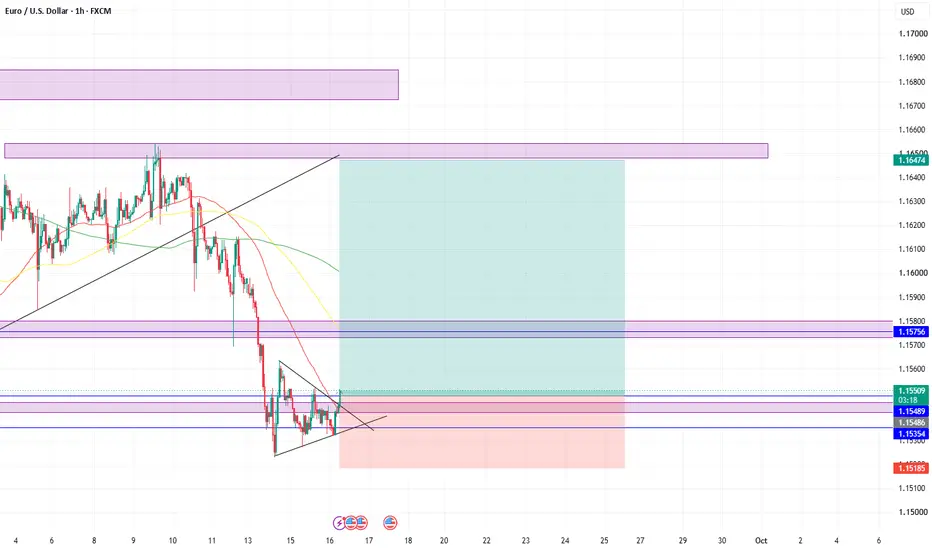
EUR/USD Maintains Bearish BiasEUR/USD OANDA:XAUUSD maintained a negative bias for five consecutive sessions and consolidated in the 1.1530–1.1535 range throughout the Asian trading session on Wednesday, September 16, 2026.
-----------------------------------------------------------------------------------------------------------------
✅ US Monetary & Bond Markets: Fed Rate Hike Expectations (+25 bps) & Record US 10-Year Yields (April 2007)
Bond market dynamics and US monetary policy expectations are cementing the Greenback's advantage:
- ⚡Fed Interest Rate Announcement Tonight (+25 bps): The Federal Open Market Committee (FOMC) concludes its two-day policy meeting tonight (early Thursday morning WIB). The market has fully priced in the probability of the Fed raising the benchmark interest rate by 25 basis points (bps).
- ⚡US 10-Year Yield Surge to April 2007 Highs: A surge in public and corporate borrowing, combined with the threat of exogenous inflation driven by soaring crude oil prices (hitting new peaks since May 20), has propelled the benchmark US 10-year government bond yield to its highest level since April 2007.
- ⚡Hawkish ECB Stance Limits Downside: The Euro's downside is being slightly cushioned by prospects of further European Central Bank (ECB) tightening following last week's +25 bps rate hike; this has prevented the Euro from plummeting uncontrollably ahead of the Fed's decision.
-----------------------------------------------------------------------------------------------------------------
✅ Price Action Analysis (H4 Timeframe)
The H4 structure confirms a continuation of the bearish structure/retest phase.
After facing sharp rejection (bearish rejection) from the "Lower High" peak at the 1.16541 green line, EUR/USD slid downward, breaking through several minor support levels before establishing a temporary bottom near the 1.15229 green line. At the 1.15442 price level, the most recent H4 candle shows minor buying rejection (long lower wick), attempting to bounce the price off the 1.15229 floor.
This current green candle is part of a relief rally phase (a temporary upward correction) aimed at testing the SBR area within the 1.15600–1.15700 range.
-----------------------------------------------------------------------------------------------------------------
✅ Key Zones:
- ⚡Resistance / Supply Zone (SBR): The 1.15600–1.15800 range (middle gray box / nearest SBR & HVN area) and the green lines from 1.16158 to 1.16541 (upper gray box / Major Supply Zone).
- ⚡Support / Demand Zone: The green line at 1.15229 (nearest local support floor where a liquidity sweep occurred) and the green line at 1.15000 (psychological Major Demand Zone stronghold).
-----------------------------------------------------------------------------------------------------------------
✅ Elliott Wave Analysis
Mapping the wave cycle movements on the H4 timeframe:
- ⚡Wave Structure:
The sharp decline from the major peak toward the 1.15700 area is calculated as Sub-Wave A (or Wave 1). The upward bounce that stalled at the 1.16541 green line is identified as the formation of Sub-Wave B (a micro zigzag correction).
- ⚡Current Status:
The drop from 1.16541 to 1.15229 is calculated as part of the Sub-Wave C expansion (or micro Wave 3). The current upward bounce from 1.15229 to 1.15442 represents the formation of a minor corrective sub-wave (relief rally) to retest the SBR area.
- ⚡Projection:
The direction of price movement is projected to complete this corrective rebound by testing the SBR/HVN area in the 1.15600–1.15800 range, before reversing course to slide back down, breaking the green line at 1.15229 and targeting the Major Demand level at 1.15000. AUDTHB Eyes Fed MeetingYesterday Recap 15/9/26
Yesterday, AUDTHB closed at 23.71 in the Thai market, while there were no high-impact Australian economic releases.
Fundamental 16/9/26
Key Events Today | Actual | Forecast | Previous
AU: 08:00 MI Leading Index MoM | -0.0% | - | 0.0%
There are no high-impact Australian economic releases today. The MI Leading Index MoM came in at -0.0%, broadly unchanged from the previous 0.0%, suggesting that the outlook for economic momentum has not changed significantly and has a relatively limited impact on the AUD.
Therefore, the AUD is expected to be driven mainly by external factors, particularly the Chinese economic outlook, commodity prices, Risk Sentiment, and USD direction, as well as the Fed meeting outcome tonight, which could affect capital flows and the AUD.
View: AUDTHB is expected to move within a range, with the main focus on Risk Sentiment, China, Commodities, and the Fed meeting outcome.
AUDTHB — Technical Analysis 1H
Bias: Sideway
AUDTHB remains range-bound between 23.67–23.74, with resistance at 23.74 and support around 23.67/23.66. If price holds above 23.67, it could rebound to test 23.74. However, a break below 23.66 could lead to further downside toward 23.65–23.64.
Resistance: 23.74
Support: 23.67 / 23.66
Target: 23.74
Cut Loss: 23.65 CHFTHB Eyes Fed MeetingYesterday Recap 15/9/26
Yesterday, CHFTHB closed at 40.69 in the Thai market, while there were no high-impact Swiss economic releases.
Fundamental 16/9/26
Key Events Today
There are no high-impact Swiss economic releases today, so CHF is expected to be driven mainly by global market factors, particularly the USD, Bond Yields, and Risk Sentiment.
In addition, markets remain focused on the monetary policy direction of major central banks. If the market shifts into a Risk-Off environment, safe-haven demand could support the CHF, while Risk-On conditions could reduce demand for the CHF.
Overall, CHFTHB is expected to move within a range, with the main focus on Risk Sentiment, USD, Bond Yields, and the Fed meeting decision tonight.
Technical Analysis — CHFTHB
Bias: Sideway
CHFTHB remains range-bound between 40.56–40.67, with price still unable to clearly break above the 40.67 resistance. If price holds above 40.56, it could rebound to test 40.67. However, a break below 40.56 could lead to further downside.
Resistance: 40.67
Support: 40.56
Target: 40.67
Cut Loss: 40.52 GBPTHB Tracks CPI and Fed SignalsYesterday Recap — 15/9/26
Yesterday, GBPTHB closed at 44.85 in the Thai market.
The Claimant Count Change came in at 27.8K, significantly higher than the forecast of 8.3K, compared with the previous reading of -11.8K.
Meanwhile, Employment Change 3M/3M came in at 67K, down from the previous reading of 83K.
The Unemployment Rate stood at 4.9%, below the forecast of 5.0% and unchanged from the previous reading of 4.9%.
Average Earnings ex Bonus came in at 3.5%, in line with both the forecast and the previous reading.
Overall, the data suggests that the UK labor market remains relatively resilient. Although employment growth has slowed, wage growth and the unemployment rate remain at levels that continue to support the GBP.
Fundamental — 16/9/26
Key Events Today | Forecast | Previous
UK 13:00 — CPI YoY | 3.1% | 2.9%
UK 13:00 — Core CPI YoY | 2.6% | 2.6%
UK 13:00 — CPI MoM | 0.3% | —
Today, the key UK economic data is CPI. CPI YoY is forecast to increase to 3.1%, up from 2.9% previously, while Core CPI YoY is expected to remain unchanged at 2.6%.
If inflation comes in above expectations, it could reduce expectations for further monetary policy easing by the BoE and potentially support the GBP.
Overall, GBPTHB is expected to remain range-bound and volatile, with the main focus on UK CPI, BoE interest-rate expectations, and tonight's Fed meeting.
Technical Analysis — GBPTHB 1H
Bias: Sideway
GBPTHB continues to trade within the 44.76–44.87 range.
The pair was previously in an uptrend and continued to form Higher Lows, but has entered a short-term consolidation phase.
If the price holds above 44.76, it could rebound toward 44.87. However, if the price breaks below 44.76, further downside could develop.
Resistance: 44.87
Support: 44.76
Target: 44.87
Cut Loss: 44.72