GBP/USD Technical Analysis📊 GBP/USD Technical Analysis – Bearish Continuation Setup 🐻
The overall market structure remains bearish after the strong rejection from the major resistance around 1.3558. Price is currently making a corrective move, but buyers are still struggling to regain control.
🔍 Key Observations
🛑 Strong rejection from higher resistance confirms selling pressure.
📈 Current bounce appears to be a pullback rather than a trend reversal.
⚠️ The highlighted supply zone (1.3465–1.3480) is the key area to watch for fresh selling.
📦 If sellers defend this zone, bearish momentum could resume.
🎯 Bearish Scenario
✅ Wait for bearish confirmation inside the supply zone.
📉 A rejection could send GBP/USD back toward the order block around 1.3380, which is the next major downside target.
🚨 A sustained breakout above the supply zone would weaken the bearish outlook and open the door for a move toward the higher resistance.
🧠 Conclusion
The bias remains bearish while price trades below the resistance zone. A pullback into supply followed by rejection would offer the highest-probability continuation toward the marked order block. 📉🔥
Forex market
| FRGNT DAILY CHART ANALYSIS | DXY CONFLUENCE AUDUSD📈| Q3 | W30| D20 PREP Y26 | PART 2
📊 💡| FRGNT DAILY CHART ANALYSIS | DXY CONFLUENCE AUDUSD
This forecast is built using an advanced adaptation of Smart Money Concepts, with a structured and disciplined approach:
• Marking Key Points of Interest (POIs) on Higher Time Frames (HTFs) 🕰️
• Defining a clear, controlled trading range from those zones 📐
• Refining entries on Lower Time Frames (LTFs) 🔎
• Waiting for confirmed Break of Structure (BoS) before execution ✅
This process ensures precision, removes emotional decision-making, and keeps me aligned with the overall market narrative.
💡 Core Philosophy
“Capital management, discipline, and consistency create longevity.”
A strong risk-to-reward model, paired with high-probability execution, is the foundation of sustainable trading 📈🔐
⚠️ Understanding Losses
"Losses are part of the game" — a mathematical certainty 🎲
They don’t define performance. Nor do they define you as a Trader.
They are managed, reviewed, and used as evidence for growth 📊
🙏 Final Note
Appreciate you taking the time to review today’s forecast.
Stay disciplined 🎯
Protect your capital 🔐
— FRGNT 🚀📈
📌 Disclaimer
This content is provided for educational purposes only and does not constitute financial advice.
It reflects my personal approach to the markets — a tested framework that has supported my own journey toward consistent profitability in currency trading.
Please understand that any forecasts shared are not financial advice. I will be looking for confirmation in line with my setup model and specific entry criteria from the key areas identified on the chart.
All analysis, whether presented via image or video, is shared strictly for educational insight and is not intended to breach any TradingView House Rules.
This forecast is built using an advanced adaptation of Smart Money Concepts, with a structured and disciplined approach:
• Marking Key Points of Interest (POIs) on Higher Time Frames (HTFs) 🕰️
• Defining a clear, controlled trading range from those zones 📐
• Refining entries on Lower Time Frames (LTFs) 🔎
• Waiting for confirmed Break of Structure (BoS) before execution ✅
This process ensures precision, removes emotional decision-making, and keeps me aligned with the overall market narrative.
💡 Core Philosophy
“Capital management, discipline, and consistency create longevity.”
A strong risk-to-reward model, paired with high-probability execution, is the foundation of sustainable trading 📈🔐
⚠️ Understanding Losses
"Losses are part of the game" — a mathematical certainty 🎲
They don’t define performance. Nor do they define you as a Trader.
They are managed, reviewed, and used as evidence for growth 📊
🙏 Final Note
Appreciate you taking the time to review today’s forecast.
Stay disciplined 🎯
Protect your capital 🔐
— FRGNT 🚀📈
📌 Disclaimer
This content is provided for educational purposes only and does not constitute financial advice.
It reflects my personal approach to the markets — a tested framework that has supported my own journey toward consistent profitability in currency trading.
Please understand that any forecasts shared are not financial advice. I will be looking for confirmation in line with my setup model and specific entry criteria from the key areas identified on the chart.
All analysis, whether presented via image or video, is shared strictly for educational insight and is not intended to breach any TradingView House Rules.
EURUSD: Is the Long-Term Bearish Channel Still in Control?EUR/USD Mid- to Long-Term Analysis | Weekly Timeframe
As shown on the weekly chart, EUR/USD has been trading within a long-term descending channel since 2014. Throughout this period, the upper boundary, lower boundary, and median line of the channel have consistently acted as major support and resistance levels.
Over the past year, the pair made several attempts to break above the channel's upper boundary. However, none of these breakouts were confirmed. After losing the 1.15782 level, followed by a break below 1.14110, the market structure shifted, confirming a bearish trend across the lower timeframes.
📉 Bearish Scenario
As long as price remains below the upper boundary of the channel, the bearish outlook remains the preferred scenario.
Scenario 1
If selling pressure persists and price breaks below the LQ1 liquidity zone, the next downside target is likely to be around 1.08814.
Scenario 2
If bearish momentum strengthens further and price also breaks below the LQ2 liquidity zone, the next major support is expected near 1.052288.
🌍 Fundamental Outlook
From a fundamental perspective, if the European Central Bank (ECB) maintains a more accommodative monetary policy than the Federal Reserve (Fed), and the monetary policy divergence continues to favor the U.S. Dollar, additional downside pressure on the Euro is likely.
📈 Long-Term Perspective
Despite the current bearish bias, I consider the 1.052288 area to be a major long-term support zone. Should price show a clear market structure shift and bullish confirmation around this region, it could mark the beginning of a medium-term recovery, potentially targeting the upper boundary of the weekly descending channel.
Disclaimer: This analysis is based on the current technical structure and prevailing macroeconomic conditions. Future economic data, central bank policy decisions, or a decisive break of key technical levels may invalidate this outlook.
#EURUSD #Forex #TechnicalAnalysis #FundamentalAnalysis #EUR #USD #ECB #Fed #PriceAction #Trading #WeeklyChart
EURCHF The Target Is DOWN! SELL!
My dear followers,
This is my opinion on the EURCHF next move:
The asset is approaching an important pivot point 0.9246
Bias - Bearish
Safe Stop Loss - 0.9251
Technical Indicators: Supper Trend generates a clear short signal while Pivot Point HL is currently determining the overall Bearish trend of the market.
Goal - 0.9239
About Used Indicators:
For more efficient signals, super-trend is used in combination with other indicators like Pivot Points.
Disclosure: I am part of Trade Nation's Influencer program and receive a monthly fee for using their TradingView charts in my analysis.
———————————
WISH YOU ALL LUCK
EURAUD Liquidity below 1.6000On the daily timeframe, EURAUD is showing a clear pool of liquidity below the 1.6000 level.
On H4, the bullish trendline has been broken, which invalidates the demand zones supporting the previous uptrend. This aligns with the idea of a potential move lower as price seeks the liquidity resting beneath 1.6000.
For that reason, I'm looking for short opportunities from this H4 supply zone, with the expectation of a continuation to the downside.
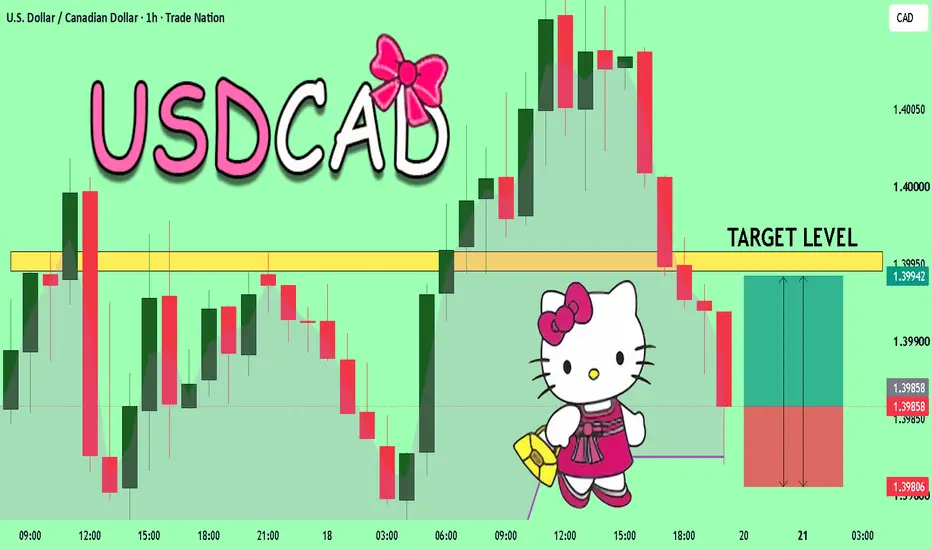
Falling towards pullback support?Loonie (USD/CAD) is falling toward the pivot, which acts as a pullback support that aligns with the 38.2% Fibonacci retracement and could bounce towards the 1st resistance.
Pivot: 1.3985
1st Support: 1.3869
1st Resistance: 1.4179
Disclaimer:
The opinions given above constitute general market commentary and do not constitute the opinion or advice of IC Markets or any form of personal or investment advice.
Any opinions, news, research, analyses, prices, other information, or links to third-party sites contained on this website are provided on an "as-is" basis, are intended to be informative only, and are not advice, a recommendation, research, a record of our trading prices, an offer of, or solicitation for, a transaction in any financial instrument and thus should not be treated as such. The information provided does not involve any specific investment objectives, financial situation, or needs of any specific person who may receive it. Please be aware that past performance is not a reliable indicator of future performance and/or results. Past performance or forward-looking scenarios based upon the reasonable beliefs of the third-party provider are not a guarantee of future performance. Actual results may differ materially from those anticipated in forward-looking or past performance statements. IC Markets makes no representation or warranty and assumes no liability as to the accuracy or completeness of the information provided, nor any loss arising from any investment based on a recommendation, forecast, or any information supplied by any third party.
AUDUSD | 4H Resistance RejectionAUDUSD offered a clean short opportunity after price rallied into a well-defined 4H resistance zone and began to show signs of rejection. I entered at 0.70108 because the trade was not about chasing weakness, but about selling into an area where sellers had already stepped in and where price was likely to struggle if the rejection held.
The structure on the chart supports a continuation lower, with the next meaningful downside area sitting near 0.69204 and the invalidation above 0.70250 keeping the risk clearly defined.
This setup fits my strategy because it combines location, confirmation, and structure. The entry was taken only after price moved into the marked supply area, and the stop was placed outside the zone so the trade has a clear line of invalidation. The reward-to-risk is strong, and the trade only needs price to respect the resistance and rotate lower for the idea to remain valid.
I will now let the market decide whether this rejection is strong enough to continue the move, rather than interfering with the position early.
Trade Plan
Entry: 0.70108
Stop Loss: 0.70250
Target: 0.69204
Bias: Bearish
Style: 4H price action, resistance rejection, defined risk, high RR continuation trade
Key takeaway: This is a disciplined short from resistance, with clear risk and a strong downside objective. The trade is now about execution and patience, not prediction.
#EURNZD:+850 PIPS Smart Highly Probable Selling Setup! ▲ EURNZD has been in a prolonged bearish trend with a ranging pattern. However, the price is currently experiencing strong bearish volume in the market, pushing it down without any corrections. This usually happens when the market has one-sided liquidity.
▲ We’ve seen some support, so we expect a price correction. This gives us a 50% equilibrium point, which is where we’ve placed a sell entry. The two horizontal lines represent entry and exit points. Use them wisely – you can use your own points or our as a reference.
▲ This is just an educational analysis, so please don’t use it blindly. Do your own analysis and risk management is key.
I▲ f you agree with our idea, please like and comment. We’ll continue posting trading setups like this!
Kind Regards,
Team Setupsfx_❤️
AUDUSD H1 | Bullish Bounce Off Pullback SupportMomentum: Bullish
Price is currently above the ichimoku cloud.
Buy entry: 0.70065
- Pullback support
- 61.8% Fib retracement
Stop Loss: 0.69905
- Swing low support
Take Profit: 0.70266
- Swing high resistance
High Risk Investment Warning
Stratos Markets Limited (fxcm.com/uk), Stratos Europe Ltd (fxcm.com/eu):
CFDs are complex instruments and come with a high risk of losing money rapidly due to leverage. 69% of retail investor accounts lose money when trading CFDs with this provider. You should consider whether you understand how CFDs work and whether you can afford to take the high risk of losing your money.
Stratos Global LLC (fxcm.com/en): Losses can exceed deposits.
Please be advised that the information presented on TradingView is provided to FXCM (‘Company’, ‘we’) by a third-party provider (‘TFA Global Pte Ltd’). Please be reminded that you are solely responsible for the trading decisions on your account. Any information and/or content is intended entirely for research, educational and informational purposes only and does not constitute investment or consultation advice or investment strategy. The information is not tailored to the investment needs of any specific person and therefore does not involve a consideration of any of the investment objectives, financial situation or needs of any viewer that may receive it. Past performance is not a reliable indicator of future results. Actual results may differ materially from those anticipated in forward-looking or past performance statements. We assume no liability as to the accuracy or completeness of any of the information and/or content provided herein and the Company cannot be held responsible for any omission, mistake nor for any loss or damage including without limitation to any loss of profit which may arise from reliance on any information supplied by TFA Global Pte Ltd.
Stratos Trading Pty. Limited (fxcm.com/au):
Trading FX/CFDs carries significant risks. FXCM AU (AFSL 309763), please read the Financial Services Guide, Product Disclosure Statement, Target Market Determination and Terms of Business at fxcm.com/au
Q3 | W30 | D21 | Y26 | USDCAD | FRGNT DAILY CHART ANALYSIS 📈| Q3 | W30 | D21 | Y26 |
📊| USDCAD |
🔐 | FRGNT DAILY CHART ANALYSIS
This forecast is built using an advanced adaptation of Smart Money Concepts, with a structured and disciplined approach:
• Marking Key Points of Interest (POIs) on Higher Time Frames (HTFs) 🕰️
• Defining a clear, controlled trading range from those zones 📐
• Refining entries on Lower Time Frames (LTFs) 🔎
• Waiting for confirmed Break of Structure (BoS) before execution ✅
This process ensures precision, removes emotional decision-making, and keeps me aligned with the overall market narrative.
💡 Core Philosophy
“Capital management, discipline, and consistency create longevity.”
A strong risk-to-reward model, paired with high-probability execution, is the foundation of sustainable trading 📈🔐
⚠️ Understanding Losses
"Losses are part of the game" — a mathematical certainty 🎲
They don’t define performance. Nor do they define you as a Trader.
They are managed, reviewed, and used as evidence for growth 📊
🙏 Final Note
Appreciate you taking the time to review today’s forecast.
Stay disciplined 🎯
Protect your capital 🔐
— FRGNT 🚀📈
📌 Disclaimer
This content is provided for educational purposes only and does not constitute financial advice.
It reflects my personal approach to the markets — a tested framework that has supported my own journey toward consistent profitability in currency trading.
Please understand that any forecasts shared are not financial advice. I will be looking for confirmation in line with my setup model and specific entry criteria from the key areas identified on the chart.
All analysis, whether presented via image or video, is shared strictly for educational insight and is not intended to breach any TradingView House Rules.
FX:USDCAD
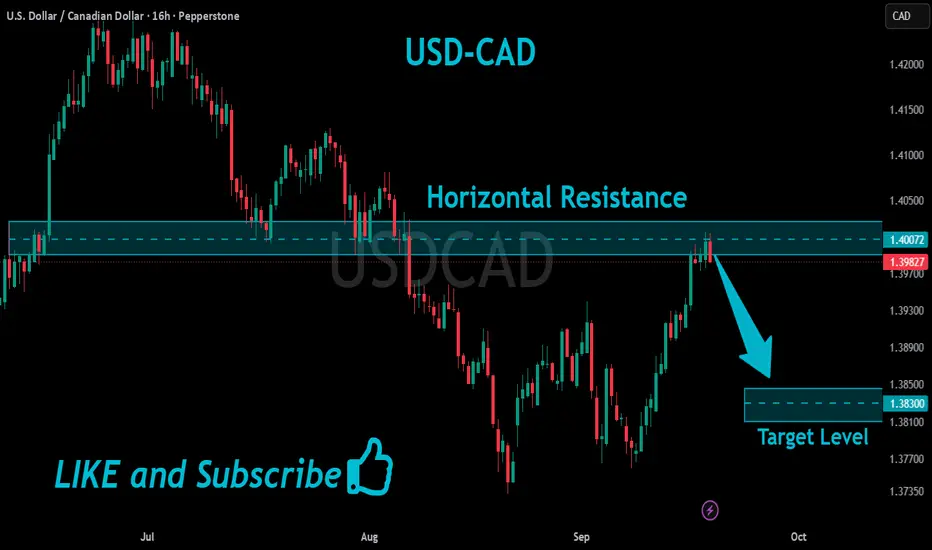
USD/CAD Faces Key Weekly Resistance as Short-Term PullbackHi,
Despite its long-term bullish trend, USD/CAD could see a short-term pullback due to the recent weakness in the U.S. dollar and its proximity to a major weekly resistance level. A move toward the next daily support around 1.4000 remains a likely scenario, representing a potential decline of about 0.55%.
AUDUSD Eyes Daily Breakout as Dollar Weakness Fuels Bullish termHi,
AUD/USD is showing short-term bullish momentum against the broader trend due to the recent weakness in the U.S. dollar. If the pair manages to break the daily resistance level marked on my chart, it could gain at least 0.38%, with the main target at 0.70470.
EURAUD at Key Support: Will Price Rebound to 1.64200EURAUD is approaching an important support zone, an area where buyers have stepped in and produced strong bullish reactions before.
The recent decline is bringing price back toward this level, so I’m watching for signs that selling pressure is beginning to fade. A clear rejection, bullish engulfing candle, or long lower wick would strengthen the case for a recovery.
If buyers regain control from this zone, price could rebound toward the 1.64200 target.
However, a decisive break below support would invalidate the bullish outlook and expose the market to further downside.
This is only my personal market view, not financial advice.
CHFJPY Is Very Bullish! Buy!
Please, check our technical outlook for CHFJPY.
Time Frame: 4h
Current Trend: Bullish
Sentiment: Oversold (based on 7-period RSI)
Forecast: Bullish
The market is on a crucial zone of demand 200.661.
The oversold market condition in a combination with key structure gives us a relatively strong bullish signal with goal 201.282 level.
P.S
Please, note that an oversold/overbought condition can last for a long time, and therefore being oversold/overbought doesn't mean a price rally will come soon, or at all.
Like and subscribe and comment my ideas if you enjoy them!
| ASIA RANGE GBPUSD SHORT + 3% | Q3 | W30| D21 | Y26📈| Q3 | W30| D21 | Y26
📊 | ASIA RANGE GBPUSD SHORT + 3% |
💡| FRGNT DAILY CHART ANALYSIS |
This forecast is built using an advanced adaptation of Smart Money Concepts, with a structured and disciplined approach:
• Marking Key Points of Interest (POIs) on Higher Time Frames (HTFs) 🕰️
• Defining a clear, controlled trading range from those zones 📐
• Refining entries on Lower Time Frames (LTFs) 🔎
• Waiting for confirmed Break of Structure (BoS) before execution ✅
This process ensures precision, removes emotional decision-making, and keeps me aligned with the overall market narrative.
💡 Core Philosophy
“Capital management, discipline, and consistency create longevity.”
A strong risk-to-reward model, paired with high-probability execution, is the foundation of sustainable trading 📈🔐
⚠️ Understanding Losses
"Losses are part of the game" — a mathematical certainty 🎲
They don’t define performance. Nor do they define you as a Trader.
They are managed, reviewed, and used as evidence for growth 📊
🙏 Final Note
Appreciate you taking the time to review today’s forecast.
Stay disciplined 🎯
Protect your capital 🔐
— FRGNT 🚀📈
📌 Disclaimer
This content is provided for educational purposes only and does not constitute financial advice.
It reflects my personal approach to the markets — a tested framework that has supported my own journey toward consistent profitability in currency trading.
Please understand that any forecasts shared are not financial advice. I will be looking for confirmation in line with my setup model and specific entry criteria from the key areas identified on the chart.
All analysis, whether presented via image or video, is shared strictly for educational insight and is not intended to breach any TradingView House Rules.
This forecast is built using an advanced adaptation of Smart Money Concepts, with a structured and disciplined approach:
FX:GBPUSD
Falling towards pullback support?CAD/JPY is falling towards the pivot, which is a pullback support that aligns with the 38.2% Fibonacci retracement and could bounce towards the 1st resistance which acts as pullback resistance.
Pivot: 115.20
1st Support: 114.72
1st Resistance: 115.93
Disclaimer:
The opinions given above constitute general market commentary and do not constitute the opinion or advice of IC Markets or any form of personal or investment advice.
Any opinions, news, research, analyses, prices, other information, or links to third-party sites contained on this website are provided on an "as-is" basis, are intended to be informative only, and are not advice, a recommendation, research, a record of our trading prices, an offer of, or solicitation for, a transaction in any financial instrument and thus should not be treated as such. The information provided does not involve any specific investment objectives, financial situation, or needs of any specific person who may receive it. Please be aware that past performance is not a reliable indicator of future performance and/or results. Past performance or forward-looking scenarios based upon the reasonable beliefs of the third-party provider are not a guarantee of future performance. Actual results may differ materially from those anticipated in forward-looking or past performance statements. IC Markets makes no representation or warranty and assumes no liability as to the accuracy or completeness of the information provided, nor any loss arising from any investment based on a recommendation, forecast, or any information supplied by any third party.
Fundamental Market Analysis for July 21, 2026 USDJPYThe yen remains under pressure due to the wide interest rate differential between the United States and Japan. The yield on the 10-year US Treasury note remains close to 4.6%, supporting interest rate differential trades and demand for the dollar. The Bank of Japan is normalizing its policy cautiously, leaving the market without sufficient grounds to expect a sustained narrowing of the yield gap in favor of the Japanese currency.
Japan’s economic strategy, which focuses on investment and faster growth, is also influencing the market. The final policy document reaffirmed the Bank of Japan’s independence, although concerns about the fiscal burden and fluctuations in Japanese government bond yields remain. Higher imported energy costs may worsen the country’s terms of trade and limit the yen’s recovery.
Elevated USD/JPY levels increase the market’s sensitivity to a possible response from the Japanese authorities, so the upside potential should be assessed cautiously. Nevertheless, there have been no fresh confirmed actions capable of changing the fundamental picture, while US Treasury yields and the interest rate differential continue to favor the dollar. Within the daily forecast horizon, the base case remains a moderate rise in the pair.
Trading idea: BUY 162.500, SL 162.200, TP 163.150
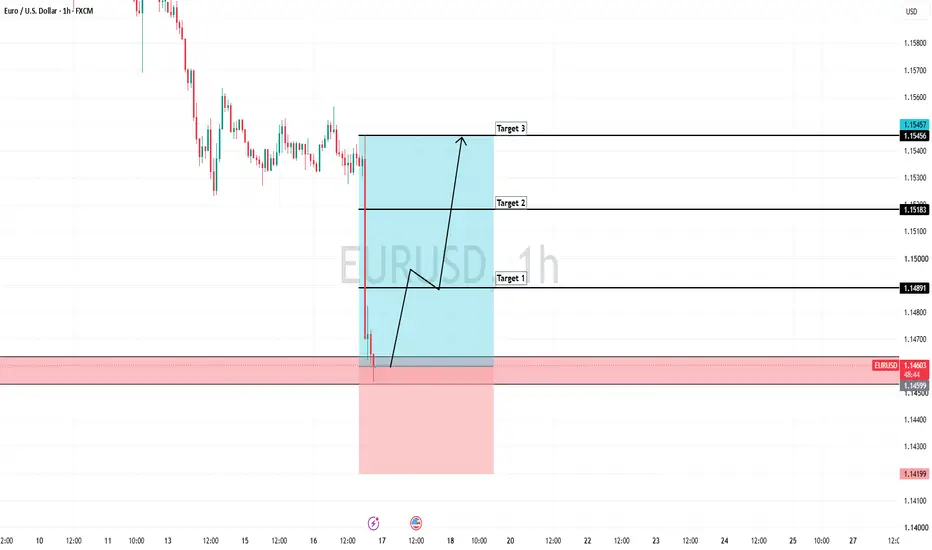
EUR/USD Still Awaits ECB Decision for Further BoostEUR/USD moved within a narrow consolidation range throughout Tuesday's Asian trading session, holding just above the 1.1400 round figure (a four-day low touched yesterday).
Institutional market participants chose to refrain from placing aggressive directional positions in anticipation of the highly anticipated European Central Bank (ECB) monetary policy decision on Thursday.
-------------------------------------------------------------------------------------------------------------
✅ Fundamental Dynamics: ECB Expectations vs Spiralling US Energy Inflation
The current transatlantic exchange rate balance is entirely held hostage by contrasting central bank policies and geopolitical shocks:
- Wait-and-See ECB Decision This Thursday: Investors are reluctant to increase their long exposure to the euro before hearing directly from Christine Lagarde's economic projections. The market wants to determine whether the ECB will maintain its dovish stance or begin to show caution regarding monetary tightening following the soaring cost of upstream imported commodities.
- Hawkish Fed Shield & Middle East War: Meanwhile, the US dollar (USD) continues to receive safe-haven funds and bond yield adjustments. The prolonged US-Iran military escalation in the Strait of Hormuz continues to keep crude oil prices near peak levels, reviving concerns about energy-driven inflation.
-------------------------------------------------------------------------------------------------------------
✅ Technical Analysis 4-Hour Chart (H4):
Technically, EUR/USD maintains a solid bearish structure after experiencing strong rejection at a key barrier last week:
- Recovery Trend Break: EUR/USD's failure to break through 1.1480-1.1485 confirms that the pullback from the four-week peak is still active. As long as spot prices remain below this dynamic moving average line, the path of least resistance is purely downward (downside bias).
- 1.1400 Level Breakout Scenario: A clear break and closing candle below 1.1400 would confirm bearish continuation, paving the way for an accelerated decline towards a retest of the current year's low at 1.1325.
EURCHF Sellers In Panic! BUY!
My dear friends,
EURCHF looks like it will make a good move, and here are the details:
The market is trading on 0.9228 pivot level.
Bias - Bullish
Technical Indicators: Supper Trend generates a clear long signal while Pivot Point HL is currently determining the overall Bullish trend of the market.
Goal - 0.9245
About Used Indicators:
Pivot points are a great way to identify areas of support and resistance, but they work best when combined with other kinds of technical analysis
Disclosure: I am part of Trade Nation's Influencer program and receive a monthly fee for using their TradingView charts in my analysis.
———————————
WISH YOU ALL LUCK
EURNZD LongHey traders! I'm watching EURNZD (1H Timeframe) closely as we have an incredibly precise institutional long setup developing right off a fresh liquidity grab.
Here is the technical breakdown of why this pair is looking primed for a solid bounce back to the upside:
🔍 The Technical Breakdown:
The Liquidity Hunt: Price just executed a sharp sweep of the recent sell-side liquidity, dipping down to tap the major unmitigated demand zone resting at 1.95700 - 1.95756.
Order Flow Shift: Right after sweeping the lows, we got a clean structural validation (BOS/CHOCH internal shift) with the market creating a brand new protected low at 1.95790.
Mitigation of Local Demand: We have successfully mitigated the local order block (OB) structure on the 1H timeframe, indicating that buyers are stepping in to defend this higher floor.
Momentum Rebound: The RSI (14) has successfully bounced out of the deep oversold territory and is climbing past 41.62, signaling that selling pressure is drying up as bullish momentum begins to build.
Dashboard Confluence: While the short-term 5M trend remains bearish, the 15M timeframe is Bullish and the Weekly/Monthly trends remain strongly Bullish, aligning this intraday reversal play with macro institutional order flow.
📊 Trade Parameters:
Entry Zone: ~1.95890 - 1.96021 (Catching the local structural retest and reaction)
Stop Loss: Just below the protected low invalidation at 1.95756
Target: Aiming for the unmitigated Lazy Trader Mini BOS Supply zone resting overhead near 1.96819+!
🔥 Join the Conversation!
Do you think this clean liquidity sweep is enough to send EURNZD back toward the 1.96800 structural highs, or will the bears attempt to break below the macro demand?
👇 Drop your analysis, entry zones, and targets in the comments below!
If you like this SMC price action setup, make sure to HIT THAT LIKE BUTTON 👍, FOLLOW for high-probability daily setups, and SHARE with your trading community! Let’s secure these pips! 📈
#EURNZD #Forex #SmartMoneyConcepts #SMC #PriceAction #TradingView #TechnicalAnalysis #DayTrading #OrderBlock #LiquiditySweep
CADJPY: Long Signal Explained
CADJPY
- Classic bullish formation
- Our team expects growth
SUGGESTED TRADE:
Swing Trade
Buy CADJPY
Entry Level - 115.58
Sl - 115.51
Tp - 115.72
Our Risk - 1%
Start protection of your profits from lower levels
Disclosure: I am part of Trade Nation's Influencer program and receive a monthly fee for using their TradingView charts in my analysis.
❤️ Please, support our work with like & comment! ❤️