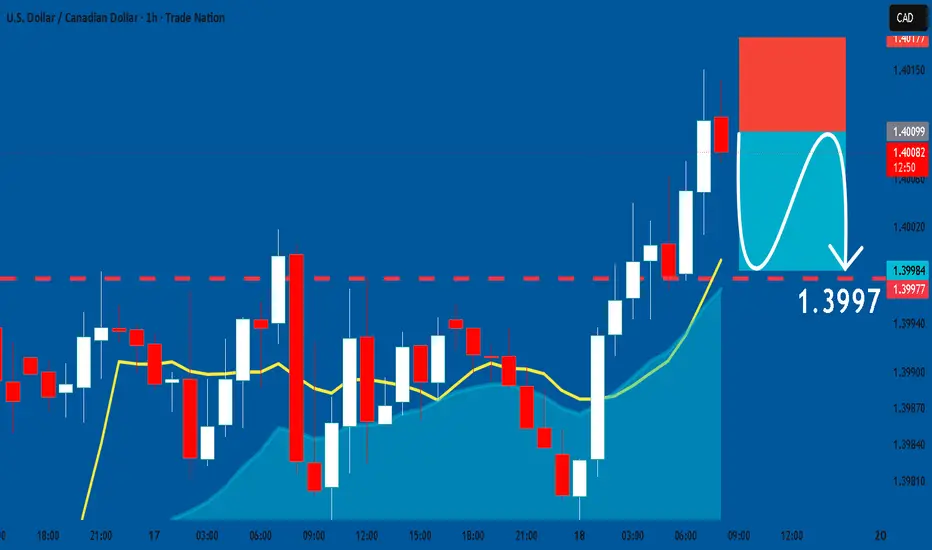
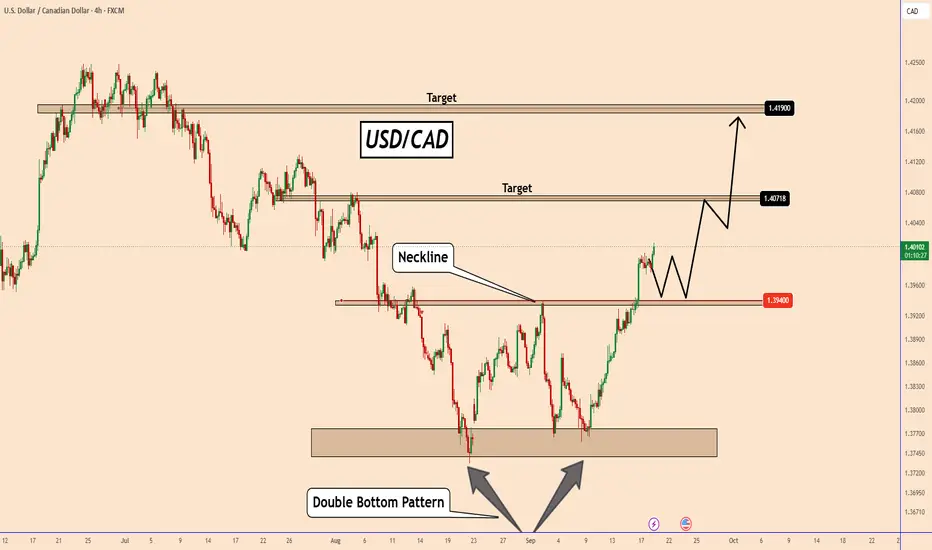
Forex market
Hot Setup on the Radar: Prepping for the Next Big Breakout on US 🚀🎯FX traders and tech analysts, feast your eyes on this clean setup! We are looking at the USD/JPY (U.S. Dollar / Japanese Yen) 1-Hour chart, and the price action is forming a textbook structure that is getting ready to trigger! 📊
✨📌 Technical View & Chart Pattern:The pair has been coiling tightly inside a beautifully defined Symmetrical Triangle. It has completed its structural corrective waves (A, B, C, D, and E) with pinpoint precision.Right now, the price is consolidating near the apex of the triangle—the exact zone where volatility compresses right before a massive explosive move!
🦅🎯 Strategic Trade Setup (Bullish Bias):The chart outlines a highly tactical, multi-level entry plan to maximize confirmation and lock in the momentum:First Entry Zone (Entry 1): Around 162.162 (Initial validation of the bounce/breakout).Second Entry Zone (Entry 2): Around 162.378 (Confirmation of buyer dominance pushing higher).Take Profit (TP 1): Set firm at 162.843 🎯
.Invalidation Level (Stop Loss): A clean hourly close below 162.090
🛑 (Always protect your capital with strict risk management!).
💡 Why This Setup Checks Out:Flawless Structural Geometry: Price has respected both the descending and ascending trendlines perfectly.RSI Gauge: Sitting comfortably at 54.11, meaning there is plenty of room for the bulls to run before hitting overbought territory.
📣 What’s your take on this? Will the Dollar smash through the resistance and fly straight to TP 1, or does the Yen have a surprise reversal waiting for us? 🇯🇵🇺🇸Drop your charts and biases in the comments below! 👇👇
#Forex #Trading #USDJPY #TechnicalAnalysis #FXTrading #TradingView #DayTrading
GBP/USD: Is a Deeper Pullback About to Unfold?GBP/USD has completed an impressive rally, but the latest price action suggests the market may now be entering a corrective phase before the next larger move develops.
The current Elliott Wave structure points to the possibility of a temporary recovery being followed by another leg lower, creating an important area to watch as the broader trend continues to unfold. Confirmation from price action will be key before considering the next high-probability opportunity.
We'll be monitoring the evolving wave structure closely to determine whether this correction has further to run or if a stronger trend reversal begins to emerge.
Disclosure: We are part of Trade Nation's Influencer program and receive a monthly fee for using their TradingView charts in our analysis.
EUR/USD: Is the Correction Complete or One More Dip Ahead?EUR/USD is approaching a decisive point after recovering from its recent decline, with price now testing an area that could determine the next medium-term direction.
The current structure suggests the market may still require one final corrective move before buyers attempt to regain control. If that scenario unfolds, it could present the foundation for the next impulsive advance within the broader trend.
With ECB interest rate decision due this week, volatility is likely to increase significantly. These high-impact events could provide the catalyst that confirms whether EUR/USD resumes its broader bullish structure or extends its correction.
As always, risk management remains essential during major economic releases, and we'll continue to monitor price action as the structure develops.
Disclosure: We are part of Trade Nation's Influencer program and receive a monthly fee for using their TradingView charts in our analysis.
GBPUSD is Nearing a Decent Support Line!Hey Traders, in tomorrow's trading session we are monitoring GBPUSD for a buying opportunity around 1.34050 zone, GBPUSD is trading in an uptrend and currently is in a correction phase in which it is approaching the trend at 1.34050 support and resistance area.
Trade safe, Joe.
GBPUSD LONG IDEAI try to explain for you how im thinking when i want to trade. I hope i can help for you :)
1. Market structure analysis:
Now we are above the H1 200 SMA and we see lover lows and lower highs, so we try to think about a long position.
2. Order block identification (Time zone: UTG + 2)
We can see a significant retracement from 15/JUL 09:00 - 11:00 and after this bearish move we can see a strong upward (bullish/long) movement from 15/JUL 12:00 - 15:00, which signs an order block here.
3. Fair value gap/ imbalance
After the order block we can see 2 FVGs below the Fibo 0.5 (this is the discount zone) and this confirms the order block.
4. What is happening now?
The price comes down and we are waiting for hitting the order block or FVG and depending on our psychology and the time we spend in front of the screen, we can place pending buy orders.
5. Pending orders:
"A" - the safest position (FVG step-in) : you can step in in time. You have less chance to miss out from the trade, you have wide stop loss and not so risky to hit the target price (here is the worst risk:reward ratio)
"B" - not so risky (Order block step-in) : You have a little bit more chance to miss out from the trade, but you have still wide stop loss, the risk is here the price can hit the target price harder (better risk:reward ratio)
"C" - riskier (FVG step-in) : you can step in in time. You have less chance to miss out from the trade, you have tighter stop loss, but not so risky to hit the target price
"D" - riskiest (FVG step-in) : you can step in in time. You have less chance to miss out from the trade. 2 risks: tighter stop loss and the price can hit the target price harder (best risk:reward ratio)
"E" - same as "D", but not so risky : because you have wider stop loss, but your risk-to-reward ratio is still enough good
6. Position management
When i reach the 1:1 risk:reward ratio i move my stop loss to breakeven (I am moving my stop-loss order to the level where the price reached my pending order). If you feel safer you can close half of your position at the 1:1 risk-to-reward ratio. After these steps its sure we win money and we dont loose. Position management depends on experience, time spent in front of the screen, and psychology.
7. Psychology
I think the right position for you is, when you can sleep soundly and don't check the chart every minute. Of course if you are day trader you have to check the chart more frequently
CADJPY – Professional Technical Outlook (Cup & Handle Pattern)1HCADJPY is developing a classic Cup & Handle formation, indicating a potential bullish continuation structure. The rounded base reflects strong accumulation, followed by a controlled pullback forming the handle near key resistance.
Trade Perspective:
A confirmed breakout and sustained close above the 115.75 neckline would validate the pattern, opening upside potential toward 116.30+ based on measured move projection.
Invalidation:
Failure to hold above 115.20, or a breakdown below the handle structure, would weaken the bullish setup and may lead to a deeper retracement.
Conclusion:
The structure favors bulls, with price compressing below resistance — a breakout scenario remains the preferred directional bias.
👉 Share your thoughts in the comments — what’s your view on CADJPY? Do you see a breakout or rejection from this level?
EURUSD | Bearish Rejection from 1H Supply | Sell Setup Toward 📉 Overview
EURUSD remains under bearish pressure after rejecting a key 1H supply zone that aligns with higher-timeframe resistance. The recent rally failed to establish a bullish break of structure, suggesting sellers are still defending premium prices.
As long as price trades below the marked resistance area, the probability favors continuation toward the lower demand zones.
🔍 Market Structure
The current market structure shows:
✅ Strong rejection from 1H resistance
✅ Failure to break above Previous Day High (PDH)
✅ Lower highs continuing to form
✅ Selling pressure inside premium pricing
The overall intraday bias remains bearish unless buyers reclaim the resistance zone.
🟣 Key Confluences
1. 1H Supply Zone
Price has reacted multiple times from the highlighted 1H resistance, confirming active seller participation.
2. Higher-Timeframe Resistance
The 4H resistance zone sits directly above the current market, adding another layer of confluence against further upside.
3. Previous Day High (PDH)
PDH remains unbroken, indicating buyers have not yet regained short-term control.
4. Premium Pricing
Current price is trading in a premium area where institutions often look for short opportunities before targeting discount levels.
🎯 Bearish Targets
If sellers maintain control, the next objectives are:
• Intraday liquidity below recent lows
• 1H Support Zone
• Equal lows / Sell-Side Liquidity (SSL)
• 4H Demand Zone
These levels represent potential areas where price may pause or reverse.
❌ Invalidation
The bearish outlook becomes invalid if price closes decisively above the 1H resistance and successfully reclaims the 4H resistance zone with strong bullish momentum.
🧠 Trading Plan
Bias: Bearish
Entry Zone: 1H Supply / Resistance
Confirmation:
Bearish rejection candle
Lower timeframe bearish market structure shift
Break of minor support
Increased selling momentum
Targets:
Recent swing low
1H Support
Sell-Side Liquidity
4H Demand Zone
Risk Management:
Wait for confirmation before entering. Avoid chasing price after large impulsive moves, and always use proper position sizing and predefined risk.
📚 Concepts Used
Smart Money Concepts (SMC)
ICT Methodology
Supply & Demand
Market Structure
Premium & Discount
Sell-Side Liquidity (SSL)
Previous Day High (PDH)
Multi-Timeframe Analysis
Price Action
USD/CHF – Liquidity Before the Next Move?**USD/CHF – Liquidity Before the Next Move?**
USD/CHF is currently presenting an interesting price action setup.
On **July 13**, the pair broke above a significant swing high before reversing sharply to the downside. This suggests that **buy-side liquidity** above the highs may have been taken before sellers stepped in.
During the decline, two notable swing highs were formed. These now stand out as potential **buy-side liquidity**. The higher of the two is located within the **Optimal Trade Entry (OTE)** zone, making it a potential magnet before the market resumes its bearish move.
On the downside, the lows from **July 2** and **July 3** are almost equal, creating an obvious **sell-side liquidity pool**.
**My preferred scenario:**
A retracement into the OTE zone to sweep the buy-side liquidity above, followed by a move lower toward the equal lows from July 2 and July 3.
From an ICT perspective, this would represent a classic liquidity sequence: **first collect liquidity on one side of the market, then target the liquidity resting on the opposite side.**
If price reaches those equal lows, institutional traders may use that liquidity to distribute or close parts of their short positions by selling into the incoming orders. Once that liquidity has been taken, the market could be in a position to stage a meaningful bullish reversal.
As always, this is **a trading scenario, not a prediction**. I will let price action confirm the idea before taking any position.
**Plan the trade. Let the market validate it.**
AUD/USD: Are Lower Prices Ahead?**AUD/USD: Are Lower Prices Ahead?**
The current chart structure looks particularly interesting.
Last week, the market broke its structure to the downside—an early indication that sellers may currently be in control.
Below the current price, there is an open **Fair Value Gap (FVG)** that could act as a magnet from a price action perspective. At the same time, two notable **buy-side liquidity** levels remain above the current market, where a significant number of buy-stop orders are likely resting.
**My preferred scenario:**
Price first sweeps the buy-side liquidity above the current market before reversing lower and moving into the open FVG.
This would follow the classic liquidity model: **collect liquidity first, then expand in the intended direction.**
Of course, this is **a scenario, not a prediction**. The market owes us nothing. That's why I wait for price action to confirm the idea and adapt to what the market actually does—not what I expect it to do.
**Trade the plan, not the prediction. That's what trading is all about.**
EUR/CAD – Is a Short-Term Long Setup Developing?***EUR/CAD – Is a Short-Term Long Setup Developing?**
This time, let's take a look at a cross pair.
On Friday, **EUR/CAD** broke below the low from **June 5**, suggesting a continuation of the bearish trend. However, on the **daily (D1) timeframe**, the market managed to close back **above** that low.
Could this have been a **liquidity sweep** rather than a true breakdown?
One level that immediately stands out is a **swing high above the current price**, representing a potential **buy-side liquidity** target. If Friday's move was indeed a sweep of sell-side liquidity, the market could have room for a corrective move higher before the broader downtrend resumes.
This would create a potential **short-term long opportunity**, even though it would be **counter-trend**. As traders, our job is not to predict the market but to identify high-probability scenarios and manage risk accordingly.
The distance to the next buy-side liquidity level appears sufficient to justify a trade—provided the lower timeframes confirm the idea with a valid entry signal.
As always: **This is a scenario, not a prediction. Price action will decide.**
**Trade the setup, not the bias.**
GBP/JPY Bearish Pullback from Resistance
The **GBP/JPY 1H** chart shows signs of a **bearish pullback** after price was rejected from the major resistance zone around **219.00**. Following a strong bullish impulse, the pair failed to maintain higher levels and has started forming lower highs while trading around the Ichimoku cloud, indicating weakening bullish momentum.
Price is currently testing the cloud resistance, and if sellers remain in control, a move toward the highlighted support level near **217.47** becomes the most likely scenario. This area also aligns with previous price structure and could act as the next demand zone where buyers may attempt to step back into the market.
A sustained break below the cloud would strengthen the bearish outlook, while a recovery above the recent swing highs and resistance zone would invalidate the downside setup.
### **🎯 Bearish Target**
* **Primary Target:** **217.47**
* **Resistance Zone:** **218.90 – 219.00**
* **Bias:** Bearish below resistance; watch for confirmation before entry.
AUD/USD Bearish Rejection Below Trendline## **Title: AUD/USD Bearish Rejection Below Trendline – Sellers Eye 0.6953 Support**
### **Chart Analysis:**
On the 1-hour timeframe, **AUD/USD** is showing signs of bearish weakness after failing to sustain its recent bullish momentum. Price previously rallied strongly but was rejected near the long-term ascending trendline, indicating that buyers are losing control at higher levels.
The Ichimoku Cloud suggests the pair is entering a period of uncertainty, with price hovering around the cloud while struggling to establish a bullish breakout. The highlighted projection shows a possible short-term pullback before sellers regain control.
If price remains below the nearby resistance zone around **0.6993–0.7000**, bearish pressure is likely to increase. A rejection from this area could trigger a move toward the marked horizontal support.
### **Bearish Target:**
🎯 **Primary Target:** **0.6953**
### **Key Levels:**
* **Resistance:** 0.6993 – 0.7000
* **Current Price:** 0.6982
* **Target Support:** **0.6953**
* **Major Support:** 0.6870
### **Trading Outlook:**
As long as AUD/USD stays below the highlighted resistance and fails to reclaim the upper trendline, the bias remains **bearish**. Traders should watch for bearish confirmation, such as rejection candles or a break below short-term support, before expecting a continuation toward **0.6953**. A sustained move above **0.7000** would weaken the bearish outlook and could invalidate this setup.
EURCAD SELL TRADE PLAN📌 X WEEKLY TRADE PLAN — EURCAD
🏷️ Status
CONDITIONAL TRADE PLAN
🎯 Trade Idea
SELL the corrective rally into H4 resistance.
Price has already travelled down toward the 1.6000 support area, so selling at 1.6030 would be late. The trade must come from the next lower-high supply zone.
📘 Trade Type
Tactical Corrective Sell / H4 Trend Pullback
📍 Entry Plan
Order Type: Conditional Sell
Entry: Sell the first retest after H4 rejection inside the Preferred Execution Band.
Main POI Zone: 1.6085–1.6120
Preferred Execution Band: 1.6090–1.6105
Set-and-Forget Eligible: NO
Monday CAD CPI is immediate event risk, the D1 chart is approaching support, and the recent ECB tightening backdrop conflicts with blind EUR selling.
POI Logic: Bearish H4 structure + rally into lower-high resistance + structural invalidation above supply + sufficient room toward the lower D1 range boundary.
🛑 Stop Loss
SL: 1.6145
🎯 Targets
TP1: 1.6000
TP2: 1.5920
TP3: 1.5850
📊 Risk / Reward
Approximate RR to TP2: 1:3.2–1:3.6
Risk: 0.50% maximum
Fundamental alignment is Conflicting, so this does not qualify for increased risk.
✅ Activation
Trade is not active now.
Activate only if:
1. Price rallies into 1.6085–1.6120.
2. An H4 candle closes back below 1.6080, confirming that the rally has failed.
3. Price provides the first retest into 1.6090–1.6105.
Do not enter if the rejection has already driven price below 1.6060 before the retest.
⚠️ Cancel Trade If
* H4 accepts above 1.6145.
* Price reaches 1.6000 before entry.
* Monday’s CAD CPI spikes through and consumes the POI.
* The ECB decision causes stable H4 acceptance above resistance.
* Price rejects from the POI but gives no retest—do not chase.
* The setup remains unfilled by Friday New York close.
*
📰 News Side Note
CAD-positive CPI or retail data supports EURCAD downside; weak CAD data makes the sell more dangerous. A hawkish ECB outcome supports EUR and cancels the short if price accepts above invalidation. Mixed results mean no first-spike execution. (Forex Factory)
🛡️ Trade Management
TP1:
Reduce exposure at 1.6000 because this is the first clear daily support area and the trade is corrective rather than a clean D1 trend continuation. If price cannot close below it, do not let the position return to full risk.
TP2:
This is the main daily range-low objective. Book most here because the 1.5920 area previously produced a meaningful recovery and may attract buyers again.
TP3:
Hold only a small remainder if H4 and D1 accept below 1.5920. A quick reclaim above the range floor means the downside extension has failed.
📝 Trader Note
Price has already fallen from 1.6250 and is now too close to 1.6000 support for a professional market short. Wait for the corrective rally into 1.6085–1.6120 and require sellers to reject that block before acting. If price trades 1.6000 before entry, the opportunity is missed. Acceptance above 1.6145 cancels the plan, and nothing should be chased lower.
GBPJPY Reversal: Will the Liquidity Buy Zone Hold?British Pound / Japanese Yen is demonstrating strong structural accumulation within an ascending corridor on the H4 timeframe successfully building a localized bullish continuation matrix away from its discounted floors based on the technical layout in image_85e651.jpg.
Following a definitive defense of the lower trendline and historical SSL matrix the immediate price action has cleared localized supply barriers with aggressive expansion blocks and is now executing a highly efficient technical retest of the broken liquidity zone.
Global Context
The broader financial spectrum continues to navigate intense structural volatility forcing massive capital relocations between safe haven assets and premium yen matrices ahead of key economic data releases.
Smart money has perfectly engineered this technical floor to trap overeager breakout sellers at the absolute market bottom before initiating a high velocity upward impulse wave.
This temporary downward correction behaves like a classic liquidity engineering mechanism pulling price action directly back into the 216.500 217.000 EQUAL LOW and LIQUIDITY (BUY ZONE) block to mitigate institutional buy orders and capture early short stops before an aggressive demand wave expands straight toward Target 1 and Target 2.
Technical Playbook
The Bias Short Term Bullish Retest / Medium Term Structural Expansion we are strictly focused on tracking this dynamic demand floor to ride the multi stage upward delivery corridor.
The Main Horizons tactical execution focal points are locked directly on the 216.500 217.000 EQUAL LOW and LIQUIDITY (BUY ZONE) matrix and the premium 220.000 Target 1 dynamic resistance ceiling shown in image_85e651.jpg.
The Target Path following the structural layout price action is projected to surge into Target 1 first at the upper channel boundary before executing a minor corrective pullback and launching a secondary expansion leg toward the primary premium baseline at Target 2 where heavy historical sellers rest.
Invalidation the entire bullish continuation framework is instantly invalidated if the market breaks convincingly below the critical protection floors down through the 216.500 boundary block.
GBPUSD Will Move Lower! Sell!
Here is our detailed technical review for GBPUSD.
Time Frame: 1D
Current Trend: Bearish
Sentiment: Overbought (based on 7-period RSI)
Forecast: Bearish
The price is testing a key resistance 1.345.
Taking into consideration the current market trend & overbought RSI, chances will be high to see a bearish movement to the downside at least to 1.328 level.
P.S
Overbought describes a period of time where there has been a significant and consistent upward move in price over a period of time without much pullback.
Like and subscribe and comment my ideas if you enjoy them!
GBPUSD 4H – Bullish Setup from Demand ZonesOn the 4H timeframe, GBPUSD is trading near key demand zones aligned with Fibonacci retracement levels. I am watching two potential long entries.
Key Demand Zones:
Demand Zone 1: 1.34260 (Aligned with 61.8% Fibonacci)
Demand Zone 2: 1.33700 – 1.33800 (Aligned with 78.6% – 86.6% Fibonacci)
Target: 1.36200
Trade Plan – Long Setup:
I am waiting for price to reach one of the demand zones. After seeing bullish confirmation on a lower timeframe, I will enter long.
Entry Zone 1: 1.34260 (after confirmation)
Entry Zone 2: 1.33700 – 1.33800 (after confirmation)
Stop Loss: Below the demand zone structure
Take Profit: 1.36200
Invalidation: Price breaks below 1.33500 with strong momentum
Pro Tips:
1. Do not chase price. Wait for price to come to demand zones.
2. Fibonacci levels add strong confluence to these demand zones.
3. Always wait for lower timeframe confirmation before entering.
4. Patience is key.
My Personal View:
I am watching 1.34260 and 1.33700 – 1.33800. If price reaches either zone and shows bullish confirmation, I will look for longs toward 1.36200. If price breaks below 1.33500, I will re-evaluate.
Not financial advice. Trade at your own risk.
Tags: GBPUSD, Forex, Bullish, DemandZone, Fibonacci, PriceAction, TradingView
EUR/USD SENDS CLEAR BEARISH SIGNALS|SHORT
Hello, Friends!
EUR-USD uptrend evident from the last 1W green candle makes short trades more risky, but the current set-up targeting 1.137 area still presents a good opportunity for us to sell the pair because the resistance line is nearby and the BB upper band is close which indicates the overbought state of the EUR/USD pair.
Disclosure: I am part of Trade Nation's Influencer program and receive a monthly fee for using their TradingView charts in my analysis.
✅LIKE AND COMMENT MY IDEAS✅
EURUSD Rejected at 1.1480 — Sellers Eye Return to 1.1420Hello traders! Here’s my technical outlook based on the current EURUSD (2H) chart structure. EURUSD previously declined inside a descending channel before finding support near the 1.1320 Buyer Zone, where buyers stepped in and reversed the trend. Price then entered a prolonged consolidation range before breaking higher through resistance and rallying into the 1.1480 Seller Zone. Currently, EURUSD is trading above the 1.1420 Buyer Zone while testing the 1.1480 Seller Zone and the long-term descending resistance line. The latest rejection from this confluence suggests sellers are beginning to defend the area. As long as EURUSD remains below the 1.1480 Seller Zone and respects the long-term descending resistance, the bearish scenario remains valid. A rejection from current levels could push price back toward the 1.1420 Buyer Zone (TP1). Please share this idea with your friends and click "Boost" 🚀
EURUSD: Support & Resistance Analysis for Next Week 🇪🇺🇺🇸
Here is my latest structure analysis and important
supports & resistances for EURUSD for next week.
Consider these structures for pullback/breakout trading.
❤️Please, support my work with like, thank you!❤️
I am part of Trade Nation's Influencer program and receive a monthly fee for using their TradingView charts in my analysis.