EURTHB Tracks EUR and USD DirectionYesterday Recap — 15/9/26
Yesterday, EURTHB closed around 38.40 in the Thai market.
The German ZEW Economic Sentiment came in at 34.7, below the forecast of 39.8, but slightly above the previous reading of 34.2.
Meanwhile, the German ZEW Current Conditions came in at -47.1, better than the forecast of -53.0 and improving from the previous reading of -61.1.
The Eurozone ZEW Economic Sentiment came in at 25.8, below the forecast of 39.2, but higher than the previous reading of 31.4.
Overall, the data suggests that the outlook for the Eurozone economy remains relatively fragile, although Germany's current economic conditions have improved. This could limit the upside potential of the EUR in the short term.
Fundamental — 16/9/26
Key Events Today | Forecast | Previous
EU 16:00 — Eurozone Industrial Production MoM
-0.5% | 0.0%
EU 16:00 — Eurozone Industrial Production YoY
-0.4% | 0.1%
EU 16:00 — Eurozone Wage Growth YoY
— | 3.40%
Today, the market is mainly focused on Eurozone Industrial Production. The forecast for MoM is -0.5%, down from the previous 0.0%, while YoY is expected at -0.4%, compared with 0.1% previously.
This points to a potential weakening in the Eurozone industrial sector. If the data comes in below expectations, it could add pressure on the EUR due to concerns over the Eurozone economic outlook.
Meanwhile, Eurozone Wage Growth YoY was previously at 3.40%, which the market monitors in terms of inflationary pressures and the ECB's monetary policy outlook. If wage growth remains elevated, it could support the EUR by suggesting that inflationary pressures remain present.
In addition, EURTHB could be affected by European Bond Yields and the direction of the EUR, particularly changes in expectations regarding ECB monetary policy. Higher European Bond Yields could support the EUR, while weaker-than-expected economic data could put pressure on the EUR.
Overall, EURTHB is likely to remain range-bound and volatile, with the main focus on Eurozone Industrial Production, Wage Growth, European Bond Yields, and EUR direction.
The market will also monitor the Fed meeting and U.S. Bond Yields. A Hawkish Fed could support the USD and put pressure on EURTHB, while a Dovish Fed could help support EURTHB.
Technical Analysis — EURTHB 1H
Bias: Sideway
EURTHB continues to trade within the 38.32–38.44 range, with key resistance at 38.44 and support at 38.33/38.32.
If the price holds above 38.32, it could rebound toward 38.44. However, if the price breaks below 38.32, further downside pressure could emerge.
Resistance: 38.44
Support: 38.33 / 38.32
Target: 38.44
Cut Loss: 38.30 GBPUSD: This Isn’t a Breakdown — It’s CompressionHello everyone,
looking at GBP/USD right now, I don’t think this is the right moment to chase the downside. Instead, price appears to be entering a “compression phase” around support before the market decides its next direction.
From a fundamental perspective, the current backdrop is still creating some pressure on the pound. Hotter-than-expected U.S. inflation has increased expectations of a Fed rate hike, while elevated U.S. Treasury yields continue to give the dollar an advantage in the short term. This helps explain the recent pressure on GBPUSD. However, with the FOMC decision approaching, much of the hawkish expectation has already been priced in, so we shouldn’t automatically assume the USD will continue strengthening in a straight line.
Looking at the chart, the most important factor isn’t simply that GBPUSD remains below the descending trendline, but that price has now reached the 1.3460–1.3475 support zone. This is where I want to watch how buyers respond. While the trendline continues to press down from above, support is sitting directly underneath, leaving less and less room for price to move. In other words, GBPUSD is being compressed between resistance and support, and the eventual breakout could determine the next meaningful move.
I expect GBPUSD to remain relatively tight around the current area before a clearer breakout develops. If 1.3460–1.3475 holds and price breaks above the descending trendline, 1.3512 becomes the first upside target. If buying momentum is strong enough to clear that area, the recovery could extend toward 1.3535.
Overall, GBPUSD is not an attractive place to chase SELL positions just as price reaches support. I would rather wait and see whether buyers can stabilize the market and break the descending trendline. If that happens, GBPUSD could become an interesting pair to watch for BUY opportunities once clear confirmation appears.
Thanks for reading, and feel free to share your view! USDTHB Eyes Fed DecisionYesterday Recap — 15/9/26
Yesterday, USDTHB closed at 33.30 in the Thai market.
Meanwhile, the ADP Employment Change Weekly actual figure came in at 16.30K, up from the previous 12.00K, reflecting an improvement in employment conditions.
The NY Empire State Manufacturing Index came in at 7.60, below the forecast of 14.80 and the previous reading of 20.60, indicating a slowdown in New York’s manufacturing sector.
In the U.S. equity market, stocks closed lower amid pressure from higher Bond Yields and a surge in oil prices. Gold weakened to around $4,293/oz, while the DXY strengthened to around 99.7 amid a risk-off environment and ahead of the Fed meeting.
These factors provided support for the U.S. dollar and resulted in a slight weakening of the Thai baht, keeping USDTHB supported.
USDTHB
Fundamental — 16/9/26
Key Events Today| Forecast | Previous |
US: 19:30 — Core Retail Sales MoM | 0.5% | -0.3%
US: 19:30 — Retail Sales MoM | 0.8% | -0.6%
US: 19:30 — Import Price Index MoM | 0.0% | -0.4%
US: 01:00 — Fed Interest Rate Decision | 4.00% | 3.75%
The market is mainly focused on Core Retail Sales and Retail Sales, which reflect consumer spending. The market expects consumer spending to recover from the previous month. If the data comes in above expectations, it could support the USD, while weaker-than-expected figures could put pressure on the USD.
In addition, the FOMC will announce its policy decision and economic projections today, which could lead to high volatility in USDTHB, particularly through the direction of the Fed rate, USD, and U.S. Bond Yields.
Overall, USDTHB is expected to remain highly volatile tonight, with the key focus on Retail Sales and the FOMC decision.
Technical Analysis — USDTHB 1H
Bias: Sideway
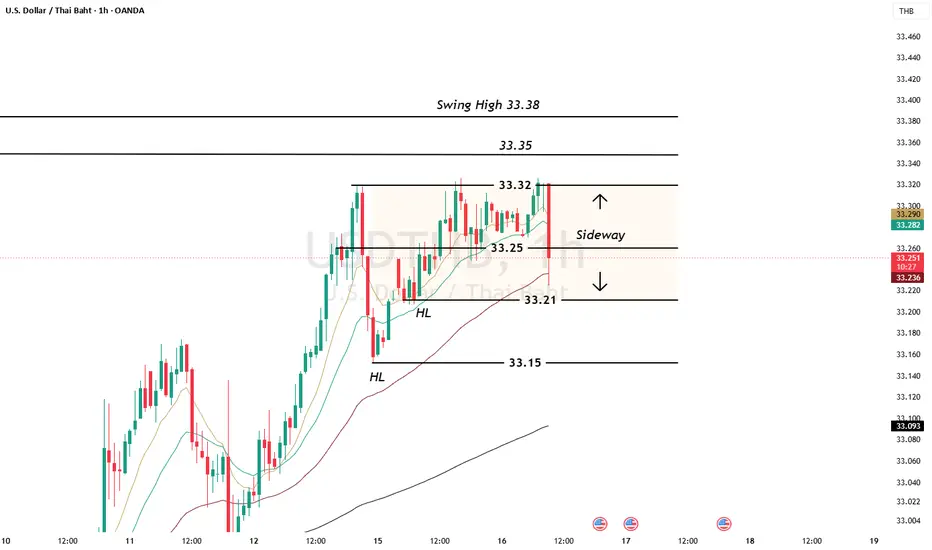
The price is moving within the 33.25–33.32 range after forming a Higher Low.
If the price holds above 33.25, it could move higher to test 33.32, followed by 33.35–33.38.
However, if the price breaks below 33.25, the current structure would weaken, increasing the possibility of a decline toward 33.21.
The broader picture remains supported by the USD and U.S. Bond Yields ahead of the Fed meeting.
Resistance: 33.32 / 33.35 / 33.38
Support: 33.25 / 33.21 / 33.15
Target: 33.32 → 33.35 → 33.38
Cut Loss: 33.20

 Long
Long