AUDTHB Eyes Risk SentimentFriday Recap 11/9/26
On Friday, AUDTHB closed at 23.69 in the Thai market, while the Thomson Reuters IPSOS Consumer Confidence came in at 48.50, down from 48.79 previously. This reflected a slight deterioration in Australian consumer confidence, indicating weaker sentiment toward economic conditions and consumer spending, which pressured the AUD in the short term. Overall, the AUD remained under pressure from higher energy costs and concerns over higher interest rates.
Fundamental 14/9/26
Key Events Today
There are no high-impact Australian economic releases today, leaving the AUD more sensitive to Risk Sentiment, USD direction, and the outlook for the Chinese economy than domestic factors.
At the start of the week, markets should focus on equity markets and commodity prices, as the AUD remains highly sensitive to Risk-on/Risk-off conditions. Markets are also monitoring the RBA's interest-rate outlook as inflationary pressures remain elevated.
Overall, AUDTHB is expected to trade within a range, with the main focus on Risk Sentiment, USD direction, and commodity prices.
Technical – 1H
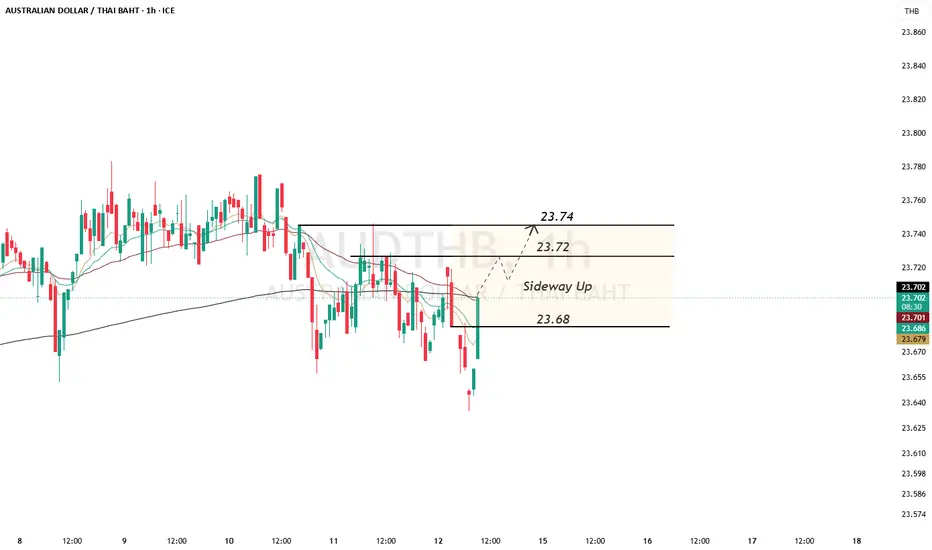
Bias: Sideway Up
The price has rebounded from the 23.68 zone and is attempting to hold above 23.70. A break above 23.72 could open the way for a test of 23.74. However, a break below 23.68 could lead to another decline. Overall, the pair remains range-bound.
Resistance: 23.72 / 23.74
Support: 23.68
Target: 23.72 → 23.74
Cut Loss: 23.67 EURTHB Fundamental 14/9/26 Key Events Today | Forecast | PreviFriday Recap 11/9/26
On Friday, EURTHB closed at 38.33 in the Thai market. The market closely monitored comments regarding the ECB's economic outlook, inflation, and monetary policy direction.
The ECB maintained a relatively hawkish stance, expressing concerns that inflation could remain above its target for an extended period. The ECB also left the door open to further rate hikes if energy-related inflationary pressures continue to increase, providing support for the EUR.
EURTHB
Fundamental 14/9/26
Key Events Today | Forecast | Previous
DE: 16:30
German 12-Month Bubill Auction | 2.656% | -
DE: 16:30
German 6-Month Bubill Auction | 2.502% | -
There are no major Eurozone economic releases today. The market will primarily monitor German government bond auctions, which reflect short-term borrowing costs and could influence the outlook for European Bond Yields.
However, the impact of these auctions is relatively limited compared with major inflation data or an ECB policy meeting. The ECB recently delivered a 25 bps rate hike and remains concerned about inflationary pressures stemming from higher energy prices.
Therefore, EURTHB is expected to move within a range with a short-term upside bias, with the market primarily focusing on European Bond Yields, EUR direction, and ECB guidance.
EURTHB – Technical 1H
Bias: Sideway Up
Price rebounded from 38.30 and has started to form a short-term Higher Low. If price can hold above 38.34, it could move higher to test the FVG at 38.42, followed by 38.50. However, a break below 38.30 would invalidate the Sideway Up structure.
Resistance: 38.42 / 38.50
Support: 38.34 / 38.30
Target: 38.42 → 38.50
Cut Loss: 38.30 USDTHB Holds Range Ahead of FedFriday Recap 11/9/26
On Friday, US inflation data came in relatively firm, particularly Core CPI MoM, which rose 0.3%, above the market expectation of 0.2%, indicating that underlying prices of goods and services continued to rise.
Although both Headline CPI YoY and Core CPI YoY came in line with expectations, the stronger-than-expected monthly Core CPI raised concerns that the Fed may not rush to cut interest rates or could ease monetary policy more slowly than previously expected. This could support the USD in the short term.
Meanwhile, US equities rebounded, with the S&P 500 up 0.86%, Dow up 0.91%, and Nasdaq up 0.98%. However, the broader market backdrop remains relatively tense, as August US inflation was broadly in line with expectations, while the market increased its focus on the possibility of a Fed rate hike at this week's meeting. The US 10-Year Treasury Yield remained around 4.96%.
USDTHB
Fundamental 14/9/26
Key Events Today
There are no major US economic releases today. As a result, the USD is likely to be driven primarily by global market factors and US Treasury yields, with the market positioning ahead of the September 15–16 Fed meeting and closely monitoring elevated Bond Yields.
Therefore, USDTHB is expected to move within a range, with the market primarily focusing on USD direction, US Bond Yields, and Risk Sentiment. If Treasury Yields remain elevated, they could help limit the downside of USDTHB.
USDTHB – Technical Analysis
Bias: Sideway Up
Price is beginning to form a Higher Low (HL) structure and remains above 33.05. If price can hold above this level, it could move higher to test 33.17 and 33.20. However, a break below 33.00 would invalidate the Sideway Up structure and could lead to further downside correction.
Resistance: 33.17 / 33.20
Support: 33.05 / 33.00
Target: 33.17 → 33.20
Cut Loss: 33.00 USDJPY long daily USD/JPY — Fundamental View
My current view on USD/JPY is bearish in the short term. I expect the pair to remain under corrective downside pressure.
However, I am considering a risky long position during this decline, based on the possibility that the current weakness eventually creates an attractive entry for a recovery in USD/JPY.
This is not a conventional bullish setup. I am deliberately buying against the current bearish price movement, which means the trade carries significantly higher risk.
The fundamental reason behind this idea is the US–Japan interest-rate differential. US interest rates remain substantially higher than Japanese rates, maintaining a structural yield advantage for the US dollar.
At the same time, the Bank of Japan is currently at an important turning point, with markets expecting further monetary tightening. Therefore, I do not view this trade simply as “buy USD/JPY because US rates are higher.”
Instead, my thesis is that after the current correction, the US rate advantage could regain dominance if the Fed remains relatively hawkish while BoJ tightening progresses gradually.
In other words:
Short-term view: Bearish USD/JPY
Trade idea: Risky long during the correction
Medium-term thesis: Potential recovery if the US–Japan yield differential remains supportive
The main risk is that the current decline develops into a deeper trend reversal. A more aggressive BoJ tightening cycle, combined with faster Fed easing, would weaken the fundamental basis for this long position.
Therefore, I am not trying to predict the exact bottom. I am accepting higher risk in exchange for the possibility of entering long at a significantly better level during the correction.
Bias: Bearish correction → risky contrarian long → potential medium-term recovery.
Key variable: US–Japan interest-rate differential. GBP/USD Technical Outlook : 14–19 September 2026Current Price: 1.35230
Timeframe: 4H | Overall Structure: Ascending Channel + Potential Head & Shoulders
GBP/USD enters the week of 14–19 September 2026 at a technically critical point. While the broader 4H structure remains supported by an ascending channel, price continues to struggle below the 1.3650–1.3680 resistance zone.
The chart also presents a potential Head & Shoulders formation, with the neckline located around 1.3480–1.3500. Repeated bearish RSI divergence suggests that upside momentum is weakening, increasing the probability of a corrective move.
Key Technical Levels
Resistance
1.35687 — Immediate resistance / bullish confirmation
1.36561 — Major resistance and key breakout level
1.38034 — Major upside target
Support
1.34812 — Critical neckline / primary support
1.34244 — Secondary support
1.32741 — Bearish projection target
Scenario Analysis
1. Bearish Scenario — Probability: 40%
This is the primary scenario for the week.
The bearish setup becomes increasingly relevant if GBP/USD fails to reclaim 1.35687 and subsequently breaks below the 1.34812 neckline on a confirmed 4H closing basis.
A confirmed breakdown could trigger a move toward:
1.34812 → 1.34244 → 1.3350 → 1.32741
The potential Head & Shoulders structure supports this scenario, while the bearish RSI divergence indicates weakening buying momentum.
A breakdown below 1.34244 would significantly strengthen the medium-term bearish structure and could open the way toward the 1.32741 bearish projection.
Bearish trigger: 4H close below 1.34812
2. Neutral / Consolidation Scenario — Probability: 35%
GBP/USD may remain trapped between 1.34812 and 1.35687, particularly while the market awaits major UK and US monetary-policy catalysts.
Under this scenario, price could produce several intraday false breakouts while maintaining a broader range.
The market would remain technically undecided until either:
Break below 1.34812 → bearish confirmation
or
Break above 1.35687 → bullish confirmation
This scenario is particularly relevant if buyers continue defending the 1.3480 area but fail to generate sufficient momentum to break 1.35687.
3. Bullish Scenario — Probability: 25%
The bullish scenario requires buyers to regain control above 1.35687.
A sustained 4H close above this level would weaken the potential Head & Shoulders formation and could trigger a recovery toward:
1.35687 → 1.36561 → 1.3750 → 1.38034
The strongest bullish confirmation would occur above 1.36561.
A decisive breakout above 1.36561 would substantially invalidate the immediate bearish reversal thesis and restore the broader ascending-channel trend.
Bullish trigger: 4H close above 1.35687
Major confirmation: break above 1.36561
Market Bias
Weekly Bias: BEARISH
The probability distribution for 14–19 September 2026 is:
Bearish: 40%
Neutral: 35%
Bullish: 25%
The bearish scenario receives the highest probability because GBP/USD is showing signs of momentum exhaustion, remains below the major resistance structure, and is approaching the critical 1.34812 neckline.
However, the broader ascending channel means that the bearish outlook should not be considered confirmed until price actually breaks and closes below the neckline.
GBP/USD Weekly Roadmap
Above 1.35687: bullish pressure increases toward 1.36561
Above 1.36561: potential continuation toward 1.3750–1.38034
1.34812–1.35687: consolidation / high-volatility range
Below 1.34812: bearish confirmation toward 1.34244
Below 1.34244: potential extension toward 1.32741
Final Outlook
GBP/USD enters the week with a bearish-leaning technical bias, although the market remains at a major decision point.
The 1.34812 neckline is the most important downside level, while 1.35687 represents the first major bullish trigger.
As long as price remains below 1.35687, the risk of a downside test toward 1.34812 and 1.34244 remains elevated.
A confirmed break below 1.34812 would significantly strengthen the bearish case, while a sustained move above 1.35687 would force a reassessment of the bearish outlook.
Primary scenario: Bearish — 40%
Secondary scenario: Neutral — 35%
Alternative scenario: Bullish — 25%
Want to know what could happen next on GBP/USD? Watch my latest Technical Analysis Short for a deeper breakdown of the market structure, key levels, and potential bullish and bearish scenarios.
DISCLAIMER
This market outlook is provided for educational and informational purposes only. It represents a technical analysis based on the chart structure and identified market scenarios and should not be considered financial, investment, or trading advice. The stated probabilities are subjective estimates, not guarantees of future price movements. Forex and CFD trading involve substantial risk, including the potential loss of capital. Always conduct your own research, apply appropriate risk management, and consider your financial circumstances before making any trading decision. EUR/USD 14-19 Sept 2026 : Market Awaits a Breakout The EUR/USD 4H chart currently reflects a moderately bearish technical structure, with price trading beneath a descending trendline and forming a descending triangle pattern. This formation suggests that sellers continue to control the upside, while the horizontal support around 1.1568 remains the key level that could determine the next directional move.
EUR/USD is currently trading around 1.1596, relatively close to this key support zone. As long as price remains below the descending trendline, the short-term bias continues to favor the downside. Momentum also does not yet indicate a convincing bullish recovery, as the 4H RSI remains below the 50 level, leaving room for further selling pressure without yet reaching oversold territory.
From a price-structure perspective, 1.1568 represents a critical decision level. A decisive 4H close below this area would confirm a bearish breakout from the descending triangle and potentially open the path toward 1.1521, followed by 1.1474. Should selling pressure intensify, the next projected downside target would be around 1.1425, which coincides with a major support zone and the longer-term ascending support trendline.
Conversely, the bearish scenario would lose validity if EUR/USD manages to break above and hold above the 1.1620–1.1640 area. Such a breakout would increase the probability of short covering and potentially push the pair toward the 1.1650–1.1670 resistance zone, with 1.1700 serving as the next major psychological and technical resistance.
Overall, the current structure is best interpreted as a bearish consolidation pattern approaching a potential breakout, rather than a fully confirmed downtrend. Market participants should closely monitor price action around the 1.1568–1.1600 zone. A break below support would strengthen the bearish scenario, while a reclaim of 1.1640 would provide an early indication that sellers are beginning to lose control.
From a fundamental perspective, EUR/USD volatility could increase as markets digest Federal Reserve policy expectations and key upcoming economic data. For this reason, technical confirmation remains particularly important to avoid false breakouts, especially around the 1.1568 support level.
Technical conclusion: As long as price remains below the descending trendline and 1.1640, the EUR/USD bias remains bearish-to-neutral, with 1.1568 acting as the primary trigger level. A confirmed break below this support could expose 1.1521–1.1474, while a sustained move back above 1.1640 would open the possibility of a recovery toward 1.1650–1.1700.
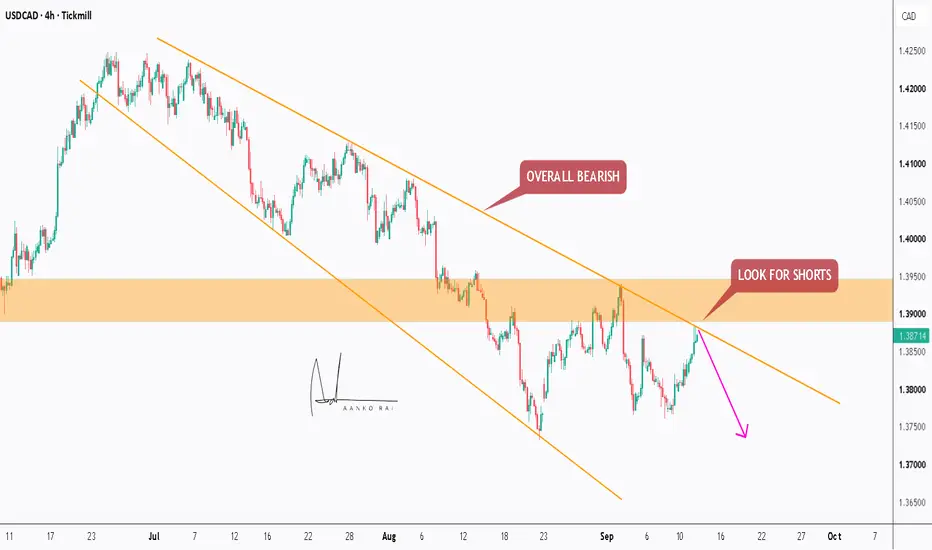
Want to dive deeper into this chart and get a better understanding of the technical analysis? Check out my short video analysis. USDCAD – Potential Wave B / Wave 3 Upside SetupOn the higher timeframe (Daily) , the primary expectation is that USDCAD is developing a larger WXY correction to the downside.
Wave W and Wave X appear to be completed, with the market now developing Wave Y to the downside.
The structure also leaves room for an alternative count, where the WXY-pattern may have already been completed earlier. In this scenario, the current decline could represent a Wave 2, with a potential Wave 3 to the upside still ahead.
Interestingly, both scenarios currently point towards the same near-term direction: higher .
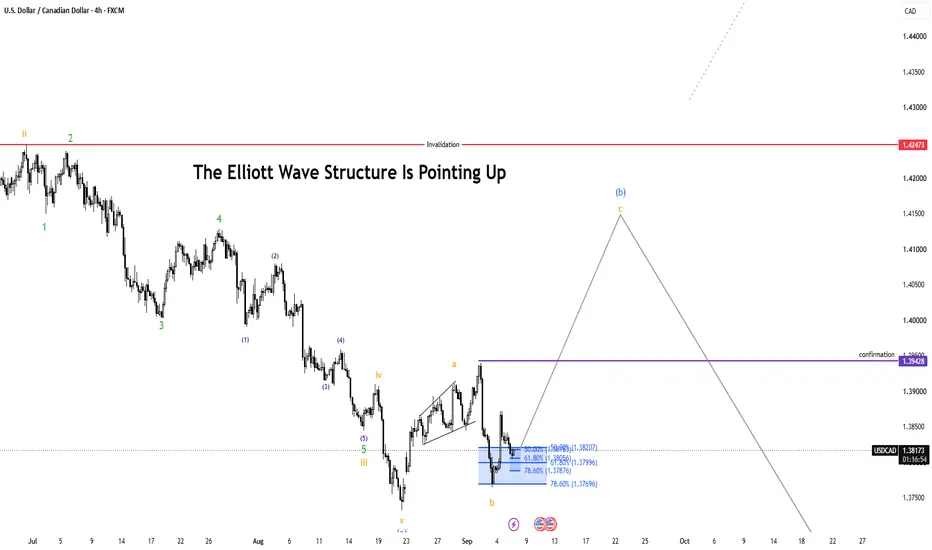
On the lower timeframe (4H) , Wave (a) of the current downside move developed as a clear five-wave impulse , with a strongly extended Wave iii- subwaves shown in green.
Following the completion of the impulse down, price formed a leading diagonal, marking the beginning of the new move to the upside. After this first move a small term correction has to happen and price has already shown a notable reaction from the relevant Fibonacci levels, giving us additional confluence for a potential continuation higher.
A first confirmation level for bullish price action is located at 1.38729. A break above this level would strengthen the case that the current corrective structure has completed and that the next move higher is beginning.
The key invalidation level for the primary count remains at 1.42473, the high of Wave X (highest degree).
The good part is that the alternative count would also support further upside from the current area. This means the exact count does not necessarily need to be resolved immediately. Both scenarios currently support the same directional bias.
Additional confluence comes from our current DXY structure, which also supports the bullish USD/CAD scenario.
This is a scenario based on structure and confirmation. The count remains subject to change if the market invalidates the current structure.

 Long
Long