EURUSD: Support & Resistance Analysis for Next Week 🇪🇺🇺🇸
Here is my latest structure analysis and important
supports & resistances for EURUSD for next week.
Consider these structures for pullback/breakout trading.
❤️Please, support my work with like, thank you!❤️
I am part of Trade Nation's Influencer program and receive a monthly fee for using their TradingView charts in my analysis.
Forex market
EURNZD Nears a Potential Bullish Reversal ZoneAfter an extended bearish trend that has dominated price action for nearly a month, EURNZD is approaching a key area where selling pressure may begin to fade. A final push lower could complete the current move before buyers attempt to regain control. If bullish confirmation appears, the coming week may offer a strong buy-side opportunity. Always wait for price confirmation before entering a trade.
#EURNZD #Forex #ForexTrading #PriceAction #BuySide #SwingTrading #TechnicalAnalysis #TradingView #MarketStructure #GAPFX
GBPJPY 19/07 Is Retracing Into Value AgainGBPJPY has rejected the recent Buy-Side Liquidity (BSL) after an aggressive bullish expansion, leading many traders to believe that a larger bearish reversal may already be underway.
The problem?
A rejection from liquidity alone does not confirm a trend reversal.
While the current decline has introduced short-term selling pressure, the H4 bullish structure remains intact. Price is now approaching a high-probability reaction area around the Point of Control (POC) and H4 Order Block (OB), where buyers could attempt to regain control.
The current move appears to be a healthy retracement rather than a confirmed bearish reversal.
For now, the market is correcting.
But the higher-timeframe trend hasn't been broken yet.
Currently
• Price swept the recent Buy-Side Liquidity (BSL)
• Short-term bearish momentum is developing
• H4 ascending channel remains intact
• Price is retracing toward the POC and H4 Order Block
• Major demand remains below current price
• Higher-timeframe structure continues to favor buyers
• A bullish reaction from demand could support trend continuation
Trading Plan
Bias: Bullish Retracement Within an H4 Uptrend
Main Zone
• 216.60–217.10 → H4 POC + Order Block
Execution Idea
As long as GBPJPY continues respecting the H4 ascending channel and the Order Block, the current decline can be viewed as a corrective pullback within the broader uptrend.
The primary area to monitor is the H4 POC and Order Block around 216.60–217.10. If buyers produce a strong bullish reaction from this zone and reclaim short-term momentum, price may continue toward the recent highs before attempting another sweep of the Buy-Side Liquidity.
However, if price fails to hold this demand area, the probability of a deeper correction toward the lower H4 demand will increase.
Targets
→ TP1: 218.00 → Internal Resistance
→ TP2: 219.00 → Previous Swing High
→ TP3: 219.50 → Buy-Side Liquidity (BSL)
→ TP4: New Highs Above BSL
Invalidation
A confirmed H4 candle close below the H4 Order Block, followed by a loss of the ascending channel structure, would weaken the bullish continuation scenario and increase the probability of a deeper correction.
Key Insight
Trends rarely move in a straight line. Healthy pullbacks into demand often provide stronger confirmation than chasing momentum at the highs.
Key Question
Is GBPJPY simply retracing into value before another leg higher, or is this the first sign of a larger H4 correction?
EURUSD | Can EUR Maintain The Upward Momentum?Macro approach:
- The euro-dollar advanced after softer US producer prices cooled expectations for further Fed rate hikes.
- At the same time, ECB officials warned that renewed Middle East tensions could lift energy costs and keep inflation pressures in play.
- EURUSD may stay volatile as traders weigh geopolitics against the evolving ECB policy outlook.
Technical approach:
- After breaking above both EMA, EURUSD broke the key level at 1.1423 and surged higher. The price is above golden-crossed EMAs, suggesting a potential bullish trend shift.
- If EURUSD remains above the support at 1.1423, the price may rise higher than toward the ascending channel's upper bound and the immediate resistance at 1.1500.
- On the contrary, if EURUSD closes below 1.1423, the price may test both EMAs and the next support at 1.1427.
Analysis by: Quoc Dat Tong, Senior Financial Markets Strategist at Exness
GBPUSD"Hello traders, I opened this trade on Friday, but before reaching the target the price reversed and the target was not achieved. I closed the trade with a small loss before the market closed, as I prefer not to hold trades over the weekend to avoid any price gaps at the opening. We now wait for the market to open, define the direction, and enter trades with a fixed stop-loss and a single target, focusing on short-term speculative trading."
EURUSDThere were two trades: the first was executed on Thursday and reached its target on Friday. The second trade has not yet hit the target and showed a slight price reversal, but it was expected to reach the target with Monday’s trading. However, I decided to close the trade with a small loss before the market closed, as I prefer not to hold positions over the weekend to avoid potential price gaps at the opening."
EURAUD WEEKLY CHARTFundamental Drivers (Interest Rates, Bond Yields & Carry Trade)
Heads of Central Banks
European Central Bank (ECB): President Christine Lagarde
Reserve Bank of Australia (RBA): Governor Michele Bullock
Current Interest Rates (July 2026)
ECB Deposit Facility Rate: 2.00% (after several cuts in 2025–2026)
RBA Cash Rate: 4.35%
Interest Rate Differential: RBA is higher by ~2.35% → Strongly favors AUD in carry trades.
Bond Yield Differential
Australian 10-year bond yield is generally higher than German/Eurozone yields.
This further supports AUD strength against EUR.
Carry Trade Impact
Positive carry (higher Australian rates) makes EURAUD SHORT attractive for carry traders.
Technically Bullish to neutral on weekly chart.
Next MPC & RBA Meeting Dates (Official Sources)
1. Reserve Bank of Australia (RBA)
Next Monetary Policy Meeting:
Tuesday, 11 August 2026 (Decision at 2:30 pm AEST)
2. Bank of England (MPC)
Next Monetary Policy Meeting:
Thursday, 30 July 2026 (Decision at 12:00 noon)
#EURAUD
GBPCHF is in the Selling from ResistanceHello Traders
In This Chart GBPCHF HOURLY Forex Forecast By FOREX PLANET
today GBPCHF analysis 👆
🟢This Chart includes_ (GBPCHF market update)
🟢What is The Next Opportunity on GBPCHF Market
🟢how to Enter to the Valid Entry With Assurance Profit
This CHART is For Trader's that Want to Improve Their Technical Analysis Skills and Their Trading By Understanding How To Analyze The Market Using Multiple Timeframes and Understanding The Bigger Picture on the Charts
EURCAD All Eyes on SellingHello Traders
In This Chart EURUSD HOURLY Forex Forecast By FOREX PLANET
today EURUSD analysis 👆
🟢This Chart includes_ (EURUSD market update)
🟢What is The Next Opportunity on EURUSD Market
🟢how to Enter to the Valid Entry With Assurance Profit
This CHART is For Trader's that Want to Improve Their Technical Analysis Skills and Their Trading By Understanding How To Analyze The Market Using Multiple Timeframes and Understanding The Bigger Picture on the Charts
GBPJPY Will Fly From Support LevelHello Traders
In This Chart GBPJPY HOURLY Forex Forecast By FOREX PLANET
today GBPJPY analysis 👆
🟢This Chart includes_ (GBPJPY market update)
🟢What is The Next Opportunity on GBPJPY Market
🟢how to Enter to the Valid Entry With Assurance Profit
This CHART is For Trader's that Want to Improve Their Technical Analysis Skills and Their Trading By Understanding How To Analyze The Market Using Multiple Timeframes and Understanding The Bigger Picture on the Chart
GBPUSD is in the Buying DirectionHello Traders
In This Chart XAGUSD HOURLY Forex Forecast By FOREX PLANET
today XAGUSD analysis 👆
🟢This Chart includes_ (XAGUSD market update)
🟢What is The Next Opportunity on XAGUSD Market
🟢how to Enter to the Valid Entry With Assurance Profit
This CHART is For Trader's that Want to Improve Their Technical Analysis Skills and Their Trading By Understanding How To Analyze The Market Using Multiple Timeframes and Understanding The Bigger Picture on the Charts
EURUSD 4H Market Structure — Major Breakout Setup Toward 1.1850EURUSD is currently consolidating between a long-term descending resistance line and a rising trendline support, creating a compression structure on the 4H timeframe.
Price continues to respect the lower trendline while multiple equal highs (EQH) indicate liquidity resting above the current market. A confirmed breakout above the descending trendline could open the way toward 1.1500–1.1550, followed by liquidity around 1.1620–1.1680.
If bullish momentum continues, the broader upside objective remains the 1.1840–1.1860 strong resistance zone, where significant liquidity and a potential market reaction may be expected.
The bullish scenario depends on trendline support holding and a confirmed structural breakout. A breakdown below support could invalidate or delay this outlook.
Not financial advice.
EURCHF FREE SIGNAL|LONG|
✅EURCHF is reacting from a bullish trendline after a sell-side liquidity sweep. A displacement from this discount PD array could drive price toward the overhead imbalance and target. Time Frame 3H.
—————————
Entry: 0.9233
Stop Loss: 0.9224
Take Profit: 0.9246
Time Frame: 3H
—————————
LONG🚀
✅Like and subscribe to never miss a new idea!✅
AUD-NZD Will Go UP! Buy!
Hello,Traders!
AUDNZD is reacting from a horizontal demand area after sweeping sell-side liquidity. A bullish rebound from this discount zone could extend toward the marked supply target. Time Frame 12H.
Buy!
Comment and subscribe to help us grow!
Check out other forecasts below too!
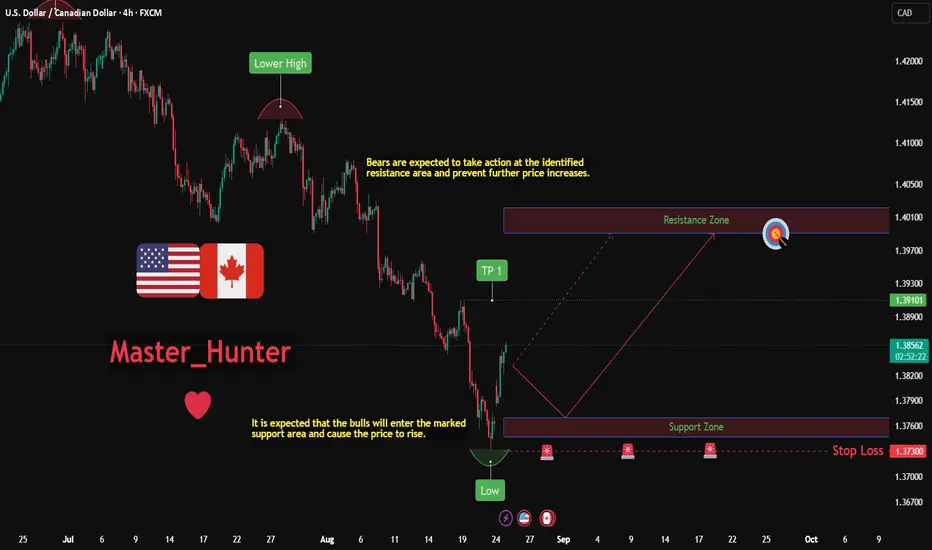
USD/CAD 2 Day AnalysisUSD/CAD has pulled back into a former resistance trendline that may now act as support. Price reaction at this level will be key in determining the next move. A strong bullish response could signal trend continuation toward recent highs, while a decisive break below the trendline would increase the likelihood of a deeper corrective decline.
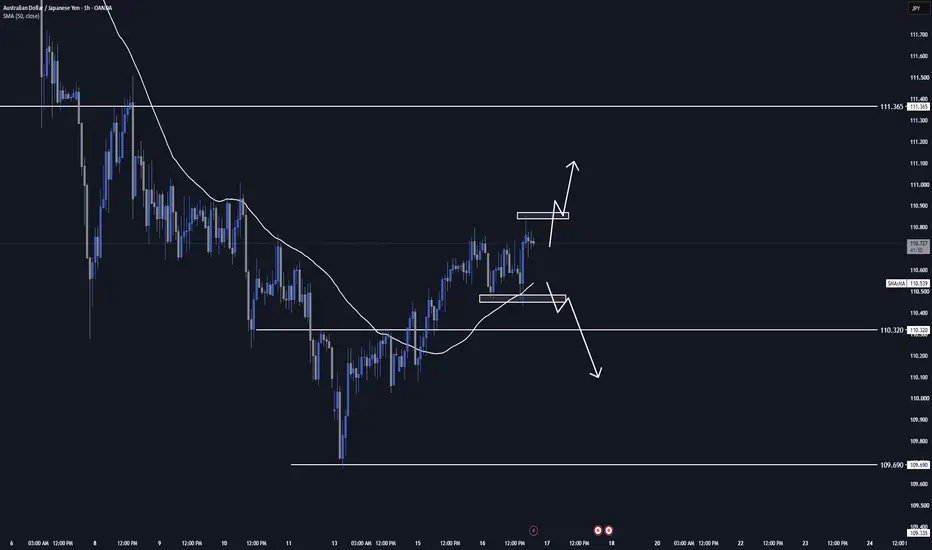
AUD-JPY Local Short! Sell!
Hello,Traders!
AUDJPY is reacting from a horizontal supply area after sweeping buy-side liquidity. A bearish rejection from this premium zone could extend lower toward the marked demand target. Time Frame 4H.
Sell!
Comment and subscribe to help us grow!
Check out other forecasts below too!
USD/JPY (1W) : Breakout or Double Top?USD/JPY (1W): Critical Multi-Year Resistance Test – Breakout or Double Top?
Market Overview
Ticker: USD/JPY (U.S. Dollar / Japanese Yen)
Timeframe: 1-Week (1W)
Current Price: 162.414
Sentiment: Neutral to Aggressively Bullish (Pending Structural Confirmation)
Technical Analysis
1. Major Resistance & Potential Double Top
On the weekly chart, USD/JPY has rallied back to its multi-year macro horizontal resistance line around 162.00 - 162.50 (marked by the horizontal blue line). This matches the significant peak established in mid-2024. Price action is currently consolidating tightly at this psychological barrier. A clean weekly close above this level signals a continuation of the secular bull market, while rejection confirms a major multi-year double top pattern.
2. Dynamic Trendlines & Key Support
The Upper Target Extension: An ascending dashed grey trendline connects the major historical swing highs. If a breakout above 162.50 is sustained, this dynamic line serves as the primary overhead target.
The Macro Floor: Major multi-month horizontal support rests firmly down at 140.00 (marked by the red horizontal line), which protected the downside across late 2023 and mid-2024.
3. Technical Indicators
RSI (14): Currently printing at 65.55, staying below the overbought threshold (70.00) but moving above its yellow moving average line (59.53). This shows steady, unexhausted bullish momentum heading straight into major resistance.
MACD (12, 26, 9): Both the MACD line (1.696) and the Signal line (1.590) are well above zero, reflecting a strong, long-term bullish regime. Crucially, the histogram is showing expansion back into green territory, indicating fresh buyer momentum is stepping back in.
Trading Setups & Scenario Planning
_____ Scenario A: The Bullish Breakout (Trend Continuation)
Trigger: A definitive weekly candle close above 162.50.
Target 1: 170.00 (Psychological round number).
Target 2: 180.00 (Intersect of the long-term ascending dashed grey trendline).
Invalidation/Stop: A drop and close back below 158.00 after a fakeout.
_____ Scenario B: The Bearish Rejection (Double Top Confirmation)
Trigger: An exhaustion pattern on the weekly frame (e.g., a long upper wick or bearish engulfing candle) spinning out of the 162.50 zone.
Target 1: 152.00 (Previous major structural inflection point).
Target 2: 140.00 (The major macro horizontal baseline floor).
___________________
Will the Bank of Japan or shifting macro yields cap the Dollar here to seal a massive double top, or will the momentum break through to clear new historical highs? Let me know your technical setup in the comments!