Forex market
EURUSD 4H: Bearish Reaction from FVGThe bearish weekly outlook remains unchanged, and the 4H chart is now starting to align with that higher timeframe bias.
Price has traded back into the 4H bearish Fair Value Gap while also taking the high of the previous candle, effectively sweeping nearby liquidity before showing a bearish reaction.
This creates a higher-probability location for sellers, but I am not interested in entering immediately.
My plan is to wait for confirmation on the lower timeframes before considering any short position.
If lower timeframe structure shifts bearish and confirms rejection from this area, I will look for sell opportunities targeting the next downside liquidity.
Higher timeframe narrative first.
Lower timeframe execution second.
Patience before entry.
CAD/JPY: Bullish Bias, Waiting DiscountThe higher-time-frame outlook remains bullish. Price continues to print higher highs and higher lows while taking external liquidity and mitigating key higher-time-frame points of interest. The overall bullish mapping from previous weeks remains intact, with no structural invalidation.
On the intermediate time frame, price has engineered liquidity by taking several internal liquidity legs while maintaining the overall bullish structure. My current focus is on the next lower-time-frame liquidity event.
I’m waiting for the current internal liquidity to be swept before looking for bullish continuation. If price respects the lower-time-frame order blocks beneath that inducement, I’ll begin monitoring for lower-time-frame confirmation. If those areas fail to hold, I’ll expect a deeper retracement into the 50% equilibrium or the extreme discount area, where multiple order-flow points of interest sit beneath the engineered liquidity.
The purple levels highlight higher-time-frame structural references and provide additional confluence. They help keep the broader market context in focus while tracking where significant liquidity is positioned. Every major structural level represents potential liquidity, making these areas important to monitor as price develops.
For now, patience remains the priority. I’ll continue tracking price as it approaches my areas of interest and wait for confirmation before considering execution. Let’s see what the market delivers this week.
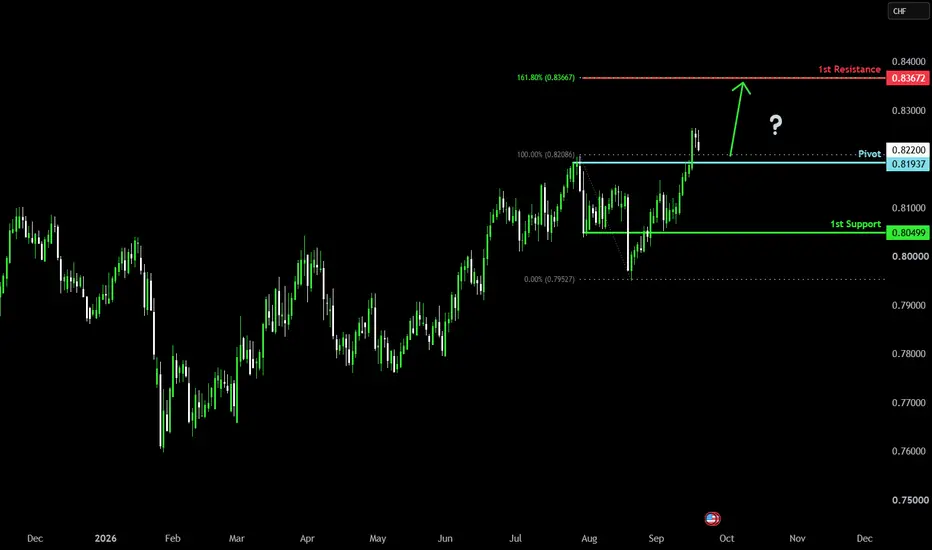
Bullish bounce off in play?EUR/CAD has bounced off the pivot, which acts as a pullback support and could potentially rise towards the overlap resistance, which aligns with the 50% Fibonacci retracement.
Pivot: 1.60146
1st Support: 1.59502
1st Resistance: 1.61133
Disclaimer:
The opinions given above constitute general market commentary and do not constitute the opinion or advice of IC Markets or any form of personal or investment advice.
Any opinions, news, research, analyses, prices, other information, or links to third-party sites contained on this website are provided on an "as-is" basis, are intended to be informative only, and are not advice, a recommendation, research, a record of our trading prices, an offer of, or solicitation for, a transaction in any financial instrument and thus should not be treated as such. The information provided does not involve any specific investment objectives, financial situation, or needs of any specific person who may receive it. Please be aware that past performance is not a reliable indicator of future performance and/or results. Past performance or forward-looking scenarios based upon the reasonable beliefs of the third-party provider are not a guarantee of future performance. Actual results may differ materially from those anticipated in forward-looking or past performance statements. IC Markets makes no representation or warranty and assumes no liability as to the accuracy or completeness of the information provided, nor any loss arising from any investment based on a recommendation, forecast, or any information supplied by any third party.
EURUSD H4: Testing Support Before the Next Move HigherEURUSD is pulling back toward the lower boundary of the ascending channel after an extended consolidation phase. Although the current momentum remains limited, the higher-low structure is still intact, and the 1.1400–1.1410 support zone continues to play a crucial role.
If the price holds this area and shows bullish confirmation signals, EURUSD could recover toward the 1.15125–1.15130 resistance zone.
Trading Plan
Entry: Buy when the price confirms support at the 1.1400–1.1410 zone.
Stop Loss: Below the lower boundary of the channel, around 1.1375.
Take Profit: 1.15125–1.15130
AUD/CAD Liquidity Grab Alert | High Probability Bullish Setup🦅💰 AUD/CAD "AUSSIE vs LOONIE" — BULLISH HEIST IN MOTION 🚨📈
Forex Market Trade Opportunity Guide | Day/Swing Trade 🔥
💰 THE HEIST PLAN — BULLISH JOB 🟢
🔓 Entry: Open entry accepted at ANY price level (Thief OG style — no fixed door, we're breaking in from any angle 🚪)
🏦 Vault Target (Final): @ 1.00000
💎 Vault Target 1 (Partial Escape): @ 0.99200
🚔 Police Force Alert: Heavy resistance + overbought conditions + liquidity trap risk sitting just below the 1.00000 handle — trend-change risk is real here, so grab your loot in tranches, don't get greedy 👀
🚪 Escape Hatch (Stop Loss): @ 0.97600
⚠️ Note: Dear Ladies & Gentleman (Thief OG's), i'am not recommended to set only my TP. its your own choice you can make money then take money at your own risk.
⚠️ Note: Dear Ladies & Gentleman (Thief OG's), i'am not recommended to set only my SL. its your own choice you can make money then take money at your own risk.
🔗 CORRELATED PAIRS TO WATCH 👀
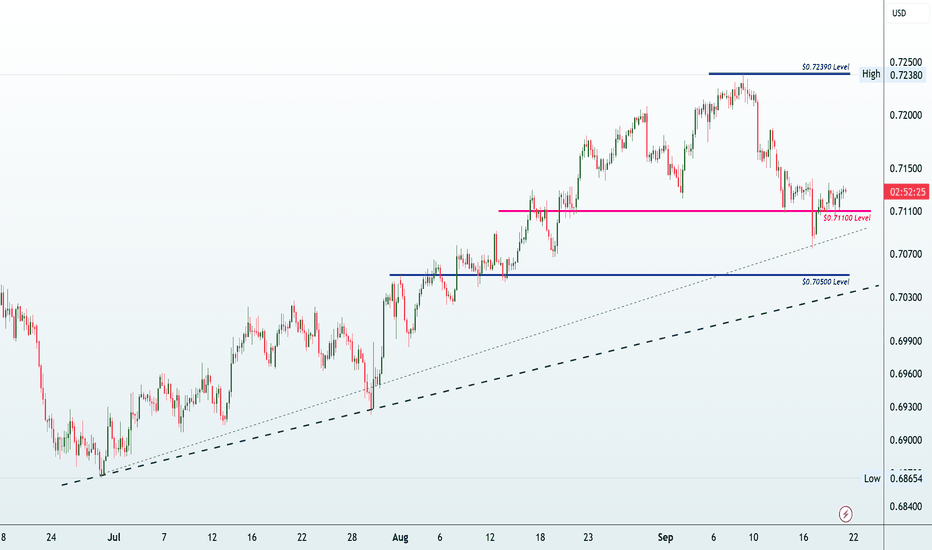
💵 AUD/USD — approx $0.7000-0.7010: Direct AUD strength gauge. If Aussie legs up here too, it confirms broad AUD demand feeding the AUD/CAD heist, not just a CAD weakness story.
💵 USD/CAD — approx $1.4030-1.4080: Inverse-style tell. A softer USD/CAD (CAD strength) works against our bullish plan; a firmer USD/CAD (CAD weakness) supports the vault run.
💵 DXY (US Dollar Index) — approx 100.7-101.0: Broad dollar strength pressures CAD indirectly since CAD sits in the DXY basket (~9.1% weight) — rising DXY can drag CAD down too, aiding our thesis.
💵 WTI Crude Oil — approx $82/barrel: CAD is a petro-currency. Strength in oil usually cushions CAD; oil weakness removes support from the Loonie and helps our bullish AUD/CAD case.
📊 FUNDAMENTAL & ECONOMIC FACTORS (Neutral — Market Facts Only) 🌍
🏛️ RBA (Australia): Cash rate sitting at 4.10%, following a run of hikes through early 2026 on sticky inflation and tight labor conditions. Next scheduled decision: 11 August 2026.
🏛️ BoC (Canada): Held its overnight rate at 2.25% on 15 July 2026 — sixth consecutive hold. Bank flagged improving growth but ongoing risk from Middle East-linked oil price volatility and US trade policy. Next decision: 2 September 2026.
📈 Rate Differential: AUD (4.10%) vs CAD (2.25%) — a notably wide gap that keeps AUD carry-appeal in focus, purely as a market fact, not a directional call.
🛢️ Oil/Geopolitics: Middle East tensions have kept crude elevated this year, a swing factor for CAD in either direction depending on how prices move next.
🤖 AI capex build-out cited by BoC as a supportive global growth factor.
📅 Watch the calendar: upcoming Australian employment/CPI prints and Canadian CPI/jobs data are the next scheduled catalysts that could move this pair sharply either way.
🚨 RISK FACTORS THAT COULD BUST THE JOB 🚨
🔺 A hawkish surprise from the BoC in September could give CAD sudden strength
🔺 A dovish RBA tone shift on softer Aussie data could cap AUD upside
🔺 Sharp oil price swings (geopolitical shock either direction) could flip CAD sentiment fast
🔺 Police Force zone near 1.00000 is a known liquidity magnet — false breakouts are common here
🎯 THIEF TRADER MOTIVATION 💬
"A true Thief doesn't chase every vault — he studies the blueprint, waits for the window, and strikes with precision. Patience is the best crowbar in this business." 🗝️🔥
"Every red candle is just the police shining a light — smart thieves adapt the plan, they don't abandon the mission." 🚨💪
📣 CALLS TO ACTION FOR THE CREW 👥
👍 Boost this idea if you're riding with the Thief OG's on this heist!
💬 Drop a comment — bullish, bearish, or just here for the vibes?
🔔 Follow Thief Trader so you never miss the next job briefing!
⚖️ DISCLAIMER
Dear Ladies & Gentleman (Thief OG's), i'am not recommended to set only my TP/SL. its your own choice you can make money then take money at your own risk.
#AUDCAD #ForexTrading #AussieVsLoonie #ThiefTrader #ThiefOGs #ForexSignals #DayTrading #SwingTrading #PriceAction #TradingViewIdeas #RBA #BankOfCanada #ForexCommunity
EURUSD Reversal: Will It Crash Past the IDM Floor?Euro / U.S. Dollar is demonstrating strong structural distribution on the H1 timeframe successfully building a localized bearish reversal matrix away from its premium resistance block based on the technical layout in image_fed8c9.jpg.
Following a definitive defense of the macro upper baseline the immediate price action has cleared localized internal structures with aggressive downward expansion blocks and is now executing a highly efficient technical retest of the broken liquidity zone.
Global Context
The broader financial spectrum continues to navigate intense structural volatility forcing massive capital relocations between safe haven assets and premium dollar matrices ahead of key economic data releases.
Smart money has perfectly engineered this technical ceiling to trap overeager breakout buyers at the absolute market top before initiating a high velocity downward impulse wave.
This temporary upward correction behaves like a classic liquidity engineering mechanism pulling price action directly back into the 1.14450 1.14500 POI zone to mitigate institutional orders and capture early long stops before an aggressive supply wave expands straight toward Target 1 and Target 2.
Technical Playbook
The Bias Short Term Bearish Retest / Medium Term Structural Expansion we are strictly focused on tracking this dynamic supply ceiling to ride the multi stage downward delivery corridor.
The Main Horizons tactical execution focal points are locked directly on the 1.14450 1.14500 POI block and the 1.14200 IDM Target 1 liquidity array shown in image_fed8c9.jpg.
The Target Path following the structural layout price action is projected to surge into the lower POI first before executing a sharp secondary downward expansion leg straight through the IDM zone toward the primary premium demand floor at Target 2 where heavy historical buyers rest.
Invalidation the entire bearish reversal framework is instantly invalidated if the market breaks convincingly above the critical protection ceilings down through the upper structural POI block.
NZDUSD | Triple Supply Rejection on M15NZDUSD is testing a major daily supply zone after an extended move higher. Despite three separate attempts to break above this level, buyers have been unable to establish acceptance beyond the zone.
The lower time frame strengthens the bearish case. On the M15 chart, each rejection occurred as RSI reached the 70 level, showing that bullish momentum was unable to translate into a successful breakout. This repeated failure at a key area suggests the market may be preparing for a move lower.
I am looking for price to respect this supply zone and rotate toward the next significant demand area around 0.5657.
What I’m Watching
• Three consecutive rejections from the same supply zone.
• M15 RSI reaching overbought conditions on each test.
• Lack of follow through from buyers despite repeated attempts.
Trade Parameters
Entry:0.5857
Stop Loss: 0.5897
Target: 0.5657
If price closes decisively above the supply zone, this bearish idea is invalidated and I will reassess the market structure.
This analysis reflects my personal market view and is shared for educational purposes only. It is not financial advice.
USD/JPY Forex Opportunity | Ride the Trend, Protect the Profits🎯 THE HEIST PLAN — Bullish Robbery in Motion
🔓 Entry: OPEN ENTRY — YOU CAN ENTER AT ANY PRICE LEVEL, Thief OG's choice 🥷
🏦 THE VAULT (Targets):
🥈 Target 1 (First Loot): 163.200
🥇 Final Vault (Big Score): 163.500
🚨 POLICE FORCE ALERT (Resistance Zone):
The police are camping right near the vault — strong resistance + overbought conditions + potential trap + possible trend reversal zone. Smart thieves grab their bags and ESCAPE with profits before the sirens go off. Don't get greedy near the vault door 🚔💰
🔐 ESCAPE HATCH (Stop Loss): 161.800 — this is the Thief's Bullish Plan SL, your emergency exit if the heist goes sideways 🏃♂️💨
👀 RELATED PAIRS TO WATCH (Correlation Intel for Fellow Thieves)
💹 DXY (US Dollar Index)
🔗 USD/JPY is a dollar-driven pair — when DXY climbs, USD/JPY tends to follow the same trail. Watch DXY as your dollar-strength radar.
💹 EUR/JPY
🔗 Moves in tandem with USD/JPY through shared yen weakness — if EUR/JPY is also grinding higher, it confirms broad yen softness backing this heist.
💹 GBP/JPY
🔗 Another yen-cross confirming the theme — GBP/JPY strength alongside USD/JPY strength = yen is the common getaway car being chased across the board.
💹 EUR/USD
🔗 Inverse dollar-strength gauge — softness here often mirrors dollar firmness feeding into USD/JPY's climb.
📰 FUNDAMENTALS & ECONOMIC FACTORS (Neutral Market Read — No Bias)
🏛️ Bank of Japan: Lifted its policy rate from 0.75% to 1.00% at its June meeting (7-1 vote), the highest since 1995. Broad Policy Board support exists for continued gradual hikes as underlying inflation nears the 2% target, though no clear signal of another move before Q4.
🏛️ US Federal Reserve: Officials are in the blackout period ahead of next week's FOMC meeting, where rates are widely expected to stay unchanged. Market pricing on the next move has shifted modestly session to session.
🌍 Geopolitics: Reports point to possible ceasefire progress on Middle East tensions, a factor markets are actively weighing for its impact on energy prices and safe-haven flows.
💴 Yen dynamics: Japan reportedly spent roughly 11.7 trillion yen ($73.5B) on FX intervention in May, yet the yen weakened again afterward — intervention risk remains a live wildcard for this pair.
⚖️ Neutral read: policy divergence, ceasefire headlines, and intervention risk are live swing factors cutting both ways — not purely bullish.
⚠️ RISK FACTORS THAT COULD FLIP THE SCRIPT
🔸 Sudden yen-strength shock from verbal or actual BoJ/MOF intervention near multi-decade highs
🔸 Middle East ceasefire headlines easing safe-haven dollar demand
🔸 Any surprise/hawkish shift in Fed tone once blackout lifts
🔸 Rejection at the "police force" resistance zone triggering a sharp pullback
THIEF TRADER WISDOM
"A real thief never waits for permission — he reads the vault, respects the police, and escapes before the alarm rings." 🔥
"Greed opens the cell door. Discipline opens the vault." 💰🔓
📢 CALL TO ARMS, THIEF OG's!
👍 BOOST this idea if the heist plan speaks to you
💬 COMMENT your own vault targets below
➕ FOLLOW Thief Trader for the next big score 🥷📈
GBPUSD BULLISH TO $1.143From this video analysis, you'll see how I used my 'Elliott Wave Theory' strategy to analyse the GU market & predict the markets next move towards $1.143. We're not blindly buying as you'll see from the video that Wave 4 has not fully formed, which means Wave 5 is not yet ready for its bullish leg. Waiting on Wave E.
Confluences👇
⭕️Major Wave 1,2,3 Complete.
⭕️Wave 4 - A,B,C,D,E Sub-Waves in Formation.
⭕️Wave 4 Correction Triangle Forming.
EURAUD Will Grow! Long!
Take a look at our analysis for EURAUD.
Time Frame: 4h
Current Trend: Bullish
Sentiment: Oversold (based on 7-period RSI)
Forecast: Bullish
The market is trading around a solid horizontal structure 1.630.
The above observations make me that the market will inevitably achieve 1.639 level.
P.S
We determine oversold/overbought condition with RSI indicator.
When it drops below 30 - the market is considered to be oversold.
When it bounces above 70 - the market is considered to be overbought.
Like and subscribe and comment my ideas if you enjoy them!
Riding an Ascending Channel Until the Break?📊 EUR/USD Analysis | Riding an Ascending Channel Until the Break?
👋 Hello TradingView family! ❤️
Hope you're all having a profitable trading week. Today we're taking a look at one of the most important currency pairs in the Forex market: EUR/USD. Let's combine the bigger fundamental picture with the current 4-hour technical structure and see what the chart is telling us. 🚀
🌍 Fundamental Overview
The EUR/USD represents the exchange rate between the Euro and the US Dollar, making it the most liquid and heavily traded currency pair in the world. 💶💵
Its movements are primarily driven by:
📌 Monetary policy decisions from the European Central Bank (ECB) and the Federal Reserve (Fed)
📌 Inflation data (CPI)
📌 Interest rate expectations
📌 Employment reports (NFP)
📌 GDP growth and economic sentiment
📌 Geopolitical developments and global risk appetite
Currently, markets remain highly sensitive to every economic release, meaning volatility can increase significantly around major news events. Traders should always keep the economic calendar in mind before opening positions. 📰
📈 4H Technical Analysis
From a technical perspective, EUR/USD is currently trading inside a well-defined ascending channel. 📊
Although the higher-timeframe structure still favors sellers, the market has entered a corrective bullish phase, producing higher lows while respecting the lower boundary of the channel.
🟢 Bullish Scenario
If buyers continue defending the lower trendline and price manages to:
✅ Hold above the channel support
✅ Break the upper channel resistance
✅ Simultaneously break the nearby static resistance
then momentum could accelerate toward higher resistance levels, creating attractive long opportunities. 🚀
The strongest confirmation would come from a decisive breakout supported by strong bullish candles and increasing buying pressure.
🔴 Bearish Scenario
On the other hand...
If price loses the lower boundary of the ascending channel and simultaneously breaks the nearby horizontal support, the current bullish correction would likely be considered complete.
In that case, sellers could regain control and the market may resume its dominant higher-timeframe bearish trend. 📉
A confirmed breakdown would significantly increase the probability of another impulsive bearish leg.
⚖️ Trading Strategy
Rather than anticipating direction, this chart currently offers a classic breakout confirmation setup.
🔹 Break above both the dynamic and static resistance → Bullish continuation setup
🔹 Break below both the channel support and horizontal support → Bearish continuation setup
Waiting for confirmation instead of predicting direction can help filter out false breakouts and improve trade quality. 🎯
⚠️ Risk Management
Regardless of the direction, false breakouts are always possible around major technical levels.
📌 Wait for candle confirmation.
📌 Avoid chasing impulsive moves.
📌 Manage your risk with proper position sizing and predefined stop-loss levels.
Patience often pays more than speed. ⏳
📊 Community Poll
Which scenario do you think plays out first?
🟢 Price breaks the upper channel and continues higher.
🔴 Price loses channel support and resumes the higher-timeframe downtrend.
💬 Share your thoughts in the comments!
⚠️ Disclaimer
This analysis reflects my personal interpretation of the current market structure and is intended for educational purposes only. It should not be considered financial or investment advice. Always conduct your own analysis and apply proper risk management before entering any trade.
🏷️ Tags
#EURUSD #Forex #EURUSDAnalysis #TechnicalAnalysis #PriceAction #TradingView #ForexTrading #Support #Resistance #TrendChannel #Breakout #SwingTrading #MarketAnalysis #SmartMoney #RiskManagement
GBPUSD BULLISH TO $1.143 (VIDEO ANALYSIS)From this video analysis, you'll see how I used my 'Elliott Wave Theory' strategy to analyse the GU market & predict the markets next move towards $1.143. We're not blindly buying as you'll see from the video that Wave 4 has not fully formed, which means Wave 5 is not yet ready for its bullish leg. Waiting on Wave E.
Confluences👇
⭕️Major Wave 1,2,3 Complete.
⭕️Wave 4 - A,B,C,D,E Sub-Waves in Formation.
⭕️Wave 4 Correction Triangle Forming.
EUR/JPY Consolidates Beneath Range ResistanceEUR/JPY is trading within a well-defined daily range, with price currently positioned below the 186.30 resistance zone and above support near 183.50. Recent candles show repeated hesitation beneath the upper boundary, suggesting that the market has not yet established enough momentum for a sustained breakout.
The moving-average structure remains constructive. Price is holding near the rising 50-day SMA around 185.10 and remains above the 200-day SMA near 183.21. The 50-day average is also positioned above the 200-day average, supporting a moderately bullish medium-term bias despite the sideways price action.
Momentum indicators are broadly neutral. MACD remains slightly above the zero line, with the MACD line marginally above the signal line, indicating modest positive momentum rather than a strong trend. RSI is near 52, placing it close to the midpoint and confirming balanced conditions between buyers and sellers.
The 186.30 level remains the main resistance reference, while 183.50 forms the lower boundary of the current consolidation. Until price moves decisively beyond either side of this range, EUR/JPY appears neutral in the short term, with a mild bullish undertone supported by the rising moving averages.
-MW
GBPUSD — Step-by-Step Bullish DeliveryET = Engulf Target
TH = Target Hit
ML = Magnet Level
TRZ = Trap Zone
BS = Base Shoulder
FS = Final Shoulder
IBS = Ignore Base Shoulder
My overall expectation for GBPUSD remains bullish.
The schematic on the chart illustrates the path I currently expect price to follow rather than a fixed prediction.
Three potential reaction zones have been identified where I will be looking for bullish confirmations and possible long executions.
The plan is to move step by step with the market instead of anticipating every move.
If price delivers one of these opportunities with the expected structure and risk-to-reward, it could provide a high-quality execution.
If no new setup has been shared recently, it doesn't mean there is no plan.
It simply means price has not yet reached the areas where our execution model becomes valid.
Patience is part of the strategy.
Current analysis focuses on liquidity behavior, structural reactions, and step-by-step market delivery.
As precise as a Swiss watch.