GBPUSD 4H — Broken Trendline Retest, Watching 1.34818GBPUSD has moved below its rising support trendline and is testing it from underneath. Price also remains below 1.35363 and the descending resistance trendline, keeping my outlook cautiously bearish while these barriers hold.
🔴 Bearish scenario
A rejection from the broken rising trendline, followed by a break below the retest low, would support a move toward 1.34818.
• First support: 1.34818 — a potential bounce area.
• Next downside level: 1.34431.
• Further downside level: 1.34220.
Continuation toward the lower levels requires a confirmed break of 1.34818, ideally followed by a failed retest. The projected path on the chart illustrates a possibility; each support could interrupt the move.
Bearish invalidation: A sustained recovery above the rising trendline and 1.35363 would weaken the setup. Reclaiming the descending resistance trendline would further challenge the bearish view.
🟢 Bullish scenario
A 4H close above 1.35363 and the descending trendline would suggest improving momentum. A successful retest, followed by a break above the retest high, could open a recovery toward 1.3560–1.3570.
A return below the confirmed retest low would invalidate that bullish entry setup.
⚠️ Entry confirmation
This is not an immediate sell signal. Wait for the trendline retest to produce a clear rejection, then a break below its low. The exact trigger depends on the completed retest structure.
For a breakdown entry below 1.34818, wait for break → retest → break confirmation rather than selling directly into support.
If confirmation does not develop, there is no trade.
Style: SWING — 4H structure, potentially developing over several sessions. Levels are based on the attached chart; trendline values change over time.
This idea reflects my personal market view and is shared for educational purposes only. It is not a trading signal or financial advice. Always conduct your own analysis and manage your risk. GBPNZD 4H — Trendline Breakout, Watching 2.33127GBPNZD has moved above its descending resistance trendline, showing improving bullish momentum. However, price remains below the horizontal resistance at 2.33127 after testing that area. This is the next key barrier before a potential extension toward 2.35337.
🟢 Bullish scenario
I’m watching for a clear 4H close above 2.33127, followed by a successful retest that holds this level as support. A subsequent break above the retest high would confirm the entry condition.
• First upside obstacle: Around 2.34000.
• Main upside level: 2.35337, near the previous major high.
• Invalidation: A break below the confirmed retest low would invalidate that entry setup. A sustained return below 2.33127 would weaken the breakout.
The arrow on the chart illustrates a possible bullish path, conditional on confirmation.
🔴 Bearish scenario
If 2.33127 continues to reject price, watch the broken descending trendline around 2.3190–2.3200 for potential support.
A move back below that trendline would weaken the recovery and expose 2.31417. A confirmed break below 2.31417, followed by a failed retest and another break lower, could open a move toward 2.31000 and 2.30000, with the rising support trendline also an obstacle.
⚠️ Entry confirmation
This is not an immediate buy signal. The descending trendline break is constructive, but horizontal resistance still needs to be cleared.
Wait for break → retest → break confirmation. The exact trigger and invalidation depend on the retest structure. If confirmation does not develop, there is no trade.
Style: SWING — 4H structure, potentially developing over several sessions. Levels are based on the attached chart; trendline values change over time.
This idea reflects my personal market view and is shared for educational purposes only. It is not a trading signal or financial advice. Always conduct your own analysis and manage your risk. Buyers defend strong support?Aussie (AUD/USD) is falling towards the pivot, which is an overlap support that aligns with the 38.2% Fibonacci retracement and could bounce towards the 1st resistance, which is a pullback resistance.
Pivot: 0.7105
1st Support: 0.7007
1st Resistance: 0.7257
Disclaimer:
The opinions given above constitute general market commentary and do not constitute the opinion or advice of IC Markets or any form of personal or investment advice.
Any opinions, news, research, analyses, prices, other information, or links to third-party sites contained on this website are provided on an "as-is" basis, are intended to be informative only, and are not advice, a recommendation, research, a record of our trading prices, an offer of, or solicitation for, a transaction in any financial instrument and thus should not be treated as such. The information provided does not involve any specific investment objectives, financial situation, or needs of any specific person who may receive it. Please be aware that past performance is not a reliable indicator of future performance and/or results. Past performance or forward-looking scenarios based upon the reasonable beliefs of the third-party provider are not a guarantee of future performance. Actual results may differ materially from those anticipated in forward-looking or past performance statements. IC Markets makes no representation or warranty and assumes no liability as to the accuracy or completeness of the information provided, nor any loss arising from any investment based on a recommendation, forecast, or any information supplied by any third party.
Bullish bounce at Fib support?Cable (GBP/USD) is falling towards the pivot, which is a pullback support that lines up with the 61.8% Fibonacci retracement and the 78.6% Fibonacci projection and could bounce towards the pullback resistance.
Pivot: 1.3431
1st Support: 1.3290
1st Resistance: 1.3633
Disclaimer:
The opinions given above constitute general market commentary and do not constitute the opinion or advice of IC Markets or any form of personal or investment advice.
Any opinions, news, research, analyses, prices, other information, or links to third-party sites contained on this website are provided on an "as-is" basis, are intended to be informative only, and are not advice, a recommendation, research, a record of our trading prices, an offer of, or solicitation for, a transaction in any financial instrument and thus should not be treated as such. The information provided does not involve any specific investment objectives, financial situation, or needs of any specific person who may receive it. Please be aware that past performance is not a reliable indicator of future performance and/or results. Past performance or forward-looking scenarios based upon the reasonable beliefs of the third-party provider are not a guarantee of future performance. Actual results may differ materially from those anticipated in forward-looking or past performance statements. IC Markets makes no representation or warranty and assumes no liability as to the accuracy or completeness of the information provided, nor any loss arising from any investment based on a recommendation, forecast, or any information supplied by any third party.
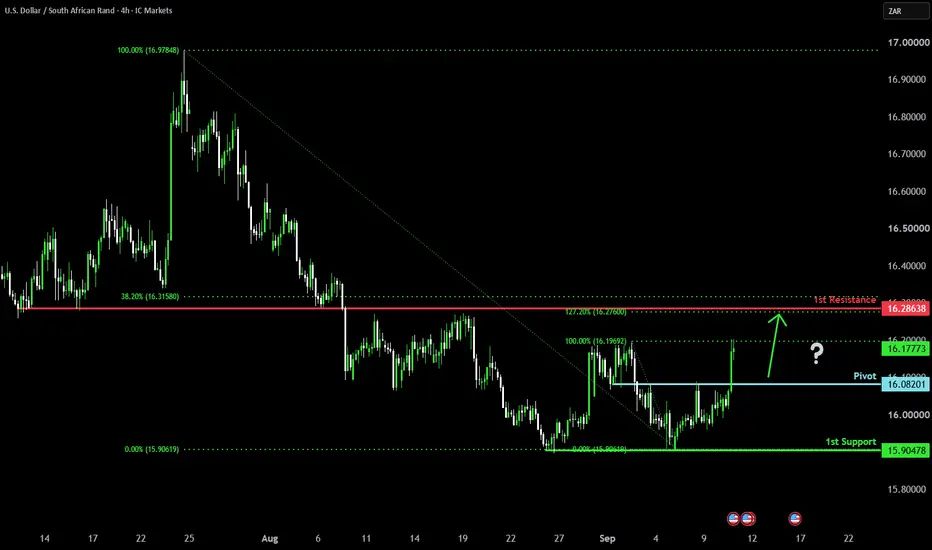
Bullish bounce setup?USD/ZAR is falling towards the pivot and could bounce towards the 1st resistance, which is an overlap resistance that lines up witht he 38.2% Fibonacci retracement.
Pivot: 16.08201
1st Support: 15.90478
1st Resistance: 16.28638
Disclaimer:
The opinions given above constitute general market commentary and do not constitute the opinion or advice of IC Markets or any form of personal or investment advice.
Any opinions, news, research, analyses, prices, other information, or links to third-party sites contained on this website are provided on an "as-is" basis, are intended to be informative only, and are not advice, a recommendation, research, a record of our trading prices, an offer of, or solicitation for, a transaction in any financial instrument and thus should not be treated as such. The information provided does not involve any specific investment objectives, financial situation, or needs of any specific person who may receive it. Please be aware that past performance is not a reliable indicator of future performance and/or results. Past performance or forward-looking scenarios based upon the reasonable beliefs of the third-party provider are not a guarantee of future performance. Actual results may differ materially from those anticipated in forward-looking or past performance statements. IC Markets makes no representation or warranty and assumes no liability as to the accuracy or completeness of the information provided, nor any loss arising from any investment based on a recommendation, forecast, or any information supplied by any third party. Bullish bounce setup?Loonie (USD/CAD) is falling towards the pivot and could bounce towards the 1st resistance.
Pivot: 1.3790
1st Support: 1.3760
1st Resistance: 1.3845
Disclaimer:
The opinions given above constitute general market commentary and do not constitute the opinion or advice of IC Markets or any form of personal or investment advice.
Any opinions, news, research, analyses, prices, other information, or links to third-party sites contained on this website are provided on an "as-is" basis, are intended to be informative only, and are not advice, a recommendation, research, a record of our trading prices, an offer of, or solicitation for, a transaction in any financial instrument and thus should not be treated as such. The information provided does not involve any specific investment objectives, financial situation, or needs of any specific person who may receive it. Please be aware that past performance is not a reliable indicator of future performance and/or results. Past performance or forward-looking scenarios based upon the reasonable beliefs of the third-party provider are not a guarantee of future performance. Actual results may differ materially from those anticipated in forward-looking or past performance statements. IC Markets makes no representation or warranty and assumes no liability as to the accuracy or completeness of the information provided, nor any loss arising from any investment based on a recommendation, forecast, or any information supplied by any third party. Bullish momentum to continue?Aussie (AUD/USD) is falling towards the pivot, which is a pullback support and could bounce towards the 1st resistance, which aligns with the 161.8% Fibonacci extension.
Pivot: 0.7201
1st Suport: 0.7167
1st Resistance: 0.7262
Disclaimer:
The opinions given above constitute general market commentary and do not constitute the opinion or advice of IC Markets or any form of personal or investment advice.
Any opinions, news, research, analyses, prices, other information, or links to third-party sites contained on this website are provided on an "as-is" basis, are intended to be informative only, and are not advice, a recommendation, research, a record of our trading prices, an offer of, or solicitation for, a transaction in any financial instrument and thus should not be treated as such. The information provided does not involve any specific investment objectives, financial situation, or needs of any specific person who may receive it. Please be aware that past performance is not a reliable indicator of future performance and/or results. Past performance or forward-looking scenarios based upon the reasonable beliefs of the third-party provider are not a guarantee of future performance. Actual results may differ materially from those anticipated in forward-looking or past performance statements. IC Markets makes no representation or warranty and assumes no liability as to the accuracy or completeness of the information provided, nor any loss arising from any investment based on a recommendation, forecast, or any information supplied by any third party.

Bearish reversal at 61.8% Fib resistance?Fiber (EUR/USD) is rising towards the pivot, which is a pullback resistance that aligns with the 23.6% and the 61.8% Fibonacci retracement and could reverse towards the 1st support, which is a pullback support.
Pivot: 1.1654
1st Support: 1.1572
1st Resistance: 1.1710
Disclaimer:
The opinions given above constitute general market commentary and do not constitute the opinion or advice of IC Markets or any form of personal or investment advice.
Any opinions, news, research, analyses, prices, other information, or links to third-party sites contained on this website are provided on an "as-is" basis, are intended to be informative only, and are not advice, a recommendation, research, a record of our trading prices, an offer of, or solicitation for, a transaction in any financial instrument and thus should not be treated as such. The information provided does not involve any specific investment objectives, financial situation, or needs of any specific person who may receive it. Please be aware that past performance is not a reliable indicator of future performance and/or results. Past performance or forward-looking scenarios based upon the reasonable beliefs of the third-party provider are not a guarantee of future performance. Actual results may differ materially from those anticipated in forward-looking or past performance statements. IC Markets makes no representation or warranty and assumes no liability as to the accuracy or completeness of the information provided, nor any loss arising from any investment based on a recommendation, forecast, or any information supplied by any third party.

 Short
Short