EURUSD Bears Are Taking ControlEURUSD is now showing a clearer short-term bearish bias, as both the macro backdrop and the H8 structure are increasingly favoring sellers. Expectations that the Fed could raise interest rates this week, following hotter-than-expected U.S. inflation data, continue to support the dollar, while EURUSD has already started weakening toward the 1.1570 area.
On the H8 timeframe, the bearish structure is becoming increasingly clear. Price has repeatedly been rejected from the descending trendline, forming lower highs, and has now moved below the Ichimoku Cloud. The failure of recent rebounds to reclaim the trendline suggests that buying pressure is fading, while sellers continue to control the upper area.
If EURUSD remains below the trendline and the Ichimoku Cloud, I expect selling pressure to extend toward 1.1527. A decisive break below this level could open the door for a deeper decline toward 1.1440–1.1480, in line with the support zone highlighted on the chart.
Overall, EURUSD currently looks more like a market losing bullish momentum than one preparing for an upside breakout. I prefer looking for SELL setups on rebounds with confirmation, rather than trying to catch the bottom while the short-term structure continues to favor sellers. EURUSD: Sellers Remain in Control as Pressure Builds Near SupporEURUSD is currently trading within a clear bearish structure , as both the macro backdrop and price action continue to favor sellers. The pair has already experienced a strong decline, and although price is now stabilizing near support, the current consolidation has not produced enough strength to suggest that the broader downtrend is coming to an end.
From a macro perspective, the U.S. dollar continues to hold the advantage ahead of the Federal Reserve’s policy decision. Markets are pricing a high probability of a 25-basis-point Fed rate hike , while elevated U.S. Treasury yields continue to support the dollar. The ECB has also tightened monetary policy, which provides some support for the euro, but so far this has not been enough to reverse the pressure on EURUSD. In the short term, Fed expectations and U.S. yields remain the stronger drivers.
Technically, EURUSD continues to respect the major descending trendline on the H4 timeframe . The broader sequence of lower highs remains intact, while price is still trading beneath the Ichimoku structure. More importantly, the latest decline has pushed EURUSD into the lower part of the structure, where price is now consolidating rather than producing a convincing bullish recovery. This suggests that selling pressure has slowed, but sellers have not lost control.
The 1.1560–1.1580 area is the most important resistance zone in the short term. A rebound into this region could attract renewed selling pressure, especially while price remains below the descending trendline. On the downside, 1.1515–1.1525 is the key support area. If this support breaks decisively, the current consolidation could develop into another bearish extension.
Overall, EURUSD remains in a controlled bearish phase . As long as price fails to break and hold above the immediate resistance structure, I would treat rebounds as technical pullbacks within the downtrend , rather than evidence that a bullish reversal has begun. EURUSD: If The FED Raises US Rates, SELL IT!Welcome back to the Weekly Forex Forecast for the week of Sep 14 - 18th.
In this video, we will analyze the following FX market: EURUSD
EURUSD has been moving sideways as it waits for the FED to determine the US Interest rates.
Geopolitical tensions, higher oil prices, and a resilient US Dollar continue to pose threats to upside momentum.
Should the US see a rate hike, look for the bears to show obvious control.
May profits be upon you.
Leave any questions or comments in the comment section.
I appreciate any feedback from my viewers!
Like and/or subscribe if you want more accurate analysis.
Thank you so much!
Disclaimer:
I do not provide personal investment advice and I am not a qualified licensed investment advisor.
All information found here, including any ideas, opinions, views, predictions, forecasts, commentaries, suggestions, expressed or implied herein, are for informational, entertainment or educational purposes only and should not be construed as personal investment advice. While the information provided is believed to be accurate, it may include errors or inaccuracies.
I will not and cannot be held liable for any actions you take as a result of anything you read here.
Conduct your own due diligence, or consult a licensed financial advisor or broker before making any and all investment decisions. Any investments, trades, speculations, or decisions made on the basis of any information found on this channel, expressed or implied herein, are committed at your own risk, financial or otherwise.

USDCHF: Best FX Chance For Buys With A FED Rate Hike!Welcome back to the Weekly Forex Forecast for the week of Sep 14 - 18th.
In this video, we will analyze the following FX market: USDCHF
The USD/CHF pair is leaning bullish this week as strong US consumer inflation data drives up expectations for a Federal Reserve rate hike. Couple that with the fact that The Swiss National Bank (SNB) is primarily focused on preventing excessive appreciation of the Swiss Franc (CHF) while maintaining a highly accommodative monetary policy.
If the FED raises rates, and the SNB keeps rates low as they try to fight inflationary pressures domestically, this is a great setting for buyers to push prices higher for this pair.
Enjoy!
May profits be upon you.
Leave any questions or comments in the comment section.
I appreciate any feedback from my viewers!
Like and/or subscribe if you want more accurate analysis.
Thank you so much!
Disclaimer:
I do not provide personal investment advice and I am not a qualified licensed investment advisor.
All information found here, including any ideas, opinions, views, predictions, forecasts, commentaries, suggestions, expressed or implied herein, are for informational, entertainment or educational purposes only and should not be construed as personal investment advice. While the information provided is believed to be accurate, it may include errors or inaccuracies.
I will not and cannot be held liable for any actions you take as a result of anything you read here.
Conduct your own due diligence, or consult a licensed financial advisor or broker before making any and all investment decisions. Any investments, trades, speculations, or decisions made on the basis of any information found on this channel, expressed or implied herein, are committed at your own risk, financial or otherwise. GBPUSD: Leaning Bearish Against US Dollar Strength! Welcome back to the Weekly Forex Forecast for the week of Aug 31 - Sep 4th.
In this video, we will analyze the following FX market: GBPUSD
The GBP/USD leans mixed to mildly bearish this week as renewed US Dollar strength clashes with short-term technical resistance. With the Fed looking to fight inflation in the US, the USD is seeing safe-haven inflows.
The BOE is also hawkish, and supportive of the currency. This is why the pair is ranging sideways.
However, it is drifting downward, as the bearish close to last week's candle shows.
Enjoy!
May profits be upon you.
Leave any questions or comments in the comment section.
I appreciate any feedback from my viewers!
Like and/or subscribe if you want more accurate analysis.
Thank you so much!
Disclaimer:
I do not provide personal investment advice and I am not a qualified licensed investment advisor.
All information found here, including any ideas, opinions, views, predictions, forecasts, commentaries, suggestions, expressed or implied herein, are for informational, entertainment or educational purposes only and should not be construed as personal investment advice. While the information provided is believed to be accurate, it may include errors or inaccuracies.
I will not and cannot be held liable for any actions you take as a result of anything you read here.
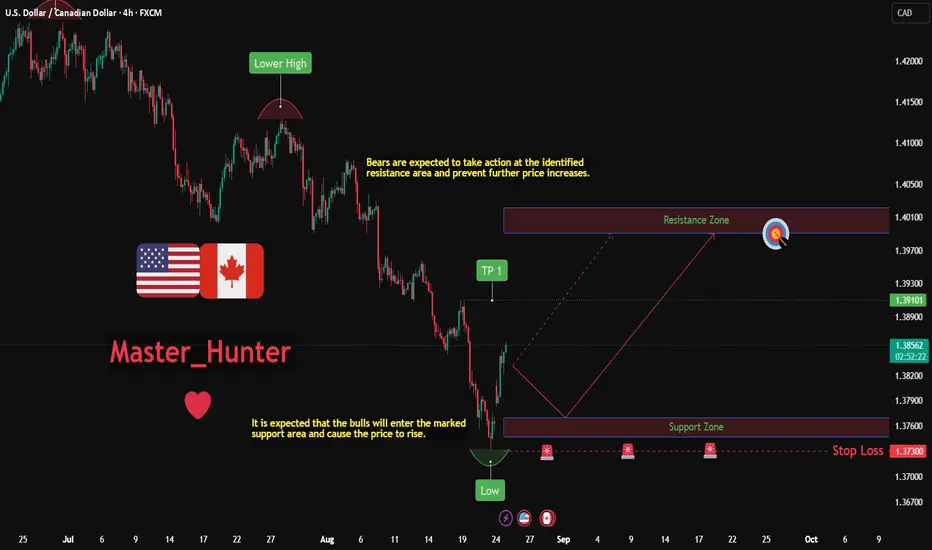
Conduct your own due diligence, or consult a licensed financial advisor or broker before making any and all investment decisions. Any investments, trades, speculations, or decisions made on the basis of any information found on this channel, expressed or implied herein, are committed at your own risk, financial or otherwise. USDCAD: Bullish Push to 1.399?FX:USDCAD is eyeing a bullish reversal on the 4-hour chart , with price testing a key support zone after recent lows, converging with a potential entry area that could ignite further upside momentum toward the higher resistance zone if buyers defend amid volatility. This setup suggests a solid rally opportunity with more than 1:5.5 risk-reward .🔥
Entry between 1.375–1.377 (entry from current price with proper risk management is recommended). Target at 1.399 . Set a stop loss at a daily close below 1.373 , yielding a risk-reward ratio of more than 1:5.5 . Monitor for confirmation via a bullish candle close above entry with rising volume, leveraging the pair’s strength near support.🌟
Fundamentally , USDCAD is trading around 1.386 in late August 2026.
For the US Dollar, the most important release this week (24–28 August) is the US Core PCE Price Index (July) on Wednesday, August 26 — the Fed’s preferred inflation gauge that can significantly influence dollar strength.
For the Canadian Dollar, a key event is the Canada GDP data (June / Q2) on Friday, August 28, which will provide critical insight into the health of the Canadian economy. 💡
📝 Trade Setup
🎯 Entry (Long):
1.375 – 1.377
(Entry from current price is acceptable with proper position sizing and strict risk management.)
🎯 Target:
1.399
❌ Stop Loss:
Daily candle close below 1.373
📈 Risk-to-Reward:
More than 1:5.5
💡 Will buyers defend 1.375–1.377 and drive USDCAD toward 1.399, or will sellers break support and invalidate the bullish setup? 👇
EURUSD: Bullish Push to 1.1700?FX:EURUSD is eyeing a bullish continuation on the 4-hour chart within the short-term uptrend, with price approaching a key support zone near the uptrend line after recent consolidation, converging with a potential entry area that could ignite further upside momentum toward the higher resistance zone if buyers defend amid volatility. This setup suggests a solid rally opportunity with close to 1:6 risk-reward .🔥
Entry between 1.1575–1.1585 (entry from current price with proper risk management is recommended). Target at 1.1700 . Set a s top loss at a daily close below 1.1566 , yielding a risk-reward ratio of close to 1:6 . Monitor for confirmation via a bullish candle close above entry with rising volume.🌟
Fundamentally , EURUSD is trading around 1.163 in early September 2026.
For the Euro, the most important event this week (7–11 September) is the ECB Interest Rate Decision on Thursday, September 10, which will set the tone for eurozone monetary policy.
For the US Dollar, the key release is the US Consumer Price Index (CPI) for August on Friday, September 11 — a major inflation report that can strongly influence Fed expectations and dollar strength. 💡
📝 Trade Setup
🎯 Entry (Short):
1.1575 - 1.1585
(Entry from current price is acceptable with proper position sizing and strict risk management.)
🎯 Target:
1.1700
❌ Stop Loss:
Daily close above 1.1566
📈 Risk-to-Reward:
Close to 1:6
Will buyers defend 1.1575-1.1585 and push EURUSDtoward 1.1700, or will the support fail and invalidate the bullish setup? 👇

 Long
Long