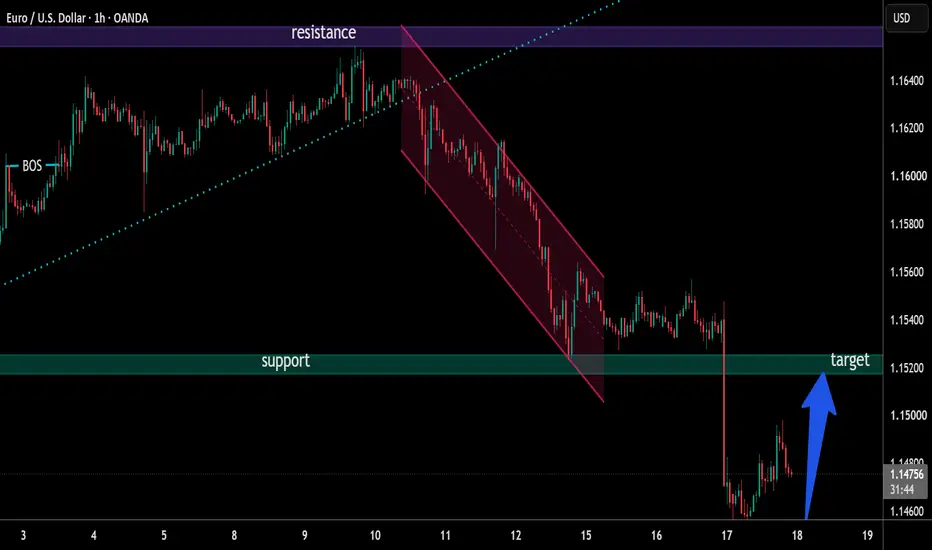
Key resistance ahead?EUR/CAD is rising to the resistance level, which acts as an overlap resistance and could reverse from this level to our take profit.
Entry: 1.60565
Why we like it:
There is an overlap resistance level.
Stop loss: 1.6114
Why we like it:
There is an overlap resistance level.
Take profit: 1.6013
Why we like it:
There is an overlap support level.
Enjoying your TradingView experience? Review us!
Please be advised that the information presented on TradingView is provided to Vantage (‘Vantage Global Limited’, ‘we’) by a third-party provider (‘Everest Fortune Group’). Please be reminded that you are solely responsible for the trading decisions on your account. There is a very high degree of risk involved in trading. Any information and/or content is intended entirely for research, educational and informational purposes only and does not constitute investment or consultation advice or investment strategy. The information is not tailored to the investment needs of any specific person and therefore does not involve a consideration of any of the investment objectives, financial situation or needs of any viewer that may receive it. Kindly also note that past performance is not a reliable indicator of future results. Actual results may differ materially from those anticipated in forward-looking or past performance statements. We assume no liability as to the accuracy or completeness of any of the information and/or content provided herein and the Company cannot be held responsible for any omission, mistake nor for any loss or damage including without limitation to any loss of profit which may arise from reliance on any information supplied by Everest Fortune Group.
Forex market
GBPUSDPotential long trade:
- 4hr, 1hr, 30 mins time frames are overall bullish ( trade with the trend )
- Creating HH & LHs
- CHOCH created followed by BOS
- Huge momentum shown from buyers indication buyers are in control
- wait for the pull back into our 4hr order block
- Once entered the order block we will then wait for a liquidity sweep of the Asia session lows, giving us another confluence that the market will target new highs.
- Bullish engulfing candles forming.
- Target is Daily highs but could potentially push for weekly highs.
GBP/USD - Bullish Structure HoldsThe higher-time-frame outlook remains bullish. Market structure continues to hold, with price taking out intermediate highs while preserving the overall bullish framework. No significant lows have been violated, keeping the trend intact and maintaining the objective of reaching higher-time-frame external liquidity.
From an intermediate perspective, price has mitigated key higher-time-frame points of interest, adding confluence to the bullish bias. Along the way, internal liquidity has been taken and new liquidity has been engineered, which is consistent with a healthy bullish structural leg rather than a reversal.
Going into the new week, I’m expecting price to first sweep the current internal liquidity before mitigating lower-time-frame points of interest beneath price. If those areas fail to hold, I’ll anticipate a deeper engineered pullback into a larger liquidity pool before looking for continuation toward the premium objective. Regardless of the depth, my higher-time-frame bias remains unchanged until structure is invalidated.
The lower time frames are also aligned with the higher-time-frame narrative. Rather than chasing price, I’m waiting for sell-side liquidity to be taken and lower-time-frame points of interest to be respected before looking for long opportunities.
One detail worth noting is that the previous higher-time-frame lower high (highlighted by the purple zone) has already been broken. That shift reinforces the expectation that price has reset its objective and is now positioned to seek new external liquidity.
Note: The purple zones represent higher-time-frame confluence areas and are included as additional structural reference points—not standalone entry signals.
For now, patience remains the edge. I’ll continue tracking liquidity, waiting for my confirmations, and allowing price to come into my areas of interest before considering execution.
Bearish drop off?AUD/CAD is rising towards the resistance level, which is an overlap resistance and could drop from this level to our take-profit.
Entry: 0.98160
Why we like it:
There is an overlap resistance level.
Stop loss: 0.98502
Why we like it:
There is a pullback resistance level.
Take profit: 0.97685
Why we like it:
There is a pullback support level.
Enjoying your TradingView experience? Review us!
Please be advised that the information presented on TradingView is provided to Vantage (‘Vantage Global Limited’, ‘we’) by a third-party provider (‘Everest Fortune Group’). Please be reminded that you are solely responsible for the trading decisions on your account. There is a very high degree of risk involved in trading. Any information and/or content is intended entirely for research, educational and informational purposes only and does not constitute investment or consultation advice or investment strategy. The information is not tailored to the investment needs of any specific person and therefore does not involve a consideration of any of the investment objectives, financial situation or needs of any viewer that may receive it. Kindly also note that past performance is not a reliable indicator of future results. Actual results may differ materially from those anticipated in forward-looking or past performance statements. We assume no liability as to the accuracy or completeness of any of the information and/or content provided herein and the Company cannot be held responsible for any omission, mistake nor for any loss or damage including without limitation to any loss of profit which may arise from reliance on any information supplied by Everest Fortune Group.
GBPUSD Outlook GBP/USD Outlook 📈
Price delivered an impulsive bullish expansion after respecting the higher timeframe demand zone, leaving behind a clean bullish FVG. My ideal scenario is a retracement into that imbalance, ideally sweeping Friday’s low first to engineer liquidity before continuation.
As long as the FVG holds, I’m expecting buyers to step back in and target the equal highs (EQH) resting around 1.3660, where significant buy-side liquidity is waiting.
Thesis:
* ✅ HTF demand respected
* ✅ Bullish displacement created a fresh FVG
* ✅ Friday’s low provides liquidity for a potential engineered retracement
* ✅ Buy-side liquidity (EQH) remains the primary objective
Patience over prediction. Let price deliver into the discount before looking for confirmation.
EUR/USD: Inflation cools, ECB in focusThe attention of investors at the U.S. market this week was on inflation data. As posted, the inflation rate ended June by dropping 0,4% compared to the previous month, while it holds 3,5% on a yearly basis. Figures came a bit lower from investors expectations of 0% m/m and 3,9% y/y. Core inflation was also below market expectations at 0% m/m and 2,6% y/y. The Producers Price Index in June dropped by -0,3% m/m, below market expectations of 0,1% m/m. Retail Sales in June were higher by 0,2% for the month, still modestly below the forecasted 0,5%. Building permits preliminary in June reached 1.367M, modestly below estimated 1.4M. At the same time Housing Starts in June at the level of 1.427M were above forecasts of 1.2M. The University of Michigan Consumer Sentiment preliminary for July reached 54.4 above estimated 50.4. Five year inflation expectations were without change from the previous estimates, at the level of 3,3%.
Wholesale prices in Germany in June dropped by -0,7% for the month, while still holding at 4,9% for the year. Figures were below market estimates. The industrial production in the Euro Zone in May dropped by -0,2% m/m/ and -1,2% y/y. Figures were significantly below market estimates.
The most significant weekly event is related to the surprising drop in the U.S. inflation in June. The currency pair reached the highest weekly level at 1,1482 prior to the publication of the inflation figures. Still, the week started at lower grounds, with the minimum weekly level at 1,1373. The week was closed at 1,1439. The RSI is trying to break the 50 level and take the road toward the overbought market side, however, the indicator is still holding around the 47 level. The MA50 continues to diverge from MA200, without an indication over a potential cross in the coming period.
For the last few weeks the currency pair has traded rather sideways, then exposing some trading trend. The support line at 1,14 continues to be tested, and it could be expected that the currency pair will stay around this level for another week. The catalyst for a stronger move might come around the FOMC meeting scheduled for the last week of this month. For the week ahead, ECB will discuss interest rates, with current market expectations of no change in rates at this meeting. On the other hand, the week ahead is not bringing any currently important macro data for the U.S. market, in which sense, the sideway trading might continue in a range between 1,14 and 1,15 resistance.
Important news to watch during the week ahead are:
EUR: Producers Price Index in Germany in June, ZEW Economic Sentiment Index for Germany in July, ECB will hold its regular meeting and discuss interest rates on Thursday, July 23rd, GfK Consumer Confidence in Germany for August, S&P Global Manufacturing PMI flash for July for Germany
USD: there is currently no important economic news scheduled for the week ahead for the U.S. market.
CAD-JPY Bullish Continuation Expected! Buy!
Hello,Traders!
CADJPY has broken above a horizontal demand area with a strong liquidity sweep and bullish displacement. A breakout retest could confirm continuation toward the next supply target. Time Frame 6H.
Buy!
Comment and subscribe to help us grow!
Check out other forecasts below too!
GBPUSD H1 | Demand Zone Reaction & Potential Bullish Reversal GBPUSD has reached a key demand zone after a strong bearish move and a clear break of structure (BOS). Price is currently reacting from the demand area, which could signal the beginning of a short-term bullish retracement
A successful hold above the demand zone may push price toward the marked rejection level around 1.3450. However, if the demand zone fails, further downside pressure could follow.
Key Areas:
Demand Zone: Current support area
Rejection Level: 1.3450
Market Structure: Bearish, awaiting confirmation
Scenario: Demand zone reaction → potential bullish retracement
Waiting for confirmation before considering any trade setup. This analysis is for educational purposes only and not financial advice.
GBP/CHF Bulls Defend Trendline Break 1.0880 Could Fuel RallyBias: Bullish Above Trendline
GBP/CHF is currently respecting a well-defined ascending trendline after a sharp pullback. Buyers stepped in at dynamic support, suggesting the recent decline may have been a liquidity sweep rather than a trend reversal. As long as price remains above the rising trendline, the bullish structure remains intact.
Key Technical Levels
Current Support: 1.0858–1.0862 (ascending trendline)
Major Demand Zone: 1.0832–1.0840
Immediate Resistance: 1.0880–1.0890
Major Resistance: 1.0910–1.0915
Bullish Scenario
A sustained hold above the ascending trendline could trigger another wave of buying. A break above 1.0880–1.0890 would likely confirm bullish continuation, opening the path toward the 1.0910–1.0915 resistance zone, where sellers may become active again.
Bearish Risk
If price closes decisively below the trendline, bullish momentum would weaken. In that case, GBP/CHF could retrace toward the 1.0832–1.0840 demand zone, where buyers may look to re-enter.
Trading Outlook
Bias: Bullish
Confirmation: Trendline holds and price breaks above 1.0880.
Invalidation: 30-minute candle closes below the ascending trendline.
Upside Target: 1.0910–1.0915
Downside Support: 1.0832–1.0840
EURCAD SHORTSMarket structure bearish on HTFs 3
Entry at both Weekly And Daily AOi
Weekly Rejection at AOi
Daily Rejection At AOi
Previous Daily Structure Point
Around Psychological Level 1.60500
H4 Candlestick rejection
Rejection from Previous structure
TP: WHO KNOWS!
Entry 105% TPT 120%
REMEMBER : Trading is a Game Of Probability
: Manage Your Risk
: Be Patient
: Every Moment Is Unique
: Rinse, Wash, Repeat!
: Christ is King
GBP/USD Bullish Reversal Setup After Weak Low SweepGBP/USD is approaching a key demand zone after a strong bearish impulse. The chart highlights a weak low around 1.3358, where liquidity may be swept before buyers step in. The projected scenario expects price to briefly dip into the liquidity pool, reclaim the support level, and initiate a bullish reversal toward the 1.3400–1.3410 resistance area.
AUDCAD Will Fall! Sell!
Hello,Traders!
AUDCAD is reacting from a horizontal supply area after sweeping buy-side liquidity. Expect sellers to defend this premium zone and push price toward the imbalance below. Time Frame 4H.
Sell!
Comment and subscribe to help us grow!
Check out other forecasts below too!
CAD/JPY 30M SMC Analysis: Bullish Retracement into Resistance BeThis 30-minute CAD/JPY chart illustrates a Smart Money Concepts (SMC) setup where price is expected to complete a short-term bullish retracement into a key resistance zone before continuing lower. Following a recent change in market structure, buyers may push price toward the 115.660–115.732 resistance area, where sell-side liquidity could be activated. If bearish confirmation appears, the next downside objective is the major support at 115.442
CAD/USD 1H SMC Analysis: Bearish Pullback Expected Before ContinThis 1-hour CAD/USD chart reflects a bearish Smart Money Concepts (SMC) structure following a clear change in character and sustained downside momentum. Price is currently trading around 0.7088, where a short-term relief rally into a nearby supply zone is possible before sellers regain control. The overall outlook remains bearish, with a projected move toward the key support at 0.7070
CHF/JPY (30-minute) AnalysisCHF/JPY (30-minute) Analysis
Trend: Neutral to slightly bearish.
Pattern: Price is trading inside a descending channel, with lower highs forming along the upper trendline.
Current Price: Around 200.70.
Key Levels
Resistance: 200.95–201.10 (upper trendline).
Support: 200.30, then 199.90 (lower trendline).
Trading Idea
Sell if price is rejected near 200.95–201.10.
Stop Loss: Above 201.20.
Take Profit: 200.30, then 199.90.
Alternative Scenario
If price breaks and closes above 201.10, the bearish channel is invalidated, and a move toward 201.40–201.60 becomes more likely.
Bias: Slightly bearish until a confirmed breakout above the descending trendline.
EUR/USD Smart Money Concept (SMC) Analysis: Short-Term Bullish RThis 15-minute EUR/USD chart highlights a Smart Money Concepts (SMC) market structure. Price is currently reacting from a weak low, suggesting the potential for a short-term bullish retracement toward the nearby liquidity zone around 1.1420–1.1425. After this corrective move, the primary bearish trend is expected to resume, targeting the major support near 1.13935.