Forex market
EUR/USD: news flow leaning bearish — the net read
EUR/USD did not get one story today, it got several, and they do not all point the same way. Weighed against each other — new against old, and tracking which ones have already faded:
−− With Fed credibility on the line, Warsh just delivered a hawkish answer
−− A stronger dollar and rising yields: How the Fed’s rate hike could hit global markets
−− Analysis-Fed builds credibility, but hawkish turn leaves investors edgy
74 stories were weighed in this window; the 3 carrying the most weight are listed.
Net read: −−− leaning bearish — top of our scale.
What this is: a measure of which way the *news* is leaning right now — not a promise about price. A read being right and a read still being worth taking are two different things: once price has travelled a long way from where the read was published, it is stretched, and a lean that is stretched is a no-chase rather than an invitation.
Weight is not fixed either. A fresh headline lands, the balance tips, and the net read can flip inside an hour — that shift is the part worth watching, not the first print.
I will post an update under this idea once the market has had time to speak, either way.
(Informational only — not financial advice, not a signal.)
USD/CHF: news flow leaning bullish — the net read
USD/CHF did not get one story today, it got several, and they do not all point the same way. Weighed against each other — new against old, and tracking which ones have already faded:
++ Swiss Franc remains near 16-month lows against US Dollar
++ Analysis-Fed builds credibility, but hawkish turn leaves investors edgy
++ With Fed credibility on the line, Warsh just delivered a hawkish answer
76 stories were weighed in this window; the 3 carrying the most weight are listed.
Net read: +++ leaning bullish — top of our scale.
What this is: a measure of which way the *news* is leaning right now — not a promise about price. A read being right and a read still being worth taking are two different things: once price has travelled a long way from where the read was published, it is stretched, and a lean that is stretched is a no-chase rather than an invitation.
Weight is not fixed either. A fresh headline lands, the balance tips, and the net read can flip inside an hour — that shift is the part worth watching, not the first print.
I will post an update under this idea once the market has had time to speak, either way.
(Informational only — not financial advice, not a signal.)
USD/CAD: Bullish Flag After the NewsAfter last night’s news and speeches, FX:USDCAD USD/CAD continued its previous bullish trend.
The move was strong, but since the Asian session, price has entered a period of consolidation and is now forming a Bullish Flag on the M15 timeframe.
For me, this is an important part of the setup.
A strong move followed by a controlled correction can create the conditions for another continuation. But the flag itself is not an entry signal.
I want the market to prove that buyers are still in control.
Trading Setup
Main Scenario — Bullish Continuation
I’m watching for a clean breakout from the upper boundary of the flag.
The preferred sequence is:
Breakout → Retest → Bullish Price Action → Entry
A strong breakout without a retest can still work, but chasing the first candle is not the approach I prefer.
If price breaks the flag and successfully holds the broken resistance as support, the continuation setup becomes more interesting.
Alternative Scenario
If the flag breaks to the downside and price starts accepting below the structure, the bullish continuation setup loses strength.
In that case, I would rather reassess the market than force a long position.
A corrective flag can become a reversal structure if buyers fail to defend it.
Why the Market Is Interesting Now
The latest move came after the Federal Reserve raised its policy rate by 25 basis points to 3.75%–4.00%. The decision initially strengthened the U.S. Dollar, with the Dollar reaching a seven-week high before giving back part of the move.
CXM:DOLLAR USD/ BMFBOVESPA:CAD1! CAD is also sensitive to oil because Canada is a major oil exporter. Recent weakness in oil prices has removed some support for the Canadian Dollar, while the Fed's more hawkish stance has supported the U.S. Dollar.
That gives us an interesting combination to watch:
Fed → USD strength
Oil → CAD strength/weakness
Price Action → Confirmation
The fundamental picture can support the directional idea, but the entry still comes from the chart.
My Approach
I don't want to buy simply because the trend is bullish.
I want to see the correction finish.
Bullish Flag
→ Breakout
→ Retest
→ Confirmation
If that sequence appears, the setup becomes much cleaner.
If the structure breaks down, we reassess.
The market has already made its move.
Now I want to see what it does with the consolidation.
Risk Warning: This analysis is for educational purposes only and is not financial advice. Forex trading involves substantial risk, particularly when leverage is used. Always define your risk before entering a position.
USD/CAD: news flow leaning bullish — the net read
USD/CAD did not get one story today, it got several, and they do not all point the same way. Weighed against each other — new against old, and tracking which ones have already faded:
++ Gold at $4,357 faces resistance wall in bearish regime: Live levels
++ Treasury yields move lower after Fed kicks off hiking cycle
+ Hawkish Fed lifts dollar to seven-week high; markets brace for BOE, BOJ
81 stories were weighed in this window; the 3 carrying the most weight are listed.
Net read: +++ leaning bullish — top of our scale.
What this is: a measure of which way the *news* is leaning right now — not a promise about price. A read being right and a read still being worth taking are two different things: once price has travelled a long way from where the read was published, it is stretched, and a lean that is stretched is a no-chase rather than an invitation.
Weight is not fixed either. A fresh headline lands, the balance tips, and the net read can flip inside an hour — that shift is the part worth watching, not the first print.
I will post an update under this idea once the market has had time to speak, either way.
(Informational only — not financial advice, not a signal.)
USDCHF Price Forecast: Potential Advance Toward 0.8291USDCHF Price Forecast: U.S. Dollar / Swiss Franc Breaks Above 1 (100%) Arc | Potential Advance Toward 0.8291
Market Outlook
Price has broken above the 1 (100%) Resistance Arc, confirming a bullish breakout within the current Arc Cycle.
A sustained breakout above the Resistance Arc supports continued movement toward 0.8291 price. Conversely, a sustained 2h close back below 0.8240 would weaken the breakout scenario and could shift the outlook back toward the previous Support Arc.
Buy NZD/CAD after next Break of Structure.NZD has been sold aggressively and I think now is over done. Many crosses are at the bottom of recent ranges and a correction is overdue. I am therefore buying this pair NZD/CAD on the next Break of Structure and hopefully a spike into my buy limit. Profit will be 38.2% Fib level retracement or first cluster support.
Buy Limit : 0.7975 (spike after BOS)
Stop : 0.7919
Profit : 0.8088 38.2% Fib retracement
Risk 1 : 2 / stop is 56 pips
EURCAD: Bearish Drop to 1.5943?FX:EURCAD is eyeing a bearish reversal on the 4-hour chart , with price approaching a clear resistance zone near the downward trendline and the 0.786 Fibonacci level after recent recovery, converging with a potential entry area that could trigger further downside momentum if sellers defend amid volatility. This setup suggests a solid pullback opportunity toward the lower support zone with 1:4.5 risk-reward. 🔥
Entry between 1.6145–1.6165 . Target at 1.5943 . Set a stop loss at a daily close above 1.6190 , yielding a risk-reward ratio of 1:4.5 . Monitor for confirmation via a bearish candle close below entry with rising volume.🌟
Fundamentally, EURCAD is trading around 1.6059 in mid-September 2026.
For the Euro, the most important release this week (ending 18 September) is the Eurozone Final CPI (August) on Thursday, September 17.
For the Canadian Dollar, key data includes the Canada IPPI and RMPI (Producer Price Indexes) also on Thursday, September 17. 💡
📝 Trade Setup
🎯 Entry (Short):
1.6145–1.6165
🎯 Target:
1.5943
❌ Stop Loss:
Daily close above 1.6190
📉 Risk-to-Reward:
1:4.5
Will sellers defend the 1.6145–1.6165 resistance zone and push EURCAD toward 1.5943, or will buyers break above the trendline and invalidate the bearish setup? 👇
EUR/USD Watching the RetracementEUR/USD just printed a strong bearish displacement from the 1.1535 area, breaking through the previous intraday structure.
Price is now retracing from the 1.1458–1.1460 low. I’m watching 1.1497 as the first resistance. A rejection there would keep the bearish structure intact and could open the door for another move lower.
If buyers reclaim and hold above 1.1497, I’d look toward 1.1525–1.1535, where the selloff originated.
🔴 BEARISH BIAS
Major zone: 1.1525–1.1535
GBP/USD | What comes next?Same as EURUSD, GBPUSD also experienced a massive drop following the FOMC statement, dropping heavily, going as low as 1.3369 and then recovering a bit, currently being traded at around 1.3395 level, in between the two 4H FVGs.
I expect GBPUSD to retest the 4H FVG from 1.3399 to 1.3427 and break above the 1.34 resistance, then going for the FVG C.E. at 1.3413. Considering the news coming out in an hour, and if it comes in favor of GBPUSD, I'd expect Cable to break above the C.E. and then go above the 1.3427 level.
However, if the news comes out not in favor of GBPUSD, further drop towards 1.3333 level is expected to sweep the liquidity pool there.
NZDCHF: Bearish Forecast & Bearish Scenario
The charts are full of distraction, disturbance and are a graveyard of fear and greed which shall not cloud our judgement on the current state of affairs in the NZDCHF pair price action which suggests a high likelihood of a coming move down.
Disclosure: I am part of Trade Nation's Influencer program and receive a monthly fee for using their TradingView charts in my analysis.
❤️ Please, support our work with like & comment! ❤️
EURGBP: Long Signal with Entry/SL/TP
EURGBP
- Classic bullish formation
- Our team expects pullback
SUGGESTED TRADE:
Swing Trade
Long EURGBP
Entry - 0.8566
Sl - 0.8563
Tp - 0.8571
Our Risk - 1%
Start protection of your profits from lower levels
Disclosure: I am part of Trade Nation's Influencer program and receive a monthly fee for using their TradingView charts in my analysis.
❤️ Please, support our work with like & comment! ❤️
EURUSD Short: Breakdown Below Supply Signals Further DownsideHello traders! Here’s my technical outlook based on the current EURUSD (4H) chart structure. EURUSD previously traded inside a descending channel before breaking higher and shifting bullish. Price then moved toward the 1.1720 Pivot Point, where sellers rejected the upside and pushed price lower.
Currently, EURUSD is trading below the 1.1570 Supply Zone while holding above the 1.1480 Demand Zone and ascending Demand Line. The recent breakout failure below supply suggests sellers may continue to push price lower.
As long as EURUSD remains below the 1.1570 Supply Zone and respects the bearish structure, the bearish scenario remains valid. A successful continuation lower could push price toward the 1.1480 Demand Zone (TP1). However, a breakout and close above 1.1570 would weaken the bearish outlook and increase the possibility of further upside. Manage your risk!
USDJPY Pullback Setup | Resistance Rejection (1H)
USDJPY has been moving within a rising channel and recently pushed into the 156.40–156.60 resistance zone, where price faced rejection. The current move is a pullback toward the first support area, while the broader channel structure remains important.
🟥 Resistance Zone: 156.40–156.60
🟦 First Support Objective: 154.90–155.00
🟦 Key Support Objective: 153.20–153.30
📊 Bias: Pullback within a broader rising structure.
A sustained hold around 154.90–155.00 could allow buyers to attempt another move toward the 156.40–156.60 resistance area. A decisive break below the first support would shift attention toward the 153.20–153.30 zone.
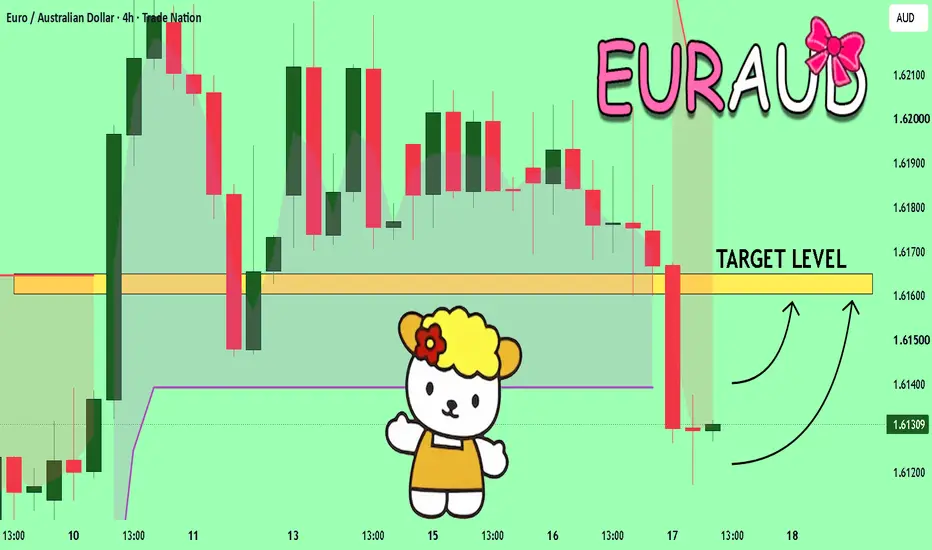
EURAUD Will Explode! BUY!
My dear followers,
I analysed this chart on EURAUD and concluded the following:
The market is trading on 1.6130 pivot level.
Bias - Bullish
Technical Indicators: Both Super Trend & Pivot HL indicate a highly probable Bullish continuation.
Target - 1.6160
About Used Indicators:
A super-trend indicator is plotted on either above or below the closing price to signal a buy or sell. The indicator changes color, based on whether or not you should be buying. If the super-trend indicator moves below the closing price, the indicator turns green, and it signals an entry point or points to buy.
Disclosure: I am part of Trade Nation's Influencer program and receive a monthly fee for using their TradingView charts in my analysis.
———————————
WISH YOU ALL LUCK
EURUSD: Key Support Retest Could Open the Way Toward 1.1580Hello everyone, here is my breakdown of the current EURUSD setup.
Market Analysis
EURUSD previously traded inside a descending structure before breaking higher and shifting bullish. Price then formed a range before breaking above the Resistance Zone and moving toward the highs. After reaching the upper levels, price pulled back and returned toward the Support Zone.
Currently, EURUSD is trading below the 1.1580 Resistance Zone while holding above the 1.1520 Support Zone and ascending Trend Line. The recent pullback into support suggests buyers may attempt another move higher.
My Scenario & Strategy
As long as EURUSD remains above the 1.1520 Support Zone and respects the ascending Trend Line, the bullish scenario remains valid. A successful rebound could push price back toward the 1.1580 Resistance Zone (TP1).
However, a breakdown and close below 1.1520 would weaken the bullish outlook and increase the possibility of further downside.
That’s the setup I’m tracking. Thank you for your attention, and always manage your risk.