AUDJPY Bulls Take Control After Flag BreakoutAUDJPY Bulls Take Control After Flag Breakout
Yesterday, during the US market open, AUDJPY aggressively broke out of this clear bullish flag pattern confirming further growth and the price has not stopped so far.
However, it is not the best price position to enter this trade now. If you have it open, you can hold it as it could rise further to 1.1420 or even higher to 1.1470.
A better way to enter this trade is if it moves back down near the 1.1290 - 1.1300 support area and from there we can see long trading opportunities.
Key Targets:
1.1350
1.1420
1.1470
You can find more details on the chart.
Thank you and good luck! 🍀
⚠️PS: Do your own analysis and use your own strategy to join the trade.
❤️ If this analysis helps your trading day, please support it with a like or comment ❤️
Forex market
CHFTHB Tracks Risk SentimentMarket Analysis : CHFTHB is expected to trade with a steady-to-slightly-bullish bias. With no major Swiss macroeconomic data scheduled for release today, the Swiss Franc remains highly dependent on global market sentiment, safe-haven demand, and geopolitical developments. In particular, intensifying tensions in the Middle East continue to act as a significant tailwind, driving defensive flows into the CHF as a preferred safe-haven asset. However, the pair’s short-term fluctuations will remain sensitive to cross-currency dynamics via CHFUSD and USDTHB, especially ahead of high-impact US economic data tonight. On the domestic front, a positive opening in the Thai stock market this morning presents a tactical, short-term downside risk.
Technical Outlook: Bullish Bias. The technical outlook preserves a solid bullish framework, characterized by a persistent sequence of Higher Highs (HH) and Higher Lows (HL) with price action holding securely above both major EMA lines. Although the price has recently entered a localized sideways consolidation just beneath immediate horizontal resistance at 41.77 (Resistance 1), the absence of any structural bearish reversal signals keeps buyers in control of the primary trend. A decisive breakout and close above 41.77 will unlock the next extension toward the 41.80–41.85 target zone. On the downside, failure to clear 41.77 could spark near-term profit-taking, dragging the price to retest the 41.66–41.61 support cluster. A structural breach below 41.61 would indicate fading buying momentum, increasing the risk of a deeper technical correction.
Support : 41.66 – 41.61
Resistance : 41.77
Target : 41.80 – 41.85
Cut Loss : 41.60
GBPTHB Awaits UK GDPMarket Analysis: GBPTHB is expected to trade within a steady-to-bullish range. Markets are highly focused on a crucial UK data dump today, including May GDP, Industrial Production, and Trade Balance figures. Solid economic outcomes will strengthen the UK growth outlook, reinforcing expectations that the Bank of England will pursue a highly cautious, measured approach toward monetary easing, providing systemic support for the Sterling. Nevertheless, near-term price rotations will remain highly tied to broader USD trends post-US economic data tonight. A positive opening in the Thai stock market also introduces an immediate localized downside risk.
Technical Outlook: Bullish Bias / Overextended Risk. The short-term trend exhibits a solid Sideway Up to Bullish posture, validated by a strong upward run and consecutive Higher Highs (HH) above both key EMA lines. While the structural backdrop is firmly in favor of buyers, the price has recently paused near immediate horizontal resistance at 45.47 (Resistance 1). Furthermore, the RSI is currently trading at highly elevated levels, flagging a prominent risk of a technical mean-reversion or profit-taking pullback. A clean daily breakout above 45.47 will open the next target cluster at 45.54–45.60. However, if the price rejects 45.47, expect a retracement toward the 45.38 support base. A breach below this support will signal a near-term trend exhaustion, risking a deeper correction into the 45.31–45.28 demand zone.
Support : 45.38
Resistance : 45.47
Target : 45.54 – 45.60
Cut Loss : 45.36
AUDTHB Holds Bullish BiasMarket Analysis: AUDTHB is projected to trade with a steady-to-bullish bias. Australia’s July Melbourne Institute Inflation Expectations cooled significantly to 4.7% (down from 5.5%), indicating that consumer inflation anxieties are easing. This could lessen the pressure on the RBA to maintain a highly aggressive monetary stance, potentially capping the AUD’s independent upside. Consequently, the pair’s trajectory will remain highly sensitive to broader cross-currency correlations via AUDUSD and USDTHB, especially given tonight’s high-impact US economic data releases. A positive opening in the Thai stock market also presents a tactical downside risk.
Technical Outlook : Bullish Bias. The primary technical framework remains bullish as the pair records consecutive higher price extensions and holds structurally above its key EMA lines. The price has entered a sideways consolidation pattern right against immediate horizontal resistance, heavily supported by a dense cluster within the Volume Profile. Price action is currently testing the 23.54 resistance level; a successful breakout and weekly close above this boundary will unlock further extensions toward the 23.57–23.60 target zone. However, if the 23.54 level holds as local supply, short-term profit-taking could drive a retracement to retest the 23.46–23.42 support pocket. A failure to defend the 23.42 level will signal deteriorating buying momentum, exposing the deeper structural supports at 23.38–23.35.
Support : 23.46 – 23.42
Resistance : 23.54
Target : 23.57 – 23.60
Cut Loss : 23.41
EURTHB Eyes Eurozone Trade DataMarket Analysis: EURTHB is poised to trade with a steady-to-bullish undertone in the short term. A softer DXY index dropping to 100.35 allowed EURUSD to advance, providing a direct positive spillover effect for EURTHB. Today, the market turns its attention to the Eurozone’s May Trade Balance data; a stronger-than-expected print will further validate regional economic resilience and boost the Euro. Nonetheless, the primary volatility driver will stem from the impending top-tier US macroeconomic data releases tonight, which will steer broad US Dollar and EURUSD dynamics. Locally, a weak start in the Thai equity market serves as an additional supportive tailwind.
Technical Outlook: Bullish Bias. The chart layout remains structurally bullish, maintaining its position above the key EMA lines following a clear Break of Structure (BOS). Price action is currently consolidating just beneath a crucial horizontal resistance at 38.55, indicating a healthy accumulation phase prior to the next directional breakout. The RSI sits at 66, confirming that buyers retain immediate control despite approaching the Overbought threshold. The MACD is securely positioned above its signal line, though a flattening histogram points to a minor deceleration in short-term velocity. A decisive break above 38.54–38.55 opens the path toward the 38.58–38.60 targets. Conversely, failure to clear this barrier will likely induce profit-taking, risking a pullback into the 38.51–38.49 support range. A violation of the 38.49 level will indicate a weakening trend and open the door for a short-term correction.
Support : 38.51 – 38.49
Resistance : 38.54 – 38.55
Target : 38.58 – 38.60
Cut Loss : 38.48
USDTHB Eyes Key US DataUSDTHB maintains a steady-to-bullish bias in the short term. Even though the June US PPI cooled to 5.5% YoY (below the 6.2% consensus), the US Dollar staged a resilient recovery fueled by intensifying US-Iran geopolitical frictions. Rising defense concerns surrounding the Strait of Hormuz—a vital global oil chokepoint—sparked safe-haven flows into the greenback. Tonight, market focus shifts to a heavy US data slate including Retail Sales, the Philadelphia Fed Manufacturing Index, and Initial Jobless Claims. Stronger-than-expected metrics will likely push the dollar higher by dampening Fed rate cut expectations, whereas a negative opening in the Thai stock market provides direct localized support for the pair.
Technical Outlook: Sideway Up. The short-term price structure preserves a positive trajectory, trading comfortably above the short-term EMA line and its established ascending trendline. The RSI hovers around 53, maintaining a foothold in bullish territory, while the MACD signals an influx of fresh buying interest as its histogram edges back into the positive zone. A decisive consolidation above the 33.60–33.62 resistance cluster will confirm the bullish scenario, paving the way for a continuation toward the 33.64–33.67 targets. However, if the price fails to breach 33.62, short-term profit-taking may prompt a mild retracement to the 33.58–33.56 support zone. A structural break below 33.56 would flag fading bullish conviction, risking a deeper slide toward 33.53.
Support : 33.58 – 33.56
Resistance : 33.60 – 33.62
Target : 33.64 – 33.67
Cut Loss : 33.55
BullThe market is in an overall up trend right now. So I'm watching to see if it breaks balance go into a sell go into my demand zone , wait for a reaction then buy it back up. As of July 18th I noticed that i'm not really good at sells YET. So if I was confident I would sell all the way until my demand zone but I'm not quite there yet.
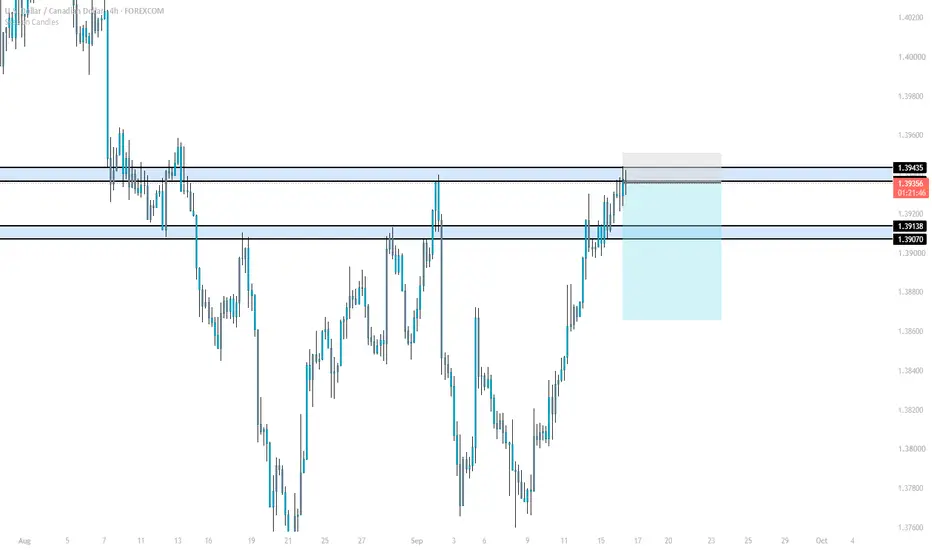
USDCAD: Bearish channel remains in control; target 1.4020USDCAD maintains a clear bearish structure on the H4 timeframe, with the price consistently forming lower highs and moving steadily within a downward-sloping channel. A recent strong sell-off pushed the price toward the channel's lower boundary, indicating that sellers remain in control.
Currently, the price may experience a technical rebound from the lows. However, the 1.4110–1.4120 zone represents a confluence of the bearish trendline, horizontal resistance, and the Ichimoku Cloud; thus, any bounce is likely just a retest before selling pressure resumes.
The fundamental backdrop also weighs on USDCAD, as the USD faces pressure following cooling US inflation data, while oil prices remain supportive of the CAD. This reinforces the likelihood that rallies in the pair will be met with selling.
If the price fails to break above 1.4120, the downtrend could extend toward the channel's lower boundary near 1.4020.
Suggested strategy: Look to SELL on a rebound to the 1.4100–1.4120 zone if a rejection signal appears. Target: 1.4020; the bearish scenario is invalidated if the price closes clearly above the bearish channel on the H4 timeframe.
USDCHF DROPPINGUSD/CHF is showing signs of a potential bearish reversal after failing to sustain its move near the upper trendline resistance. Price has broken below the rising trendline and is now retesting a key support-turned-resistance area, where sellers appear to be regaining control. If bearish momentum continues, the pair could decline toward the highlighted demand zones around 0.7950 and 0.7900 in the coming sessions. A confirmed rejection from the current resistance area would strengthen the bearish outlook, while a move back above the trendline would invalidate this scenario.
GBPUSD UPDATEGBP/USD has broken above the descending channel, signaling a potential shift in market structure as buyers regain control. Price is now holding above the breakout level, and a successful retest of the highlighted demand zone could provide the foundation for another bullish move. If buying momentum continues, the pair could target the next resistance area around 1.3600–1.3650 in the coming sessions. As long as price remains above the demand zone, the overall outlook stays bullish with potential for further upside.
Sell GBP/USD just before last weeks high.I sold this pair last week but closed it today for a small profit because price action went deep into my stop zone. Now I will sell again higher. Since the war with Iran seems to be escalating again now seems the time to start looking for USD strength. The GBP/USD showed some nice gains last week but as we approach all the Daily MAs I believe momentum will slow down before the bearish trend continues. My target is equal lows at 1.2947 although I will take profit just before at 1.3015 Nov 25 lows.
Sell Limit : 1.3430 before last weeks high
Stop : 1.3534 above SMAs
Profit : 1.3015 equal November 25 lows
Risk 1 : 4 / stop is 104 pips
AUDUSD Wave Analysis – 15 July 2026- AUDUSD broke resistance level 0.6960
- Likely to rise to resistance level 0.7050
AUDUSD currency pair recently broke resistance level 0.6960 (which stopped earlier minor impulse wave i) interesting with the 50% Fibonacci correction of the downward impulse from June.
The breakout of the resistance level 0.6960 continues the active short-term impulse wave 1 of the impulse sequence (1) from June.
AUDUSD cryptocurrency can be expected to rise to the next resistance level 0.7050, forecast price for the completion of the active impulse wave 3.
Selling pressure increasing?EUR/NOK has rejected off the pivot, which has been identified as a pullback resistance, and could drop towards the 1st suport which has been identified as an overlap support.
Pivot: 11.09680
1st Support: 10.98852
1st Resistance: 11.17379
Disclaimer:
The opinions given above constitute general market commentary and do not constitute the opinion or advice of IC Markets or any form of personal or investment advice.
Any opinions, news, research, analyses, prices, other information, or links to third-party sites contained on this website are provided on an "as-is" basis, are intended to be informative only, and are not advice, a recommendation, research, a record of our trading prices, an offer of, or solicitation for, a transaction in any financial instrument and thus should not be treated as such. The information provided does not involve any specific investment objectives, financial situation, or needs of any specific person who may receive it. Please be aware that past performance is not a reliable indicator of future performance and/or results. Past performance or forward-looking scenarios based upon the reasonable beliefs of the third-party provider are not a guarantee of future performance. Actual results may differ materially from those anticipated in forward-looking or past performance statements. IC Markets makes no representation or warranty and assumes no liability as to the accuracy or completeness of the information provided, nor any loss arising from any investment based on a recommendation, forecast, or any information supplied by any third party.
Bearish drop off?CAD/CHF could rise toward the pivot, which acts as a pullback resistance, and could reverse towards the 1st support, which has been identified as a pullback support that aligns with the 50% Fibonacci retracement.
Pivot: 0.57413
1st Support: 0.57121
1st Resistance: 0.57718
Disclaimer:
The opinions given above constitute general market commentary and do not constitute the opinion or advice of IC Markets or any form of personal or investment advice.
Any opinions, news, research, analyses, prices, other information, or links to third-party sites contained on this website are provided on an "as-is" basis, are intended to be informative only, and are not advice, a recommendation, research, a record of our trading prices, an offer of, or solicitation for, a transaction in any financial instrument and thus should not be treated as such. The information provided does not involve any specific investment objectives, financial situation, or needs of any specific person who may receive it. Please be aware that past performance is not a reliable indicator of future performance and/or results. Past performance or forward-looking scenarios based upon the reasonable beliefs of the third-party provider are not a guarantee of future performance. Actual results may differ materially from those anticipated in forward-looking or past performance statements. IC Markets makes no representation or warranty and assumes no liability as to the accuracy or completeness of the information provided, nor any loss arising from any investment based on a recommendation, forecast, or any information supplied by any third party.
Bullish momentum to extend?AUD/CHF is falling towards the pivot, which is a pullback support and could bounce towards the 1st resistance, which is a pullback resistance.
Pivot: 0.56112
1st Support: 0.55926
1st Resistance: 0.56600
Disclaimer:
The opinions given above constitute general market commentary and do not constitute the opinion or advice of IC Markets or any form of personal or investment advice.
Any opinions, news, research, analyses, prices, other information, or links to third-party sites contained on this website are provided on an "as-is" basis, are intended to be informative only, and are not advice, a recommendation, research, a record of our trading prices, an offer of, or solicitation for, a transaction in any financial instrument and thus should not be treated as such. The information provided does not involve any specific investment objectives, financial situation, or needs of any specific person who may receive it. Please be aware that past performance is not a reliable indicator of future performance and/or results. Past performance or forward-looking scenarios based upon the reasonable beliefs of the third-party provider are not a guarantee of future performance. Actual results may differ materially from those anticipated in forward-looking or past performance statements. IC Markets makes no representation or warranty and assumes no liability as to the accuracy or completeness of the information provided, nor any loss arising from any investment based on a recommendation, forecast, or any information supplied by any third party.
AUDCAD FREE SIGNAL|SHORT|
✅AUDCAD sell-side liquidity rests above the supply level, where ICT expects rejection. A bearish displacement from this premium zone could drive price toward the next discount objective.
—————————
Entry: 0.9842
Stop Loss: 0.9852
Take Profit: 0.9828
Time Frame: 2H
—————————
SHORT🔥
✅Like and subscribe to never miss a new idea!✅
Bullish continuation setup?NZD/CHF is falling toward the pivot and could bounce toward the 1st resistance.
Pivot: 0.46792
1st Support: 0.46585
1st Resistance: 0.47180
Disclaimer:
The opinions given above constitute general market commentary and do not constitute the opinion or advice of IC Markets or any form of personal or investment advice.
Any opinions, news, research, analyses, prices, other information, or links to third-party sites contained on this website are provided on an "as-is" basis, are intended to be informative only, and are not advice, a recommendation, research, a record of our trading prices, an offer of, or solicitation for, a transaction in any financial instrument and thus should not be treated as such. The information provided does not involve any specific investment objectives, financial situation, or needs of any specific person who may receive it. Please be aware that past performance is not a reliable indicator of future performance and/or results. Past performance or forward-looking scenarios based upon the reasonable beliefs of the third-party provider are not a guarantee of future performance. Actual results may differ materially from those anticipated in forward-looking or past performance statements. IC Markets makes no representation or warranty and assumes no liability as to the accuracy or completeness of the information provided, nor any loss arising from any investment based on a recommendation, forecast, or any information supplied by any third party.