NZDUSD | Triple Supply Rejection on M15NZDUSD is testing a major daily supply zone after an extended move higher. Despite three separate attempts to break above this level, buyers have been unable to establish acceptance beyond the zone.
The lower time frame strengthens the bearish case. On the M15 chart, each rejection occurred as RSI reached the 70 level, showing that bullish momentum was unable to translate into a successful breakout. This repeated failure at a key area suggests the market may be preparing for a move lower.
I am looking for price to respect this supply zone and rotate toward the next significant demand area around 0.5657.
What I’m Watching
• Three consecutive rejections from the same supply zone.
• M15 RSI reaching overbought conditions on each test.
• Lack of follow through from buyers despite repeated attempts.
Trade Parameters
Entry:0.5857
Stop Loss: 0.5897
Target: 0.5657
If price closes decisively above the supply zone, this bearish idea is invalidated and I will reassess the market structure.
This analysis reflects my personal market view and is shared for educational purposes only. It is not financial advice.
Forex market
GBP/CAD - Triangle Breakout in H1GBP/CAD is currently trading inside a symmetrical triangle, where price continues to produce lower highs while repeatedly testing the ascending trendline support. This tightening price action signals that volatility is compressing, and a significant breakout is approaching. Based on the current market structure, bearish momentum remains dominant, with sellers gradually gaining control after every recovery attempt.
The upper descending trendline continues to act as dynamic resistance, rejecting bullish momentum and preventing buyers from establishing a higher high. At the same time, the lower ascending trendline has been tested multiple times, weakening its strength. Repeated tests of support often reduce buying pressure, increasing the probability of a bearish breakdown.
A confirmed close below the triangle support would validate the bearish continuation pattern and could trigger a strong wave of selling. The projected downside move targets the highlighted Key Support Zone, where buyers may attempt to defend price. Until a confirmed breakout above the descending resistance occurs, rallies should be viewed as potential selling opportunities rather than trend reversals.
🔑 Key Levels
Immediate Resistance: Descending triangle resistance near 1.8890–1.8910
Triangle Support: Rising trendline around 1.8830–1.8845
Major Support / Demand Zone: 1.8700–1.8715 (Key Zone)
Bias: Bearish while price remains below the descending trendline.
📊 Technical Outlook
Bearish symmetrical triangle pattern.
Lower highs indicate sellers remain in control.
Multiple support retests increase the probability of a downside breakout.
Breakdown confirmation could accelerate selling toward the highlighted demand zone.
⚠️ Risk Management: Wait for a confirmed candle close below support before considering bearish continuation. Always use proper stop-loss placement and risk only 1–2% of your trading capital per position.
NZDUSD | Supply Holds, Bears Eye 0.5657NZDUSD has rallied into a major daily supply zone where price has now been rejected three times. Each attempt to break above this level has failed, suggesting sellers remain firmly in control.
The M15 chart provides additional confirmation. On all three tests of the supply zone, RSI pushed into the 70 overbought region while price failed to produce a sustained breakout. This divergence between momentum and price acceptance suggests buyers are losing strength as sell orders continue to absorb demand.
This setup is based on the confluence of a higher time frame supply zone, repeated rejection at resistance, and momentum confirmation from RSI. The RSI is not the reason for the trade. It simply supports the bearish bias already established by price action.
Trade Plan
Entry: Within the supply zone after bearish confirmation.
Stop Loss: Above the supply zone.
Target: 0.5657, which aligns with the next major demand area.
Invalidation
A strong daily close above the supply zone would invalidate this bearish outlook and suggest buyers have gained control.
Disclaimer: This analysis reflects my personal view of the market and is intended for educational purposes only. It is not financial advice.
Smart Money Eyes EUR/JPY | Bullish Momentum Continues🔥💰 EUR/JPY "GEPPY" HEIST BLUEPRINT 💰🔥
🚨 BULLISH VAULT RAID | Day/Swing Trade Setup | Thief Trader Exclusive 🚨📈
👋 Dear Ladies & Gentleman (Thief OG's) — the vault door is cracked open on GEPPY and the crew is moving in! Here's today's blueprint 🗺️💼
━━━━━━━━━━━━━━━━━━━━
🎯 THE HEIST PLAN — BULLISH 🎯
━━━━━━━━━━━━━━━━━━━━
🔓 ENTRY: You can enter at any price level as your own — the crew doesn't wait for permission 😈
🏦 THE VAULT (Final Target): @ 187.500
Police force 🚔 (strong resistance) is stacked here — overbought conditions + trap risk + potential trend-change zone. Kindly grab the loot and escape with profits before the sirens go off!
💵 Day Trader Quick Grab (TP1): @ 187.000
📝 Note: Dear Ladies & Gentleman (Thief OG's), i'am not recommended to set only my TP. its your own choice you can make money then take money at your own risk.
🚪 ESCAPE HATCH (Stop Loss): @ 184.700
📝 Note: Dear Ladies & Gentleman (Thief OG's), i'am not recommended to set only my SL. its your own choice you can make money then take money at your own risk.
━━━━━━━━━━━━━━━━━━━━
🔗 CORRELATED PAIRS TO WATCH 🔗
━━━━━━━━━━━━━━━━━━━━
💴 FX:USDJPY
The direct yen-strength gauge. Continued firmness above 162.00 signals broad JPY softness, which is the tailwind GEPPY's heist crew needs to keep climbing toward the vault.
💵 DXY (US Dollar Index)
The getaway car for the whole dollar bloc. A steady-to-firm DXY keeps yen crosses supported; a breakdown below 100.50 would be a warning flare for JPY bulls across the board.
💶 OANDA:EURUSD
The other half of the GEPPY engine. Since EUR/JPY = EUR/USD × USD/JPY, any bounce in EUR/USD stacks directly on top of yen weakness to fuel the run toward 187.500.
━━━━━━━━━━━━━━━━━━━━
🌍 FUNDAMENTALS & ECONOMIC FACTORS (Neutral Market Read) 🌍
━━━━━━━━━━━━━━━━━━━━
🏛️ Fed policy: Markets are pricing roughly a 55% chance of a September rate move, with Fed officials currently in blackout ahead of the upcoming FOMC meeting, where rates are widely expected to stay unchanged.
🏛️ ECB watch: Eurozone Economic Sentiment for July is expected to improve, and ECB policymaker commentary is on today's docket — a swing factor for EUR crosses.
🇯🇵 BoJ backdrop: Yen continues to trade on the soft side versus the dollar amid the long-running policy gap with the Fed, a structural factor behind USD/JPY's elevated levels.
⚔️ Geopolitical: Middle East tensions and related energy-market jitters have been supporting safe-haven and dollar flows at times, while diplomatic talks toward a possible ceasefire are also in play — a two-way risk for sentiment this week.
📅 Calendar catalysts: Watch upcoming Eurozone sentiment data, ECB speakers, and any fresh Fed commentary — all capable of moving GEPPY sharply in either direction.
━━━━━━━━━━━━━━━━━━━━
⚠️ RISK FACTORS — WHAT COULD BUST THE HEIST ⚠️
━━━━━━━━━━━━━━━━━━━━
🚔 A hawkish surprise from the Fed or a dovish ECB shift could strengthen the dollar bloc and cap EUR/JPY upside
🚔 A sudden BoJ policy shift or verbal intervention on yen weakness could trigger sharp JPY strength
🚔 Risk-off shock from geopolitical escalation could spike safe-haven yen demand against the plan
🚔 Failure to clear the police-force resistance zone near the vault could result in a fakeout/trap reversal
━━━━━━━━━━━━━━━━━━━━
💬 THIEF TRADER WISDOM 💬
━━━━━━━━━━━━━━━━━━━━
🖤 "A real Thief doesn't chase the market — the Thief waits patiently for the vault to open itself."
🖤 "Greed gets you caught. Discipline gets you paid."
🖤 "Every OG in this crew wins not by predicting the market, but by respecting the escape hatch."
━━━━━━━━━━━━━━━━━━━━
📣 JOIN THE CREW 📣
━━━━━━━━━━━━━━━━━━━━
👑 If this blueprint added value to your heist, smash that 🚀 BOOST button, hit FOLLOW, and drop a 💬 comment below!
🤝 Every like fuels the next vault plan for the Thief OG's community!
━━━━━━━━━━━━━━━━━━━━
📜 DISCLAIMER 📜
━━━━━━━━━━━━━━━━━━━━
Dear Ladies & Gentleman (Thief OG's), this idea is shared for educational and informational purposes only and is not financial advice. Trading involves risk, and you are solely responsible for your own entries, exits, position sizing, and risk management. Please do your own research and trade at your own risk.
#EURJPY #Forex #ForexTrading #ThiefTrader #ThiefOGs #GEPPY #ForexSignals #TradingView #DayTrading #SwingTrading #PriceAction #ForexCommunity #JPY #EUR
NZD/USD📊 NZD/USD Analysis | H4 Timeframe
NZD/USD remains in a bullish market structure following a strong impulsive rally from higher-timeframe demand. The current pullback appears to be a corrective retracement into a key demand zone, offering the potential for trend continuation.
🔹 Market Structure
Price has established a clear Break of Structure (BOS), confirming a shift in momentum from bearish to bullish. The ongoing retracement is expected to provide liquidity before buyers attempt another leg higher.
🔹 Current Outlook
The demand zone around 0.5820–0.5840 is a key area to monitor. As long as price holds above this level and bullish confirmation develops, the probability favors continuation toward higher liquidity.
🔹 Bullish Scenario
A successful reaction from demand could see NZD/USD rally toward the higher-timeframe supply zone around 0.5920, with the potential to continue toward the 0.6000 psychological level if momentum remains strong.
🔹 Key Levels
📍 Demand Zone: 0.5820 – 0.5840
📍 Resistance Target: 0.5920
📍 Extended Bullish Target: 0.6000
💡 Trading Insight
This setup aligns with the broader expectation of continued US Dollar weakness (DXY). A bearish DXY strengthens the case for NZD/USD, making the current retracement a potential opportunity to look for bullish confirmation before entering the market.
⚠️ *This analysis reflects my personal market outlook based on price action, liquidity, market structure, and Smart Money Concepts (SMC). It is shared for educational purposes only and should not be considered financial advice.*
GBPCHF SELL GBPCHF SELL
Bias: Bearish
Fundamental Reasoning:
CHF Strength: Swiss Franc is in demand as a safe-haven due to global risk-off sentiment / geopolitical uncertainty.
GBP Weakness: Pound is under pressure from weak UK economic data, dovish Bank of England expectations, and softer risk appetite.
Market Sentiment: Risk-off flows favor CHF over GBP.
Technical Reasoning:
Price is rejecting from a key supply zone / resistance level on H4 / Daily timeframe.
Bearish market structure - Lower Highs and Lower Lows forming.
RSI showing bearish divergence / overbought condition.
Strong bearish momentum candle closing below support.
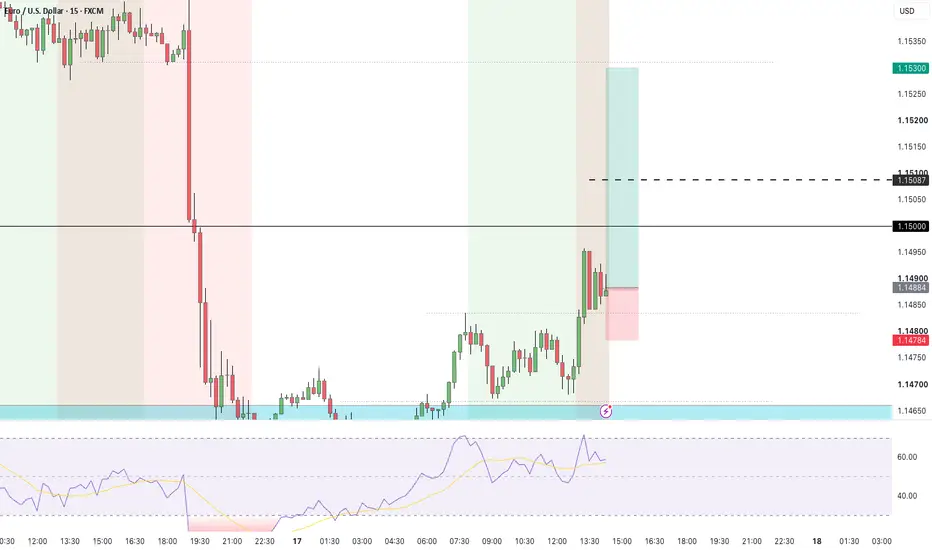
EURUSD Bearish continuation pattern resistance at 1.1487EURUSD continues to trade within the broader prevailing trend, with recent price action showing signs of a potential bearish continuation pattern developing.
Key Level: 1.14887
This area previously acted as a consolidation zone and is currently being monitored as a notable resistance level.
Scenario Below 1.1487
If price remains below 1.1487, market structure may continue to reflect near-term downside pressure. In this context, the following levels may act as reference support areas:
1.1377– Near-term support
1.1350 – Intermediate support
1.1310 – Broader support zone
Scenario Above 1.1487
A sustained move and daily close above 1.1487 would indicate a shift in the current short-term structure. In that scenario, the following levels may become relevant on the upside:
1.1535 – Initial resistance
1.1600 – Higher resistance zone
Conclusion
EURUSD remains below an important technical area, with 1.1487 acting as a key reference level for the current price structure. Price behaviour around this zone may help determine whether the market continues within the recent corrective phase or transitions toward further upside continuation.
The information provided does not constitute investment advice nor take into account the individual financial circumstances or objectives of any investor. Any information that may be provided relating to past performance is not a reliable indicator of future results or performance. To the extent permitted by law, in no event shall Trade Nation (or any affiliate or employee) have any liability for any loss arising from the use of the information provided. Any person acting on the information does so entirely at their own risk. Any information which could be construed as “investment research” has not been prepared in accordance with legal requirements designed to promote the independence of investment research and as such is considered to be a marketing communication.
Financial Spread Bets and CFDs are complex instruments and come with a high risk of losing money rapidly due to leverage. 73.7% of retail investor accounts lose money when trading CFDs with this provider. You should consider whether you understand how CFDs work and whether you can afford to take the high risk of losing your money.
GBPUSD H1: Bearish Pressure ContinuesGBPUSD continues to move within a descending channel after being rejected from the recent high zone. The sequence of lower highs and lower lows remains intact, indicating that sellers are still controlling the short-term trend. The price has made a slight recovery toward the channel resistance but has yet to form a reliable reversal signal.
Entry Plan:
Prioritize Sell (Short) positions if the price continues to face rejection at the upper boundary of the descending channel or breaks below the recent low. The first target is located around the 1.33600 support zone, where significant buying pressure appeared previously.
Invalidation Scenario:
The bearish scenario will become invalid if GBPUSD breaks above and closes an H1 candle beyond the upper boundary of the descending channel, while forming a higher high structure, indicating that buyers have regained control of the market.
EUR/CAD Tests a Key Resistance Zone!Fundamental Outlook
From a fundamental perspective, investors are awaiting key economic data from both the Eurozone and Canada, which could play a major role in determining the pair's next direction.
On one hand, the European Central Bank continues to monitor inflation and economic growth to assess the future path of monetary policy. Meanwhile, market participants remain focused on any comments that could provide clues regarding the timing and pace of future interest rate decisions.
In Canada, the Canadian dollar remains closely tied to oil prices, given the country's status as one of the world's largest energy exporters. As a result, any increase in oil prices could strengthen the Canadian dollar and weigh on EUR/CAD, while weaker oil prices may provide the pair with room to extend its gains.
In addition, inflation data, retail sales, labor market figures, and shifts in global risk sentiment are expected to remain among the key drivers influencing the pair in the coming sessions.
Technical Outlook
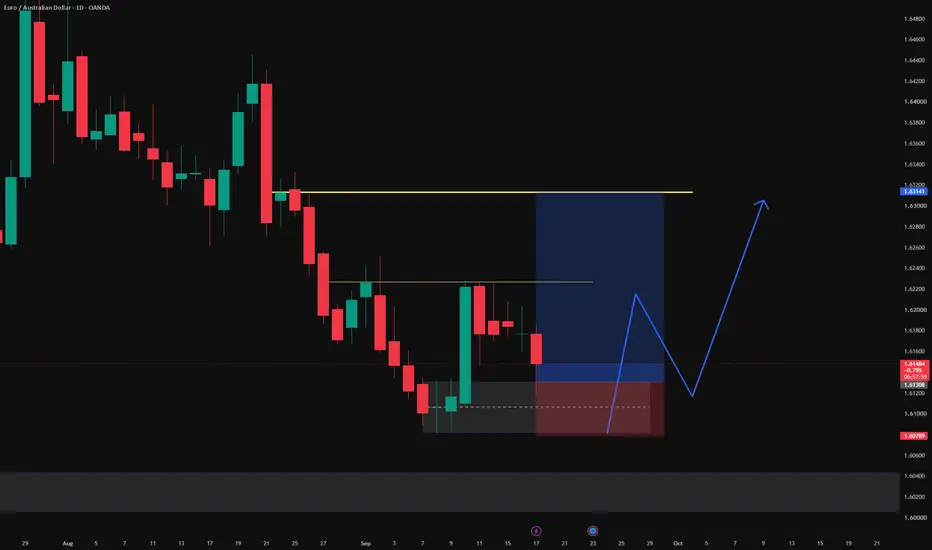
From a technical perspective, EUR/CAD continues to trade within a broader downtrend on the 4-hour chart, forming a sequence of lower highs and lower lows, reflecting the persistence of bearish momentum.
Although the pair has rebounded from its most recent low near the key psychological level of 1.60000, the recovery is still viewed as a corrective move within the broader bearish trend. The pair could resume its decline upon reaching the supply zone between 1.60840 and 1.61010, which coincides with the 78.6% and 88.6% Fibonacci retracement levels, respectively, reinforcing the area's significance as a technical resistance zone.
To maintain the bearish outlook, the price should remain below 1.61148. A break and close above this level could signal weakening downside momentum and increase the likelihood of a broader bullish correction.
EUR/USD: Sitting on 4H Demand (Waiting for the LTF Shift)Hey everyone, looking at EUR/USD today.
Right now, we’re at a pretty interesting spot. If you zoom out to the 4H, the structure has been bullish, and we are currently getting a deep pullback right into a major demand zone just above the 1.1400 psychological level.
However, dropping down to the 15m chart (shown in the idea), it’s just pure chop. The short-term momentum from the 1H chart is heavily bearish, and price is currently just basing in a tight range between 1.1405 and 1.1425.
Taking a trade right in the middle of this range is basically a coin flip. The HTF says buy, but the LTF says sell. Because of that, I'm sitting on my hands and waiting for the market to show its hand first.
The Game Plan:
I am stalking a long here to play the 4H bounce, but I need confirmation.
The Trigger: I'm waiting for a clear 15m candle close above 1.1425. This will break local structure and tell us buyers are finally stepping in.
Entry: I'm not buying the initial breakout (too risky for fakeouts). If 1.1425 breaks, I'll look to enter on the pullback/retest into the 1.1415 - 1.1420 area.
Stop Loss: 1.1395. If we break below 1.1400, this whole bullish thesis is wrong and we are likely heading much lower.
Targets: TP1 at 1.1450 (recent supply) and leaving a runner for 1.1480 (HTF swing high).
Set your alerts at 1.1425 and 1.1400 and let the market come to you. Don't force it!
The Day Ahead Today's focus is on the UK labour market, European economic sentiment, and another busy day of earnings.
UK employment data, including wages, unemployment and jobless claims, will be closely watched for clues on the Bank of England's next interest rate move. In Europe, the German and Eurozone ZEW surveys will provide an early indication of business confidence, while the ECB's Bank Lending Survey will offer insight into credit conditions across the region. In the US, the Philadelphia Fed non-manufacturing survey will provide another read on the strength of the services sector.
On the earnings front, investors will focus on results from General Motors, Capital One, Charles Schwab, Interactive Brokers and Danaher. Together, these companies will provide valuable insight into the health of the US consumer, financial markets, industrial demand and healthcare spending. Results from Novartis, MSCI, EQT and Halliburton will also be monitored for updates on pharmaceuticals, investment flows and energy markets.
The information provided does not constitute investment advice nor take into account the individual financial circumstances or objectives of any investor. Any information that may be provided relating to past performance is not a reliable indicator of future results or performance. To the extent permitted by law, in no event shall Trade Nation (or any affiliate or employee) have any liability for any loss arising from the use of the information provided. Any person acting on the information does so entirely at their own risk. Any information which could be construed as “investment research” has not been prepared in accordance with legal requirements designed to promote the independence of investment research and as such is considered to be a marketing communication.
Financial Spread Bets and CFDs are complex instruments and come with a high risk of losing money rapidly due to leverage. 73.7% of retail investor accounts lose money when trading CFDs with this provider. You should consider whether you understand how CFDs work and whether you can afford to take the high risk of losing your money.
AUD/USD Weak-High Liquidity TestMarket Thesis:
AUD/USD remains structurally bullish on the 15-minute chart, supported by consecutive bullish BOS signals and a sustained sequence of higher lows. Price is now trading directly into the marked Weak High near 0.70220, making this a liquidity-sensitive area rather than an ideal location for impulsive buying.
Visible Confluences — 15-Minute Chart
Current price is approximately 0.70208.
A bullish BOS has cleared the prior structural high around 0.70125.
Price is testing the visible Weak High liquidity level near 0.70220.
The latest bullish leg originated from the highlighted support zone around 0.69935–0.69955.
Additional highlighted support zones are visible at:
0.70035–0.70058
0.69865–0.69905
0.69635–0.69660
The chart identifies a protected Strong Low near 0.69630.
Multiple bullish BOS signals remain intact on the right side of the chart.
Earlier CHoCH signals show that intraday corrections have repeatedly transitioned back into bullish continuation.
Trade Scenarios
Setup 1: Bullish Pullback Continuation
Direction: Buy
Entry Zone: 0.70035–0.70058
Confirmation: Lower-timeframe bullish CHoCH, rejection wick, or strong bullish displacement from the zone
Stop Loss: 0.70005
Targets:
TP1: 0.70125
TP2: 0.70220
TP3: 0.70300
This is the preferred continuation setup while price remains above the latest intraday higher-low structure.
Setup 2: Deeper Bullish Retracement
Direction: Buy
Entry Zone: 0.69935–0.69955
Confirmation: Liquidity sweep beneath the zone followed by an LTF bullish CHoCH or momentum candle close back above 0.69955
Stop Loss: 0.69895
Targets:
TP1: 0.70050
TP2: 0.70125
TP3: 0.70220
This zone represents the base of the latest visible bullish expansion and offers stronger potential Risk/Reward than chasing current price.
Setup 3: Weak-High Liquidity Sweep Reversal
Direction: Sell
Entry Zone: 0.70215–0.70235
Confirmation: Price must sweep the Weak High and then produce a confirmed bearish CHoCH on the 1-minute or 5-minute chart
Stop Loss: 0.70265
Targets:
TP1: 0.70125
TP2: 0.70050
TP3: 0.69950
This is a conditional countertrend setup. A simple touch of the Weak High is insufficient; bearish structural confirmation is mandatory.
Refinement Tip
For the best Risk/Reward, monitor the identified 15-minute zones on the 1-minute and 5-minute charts. Prioritize entries only after a liquidity reaction, lower-timeframe CHoCH, or decisive momentum candle confirms institutional participation.
⚠️ Disclaimer
Trading financial markets involves significant risk, and no setup is guaranteed to succeed. This analysis reflects the visible market structure and probability conditions at the time of the screenshot. It is provided strictly for educational and analytical purposes. Always apply disciplined risk management and validate every setup against your own trading plan.
EUR/USD Liquidity Rebound Underway — Supply Test NextMarket Thesis:
EUR/USD is rebounding from the visible 15-minute demand zone after a bearish BOS drove price toward the marked weak low. Near-term order flow has turned constructive, but the broader intraday structure remains capped beneath layered supply at 1.14340–1.14405 and 1.14535–1.14595.
The current recovery is therefore a retracement unless buyers secure a confirmed structural break above nearby supply.
Visible Confluences — 15-Minute Chart
Current price is approximately 1.14231.
Recent bearish BOS delivered price into the lower liquidity area.
Visible demand zone: 1.14075–1.14135.
Marked Weak Low: approximately 1.14020, leaving downside liquidity vulnerable.
Price produced several internal CHoCH signals while consolidating above demand.
Local equal-high liquidity is visible around 1.14185–1.14200 and is being challenged.
First visible supply zone: 1.14340–1.14405.
Marked Strong High: approximately 1.14490.
Upper supply zone: 1.14535–1.14595.
The latest bullish reaction has not yet invalidated the preceding bearish 15-minute BOS.
Trade Scenarios
Setup 1 — Buy the Demand Retest
Direction: Buy
Entry zone: 1.14085–1.14125
Trigger: Lower-timeframe bullish CHoCH, rejection wick, or decisive bullish momentum candle from the blue demand zone
Stop loss: 1.14005
TP1: 1.14230
TP2: 1.14345
TP3: 1.14485
Rationale: The demand zone has already generated a meaningful reaction. A controlled retracement followed by renewed bullish structure would provide a cleaner continuation entry than chasing current price.
Setup 2 — Sell the First Supply Reaction
Direction: Sell
Entry zone: 1.14345–1.14400
Trigger: Lower-timeframe bearish CHoCH, failed breakout, or strong bearish displacement from the visible supply zone
Stop loss: 1.14455
TP1: 1.14230
TP2: 1.14135
TP3: 1.14020
Rationale: This zone aligns with the origin of the latest bearish expansion. Until price closes decisively above it, the rally can still be treated as a retracement into supply.
Setup 3 — Bullish Breakout Continuation
Direction: Buy
Entry zone: 1.14385–1.14410 on a confirmed breakout and retest
Trigger: A 15-minute close above 1.14405, followed by an LTF bullish CHoCH or momentum continuation
Stop loss: 1.14320
TP1: 1.14490
TP2: 1.14545
TP3: 1.14590
Rationale: Acceptance above the first supply zone would weaken the immediate bearish thesis and expose the marked strong high and upper supply.
Refinement Tip
For the best risk-to-reward, monitor these 15-minute zones on the 1-minute, 3-minute, or 5-minute chart. Execute only after clear candle confirmation, displacement, or an LTF structural shift; avoid entering solely because price touches a zone.
⚠️ Disclaimer: Trading financial markets involves significant risk, and no market outcome is guaranteed. This analysis reflects visible structure and probability at the time of the chart and is provided strictly for educational and analytical purposes. Apply independent judgment, predefined risk limits, and disciplined position sizing.
Can EUR/CAD Reshape Global Forex Strategies?The EUR/CAD currency pair increasingly commands institutional attention across global capital markets. Macro traders view this pair as a powerful macroeconomic barometer. The Euro meets a commodity-backed Canadian Dollar during periods of global uncertainty. Consequently, institutional portfolios actively trade this dynamic cross to hedge systemic risk.
Macroeconomic Divergence and Interest Rates
The monetary policy split between Europe and Canada drives sharp exchange rate movements. The Bank of Canada holds its policy rate at 2.25 percent. Meanwhile, the European Central Bank maintains its deposit facility near 2.00 percent. Central bank governors balance persistent inflation against fragile domestic economic growth. Interest rate differentials directly influence multi-billion-dollar sovereign bond flows. Capital aggressively shifts between Frankfurt and Ottawa based on these relative yields.
Geopolitics and Transatlantic Geostrategy
Geopolitical disruptions drastically alter global trade routes and raw commodity prices. Middle East energy shocks impact international oil benchmarks and chemical supply chains. Canada benefits directly as a major net exporter of energy resources. Conversely, European manufacturing hubs face persistent imported energy costs and trade drags. The Comprehensive Economic and Trade Agreement strengthens bilateral trade channels despite headwinds. Foreign exchange markets quickly price in these distinct geopolitical realities.
Technology, Cybersecurity, and High-Tech Trading
Modern forex trading relies entirely on hyper-fast execution and advanced cybersecurity. High-frequency algorithmic systems process millions of EUR/CAD transactions per second. Quantitative funds utilize predictive machine learning to spot subtle price anomalies. Moreover, financial institutions deploy zero-trust architecture to protect cross-border settlement channels. Encrypted messaging networks shield corporate treasuries from malicious cyberattacks during transfers. High-tech infrastructure keeps transatlantic liquidity flowing continuously without operational interruption.
Cross-Industry Impact: Pharma and Biotech Corridors
Transatlantic trade extends far beyond raw energy commodities and heavy industrial machinery. European pharmaceutical giants export specialized medical therapies and biotech equipment directly to Canada. Currency fluctuations significantly alter export revenues and research budgets for biopharma firms. Corporate treasurers implement automated hedging models to lock in predictable profit margins. Furthermore, intellectual property licensing and clinical trial funding require seamless currency conversion. Stable exchange corridors ensure steady healthcare supply chains and reliable operational funding.
Business Models and Leadership Innovation
Corporate leadership teams completely redefine foreign exchange risk management in modern treasuries. Chief Financial Officers abandon outdated static hedging practices for real-time dynamic algorithms. Executive teams actively evaluate supply chain locations based on long-term currency trajectories. Companies establish nearshoring facilities to reduce foreign exchange transaction friction across borders. Strategic leadership transforms FX volatility from a passive risk into a competitive advantage. Innovative business models thrive by mastering cross-border currency dynamics.
Bank of Canada Rate Decision Analysis
This report highlights the Bank of Canada's monetary policy stance, offering crucial insight into the interest rate differentials and economic forces shaping the Canadian Dollar against major global currencies like the Euro.
GBPUSD: Bearish channel may end with a bullish breakoutGBPUSD continues to trade within a short-term bearish channel; however, the intervals between downward swings are narrowing, and the price is consistently showing positive reactions at the pattern's lower boundary. This indicates that selling pressure is losing momentum, while buyers are gradually regaining control.
If the price holds the 1.3405 level and breaks above the upper boundary of the channel, the pattern will complete, signaling a short-term reversal. In that event, the immediate target would be 1.3440.
Strategy: Prioritize BUY positions around 1.3405, targeting 1.3440. The bullish scenario is invalidated if the price closes below 1.3405 on the H1 timeframe.
USD/CAD Rebounds After Softer Canadian CPI. USD/CAD staged its strongest recovery in several sessions after Canadian CPI came in cooler than expected, reducing expectations that the Bank of Canada will need to maintain a restrictive policy stance.
The softer inflation data provided the Canadian dollar with a short-term headwind, allowing USD/CAD to bounce from the 50% Fibonacci retracement toward the 38.2% Fibonacci level.
However, one day's data does not necessarily invalidate the broader bearish trend.
This is where separating macro direction from technical execution becomes critical.
What's Changed Since Yesterday?
Yesterday's key development was the Canadian CPI release.
Lower-than-expected inflation weakened the CAD as traders scaled back expectations for future monetary tightening. That shift was immediately reflected in price action, with USD/CAD recovering sharply from the 50% Fibonacci support.
The question now is whether this is simply a relief rally or the beginning of a larger correction.
Macro Outlook
The broader macro picture has become more balanced.
USD
The U.S. dollar has found some support after last week's heavy selling following softer U.S. CPI and PPI data. However, markets still expect the Federal Reserve to remain cautious, limiting the scope for an aggressive USD recovery.
CAD
Canadian employment remains fundamentally strong, but yesterday's softer inflation report has introduced fresh uncertainty. If inflation continues to cool, expectations for future Bank of Canada tightening could weaken further, reducing one of the CAD's recent advantages.
This creates a market where employment data supports CAD, while inflation data has temporarily shifted momentum back toward USD.
Technical Analysis
The technical structure remains the most important guide.
Current observations:
Price successfully bounced from the 50% Fibonacci retracement.
Buyers have pushed the market back toward the 38.2% Fibonacci level.
The 38.2% retracement is now acting as the first major resistance.
Stochastic RSI is rolling over from overbought territory, suggesting bullish momentum may be fading.
This area will likely determine the next directional move.
Bullish Scenario
If buyers break and close above the 38.2% Fibonacci level, the correction could extend toward:
Former support around 1.4140–1.4150
The broken ascending channel
Bearish Scenario
If sellers defend the 38.2% retracement, the broader downtrend remains intact.
A rejection here would increase the probability of another move toward:
50% Fibonacci
61.8% Fibonacci
Major demand around 1.3900
Trading Advantage™ Framework
USD/CAD Macro Score™ (UMS)
34/100 🔴
The score has improved slightly due to weaker Canadian inflation, but it remains below neutral because:
Canadian employment is still resilient.
The broader technical trend remains bearish.
USD has not yet regained strong macro momentum.
Market Risk Meter™ (MRM)
🟡 MODERATE
Markets are beginning to reassess expectations after Canada's inflation surprise. Volatility could increase as traders decide whether yesterday's move represents a temporary correction or a genuine shift in trend.
My Trading Plan
I'm not interested in buying simply because price has bounced.
Instead, I'm watching how the market behaves around the 38.2% Fibonacci resistance.
If price is rejected here, it would reinforce the broader bearish thesis and present a higher-probability continuation setup.
If buyers establish acceptance above this level, I'll reassess the possibility of a deeper retracement.
For now, price is testing resistance—not confirming a reversal.
Trading Lesson™
One economic report can change short-term momentum, but rarely changes the entire market structure.
Professional traders don't react to every headline—they evaluate whether the new information is strong enough to invalidate their existing thesis.
So far, Canada's softer CPI explains the bounce, but it has not yet invalidated the broader bearish structure.
The Trading Advantage™
"Fundamentals determine the direction. Technical analysis determines the entry and exit. The edge comes from knowing the difference."
USDCAD Recovery Nears Resistance - Drop Toward 1.40200 AheadUSDCAD is trading inside a clear descending channel, keeping the broader bearish structure intact. Price continues to form lower highs and lower lows, showing that sellers still control the trend. The recent recovery looks more like a corrective move than a true reversal.
Price is now reacting from a key resistance zone near the upper boundary of the channel. If sellers continue to defend this area, the next bearish leg could extend toward the 1.40200 target, where previous support is located.
As long as price remains below the resistance zone and the descending trendline, the bearish scenario stays valid. A clean breakout above this structure would invalidate the setup and suggest a stronger recovery.
Always wait for confirmation and manage your risk carefully.
Best of luck!
AUDUSD (2H) — Market's #1 Risk BarometerStill in a bearish daily trend, currently correcting UP to collect BSL before any potential continuation lower.
Price is grinding up off the SSL 0.69620 low and reacting from a bullish FVG (FVG - Pivot), now approaching the Supply zone above.
🟢 Hold FVG
→ push UP to BSL
0.70410 / 0.70650
into Supply near 0.70760
🔴 Flip below FVG
(2H candle body must close below — wick doesn't count)
→ Bearish Breaker confirmed
TP1: SSL 0.69620
TP2: SSL 0.69124
🌍 US-Iran risk + rising oil = safe-haven pressure, weighing on risk currencies
💵 Softer US inflation has cut July hike odds, capping USD strength
🇦🇺 AU inflation expectations cooling but ~70% chance of one more RBA hike by December
📊 Risk-on/Risk-off read:
AUD is a high-beta, commodity-linked currency — rallies on risk-on flows, sells off on risk-off. Calmer geopolitical headlines support the FVG hold toward BSL/Supply; Iran/oil escalation or a hawkish Fed surprise increases odds of the flip toward SSL.
Let price decide at the FVG.
Trade Safe
Kwagga.