NZDUSD – Buyers Are Trying to Fight BackWhile NZDUSD remains trapped inside a clear H4 downtrend, price is beginning to show a stronger reaction from the support area near 0.5700. The trend is still bearish, but the latest price action suggests selling pressure is beginning to lose some momentum.
On the fundamental side, New Zealand’s economy delivered a better-than-expected Q2 GDP result . Growth came in at 0.2% quarter-on-quarter, above the 0.1% consensus and the RBNZ’s expectation of no growth. The RBNZ has also recently raised its cash rate to 2.75%, giving the Kiwi some domestic support. However, the NZD remains under pressure after the Federal Reserve raised U.S. rates to 3.75%–4.00% and maintained a hawkish stance.
This creates an interesting short-term setup. The stronger New Zealand data is giving buyers a reason to defend the lows , while tighter U.S. monetary policy continues to limit how far NZDUSD can recover. For now, the bounce still looks more like a recovery within the broader downtrend rather than a confirmed bullish reversal.
On the 4H chart, 0.5700 remains the key support zone. Price has reacted several times around this area and is attempting to build a base. If buyers continue to defend it, NZDUSD could recover toward 0.5743–0.5750, where the descending channel and nearby Ichimoku resistance create the next important test.
In summary, I still see room for a short-term recovery from 0.5700 toward 0.5743–0.5750. However, the broader H4 structure remains bearish, making the reaction around this resistance area especially important for what comes next. CHFTHB Tracks Risk SentimentYesterday Recap
Yesterday, CHFTHB closed at 40.38 in the Thai market. Meanwhile, Switzerland’s trade surplus declined from the previous period, reflecting a slight slowdown in the trade sector.
Fundamental 18/9/26
Key Events Today
Today, there are no high-impact economic releases from Switzerland.
Therefore, CHF is likely to be driven mainly by global market factors, particularly Risk Sentiment, the USD, and Bond Yields. The VIX stands at 15.44, down 12.82%, indicating a Risk-On environment, which could put pressure on CHF due to reduced safe-haven demand.
In addition, the direction of the EUR and ECB monetary policy, including Lagarde’s comments, could indirectly affect CHF through broader European currency movements and interest-rate expectations in the region.
Overall, CHFTHB is expected to move within a range, with the main focus on Risk Sentiment, the USD, and Bond Yield direction.
Technical Analysis — CHFTHB 1H
Bias: Bearish
View: The price remains in a downtrend and is trading below 40.37. If it fails to break above this resistance, the price may decline to test 40.25, in line with the range identified on the chart. RSI at 39.10 remains below 50, indicating weak momentum, while MACD remains below the zero line, although the Histogram has started to turn slightly positive, suggesting that selling pressure is beginning to ease.
Resistance: 40.37
Support: 40.25
Target: 40.25 → 40.20
Cut Loss: 40.39 GBPTHB Eyes UK Retail SalesYesterday Recap
Yesterday, GBPTHB closed at 44.66 in the Thai market. Meanwhile, the BoE kept interest rates unchanged as expected, while the number of votes in favor of a rate hike remained unchanged, reflecting the BoE’s cautious stance toward inflation and its reluctance to accelerate monetary easing.
Fundamental 18/9/26
Key Events Today | Forecast | Previous
UK: 13:00 — Retail Sales MoM | -0.2% | -0.5%
UK: 13:00 — Retail Sales YoY | 1.6% | -
UK: 13:00 — Core Retail Sales MoM | -0.9% | -
Today, the key UK data is Retail Sales MoM, forecast at -0.2%, improving from the previous -0.5%. A better-than-expected result would indicate a potential recovery in consumer spending and could support GBP, while a weaker-than-expected result could pressure GBP due to concerns over consumer demand.
Retail Sales YoY, previously at 1.6%, and Core Retail Sales MoM, previously at -0.9%, will also be monitored as part of the broader assessment of the UK consumer sector.
Overall, GBPTHB is expected to remain volatile within a range, with the main focus on Retail Sales and the direction of the USD.
Technical Analysis — GBPTHB 1H
Bias: Sideway
View: The price remains weak but is showing signs of a short-term recovery. If it breaks above 44.50, it may rebound further toward 44.55. However, if it fails to break above this level, the price may continue moving sideways. RSI at 35.23 remains below 50, indicating that momentum is still weak, while MACD remains below the zero line, but the Histogram has started to turn positive, suggesting that selling pressure is beginning to ease.
Resistance: 44.50 / 44.55
Support: 44.35 / 44.40
Target: 44.50 → 44.55
Cut Loss: 40.39 Softer Japanese CPI support the USDJPYFundamental Analysis
Japan’s Aug National CPI delivered a modest downside surprise. Headline CPI held steady at 1.9% YoY (prev. 1.9%, cons. 2.0%), while Core CPI excluding fresh food eased to 1.7% YoY from 1.8% in Jul, undershooting expectations of 1.8% YoY. Weaker energy-price inflation and softer food-price growth primarily drove the moderation, with government support measures also limiting the contribution from household energy costs. However, the more policy-relevant Core-Core CPI, which excludes fresh food and energy, held at 1.9% YoY. This indicates that underlying domestic inflation pressure has slowed only marginally rather than collapsing, though the data do not provide evidence of a renewed broad-based acceleration in prices.
The CPI outcome is mildly dovish for the BoJ because the main core measure remains below the 2% target for an eighth consecutive month and has moved further away from cons. expectations. Nevertheless, the stable Core-Core reading near 2%, persistent wage pressure, and concern that yen weakness might lift imported inflation continue to support a gradual tightening path. Markets largely expect the BoJ to raise its policy rate by 25 bp from 1.00% to 1.25%, which would mark the highest level in approximately 31 years. Therefore, the market impact depends less on the expected rate increase and more on whether the Bank portrays the inflation slowdown as temporary and energy-led, or as a reason to slow the pace of future tightening. A cautious hike and data-dependent guidance might prove less supportive for the yen, while confidence in sustained underlying inflation would strengthen expectations for further hikes.
The Fed raised the federal-funds target range by 25 bp to 3.75%–4.00% on Sep 16, marking its first increase since 2023. The updated projections retained a hawkish tone: the median end-2026 policy-rate forecast rose to 4.1%, and 16 of 18 policymakers projected at least one additional increase this year.
As a result, despite the further rate hike expectation from BoJ, a hawkish Fed may further support the dollar-yen pairs.
Technical Analysis
USDJPY is rebounding from 153.20–153.60 but remains bearish below 156.90 and 158.10. Price is above the rising fast EMA, yet still beneath the declining slow EMA near 155.80–156.00.
If USDJPY closes above 156.90, the rebound might extend toward 158.10; a sustained break above 158.10 would expose 158.87 and weaken the bearish structure.
If price fails below 156.90 and falls beneath 155.30, sellers might target 154.30; a confirmed break there would place 153.20–153.60 back in focus.
By Van Ha Trinh - Financial Market Strategist at Exness AUDTHB Tracks Risk SentimentYesterday Recap
Yesterday, AUDTHB closed at 23.72 in the Thai market. Meanwhile, there were no high-impact economic releases from Australia.
Fundamental 18/9/26
Key Events Today
Today, there are no high-impact economic releases from Australia.
AUD is therefore likely to be driven mainly by external factors, particularly the direction of the USD, Bond Yields, and global Risk Sentiment, as well as developments in the Chinese economy, which is important to AUD given China’s role as a major trading partner of Australia.
In addition, the market will monitor the direction of major currencies and Risk Sentiment following recent central bank meetings, which could affect capital flows and AUD.
Overall, AUDTHB is expected to move within a range, with the main focus on the USD, Risk Sentiment, and China-related factors.
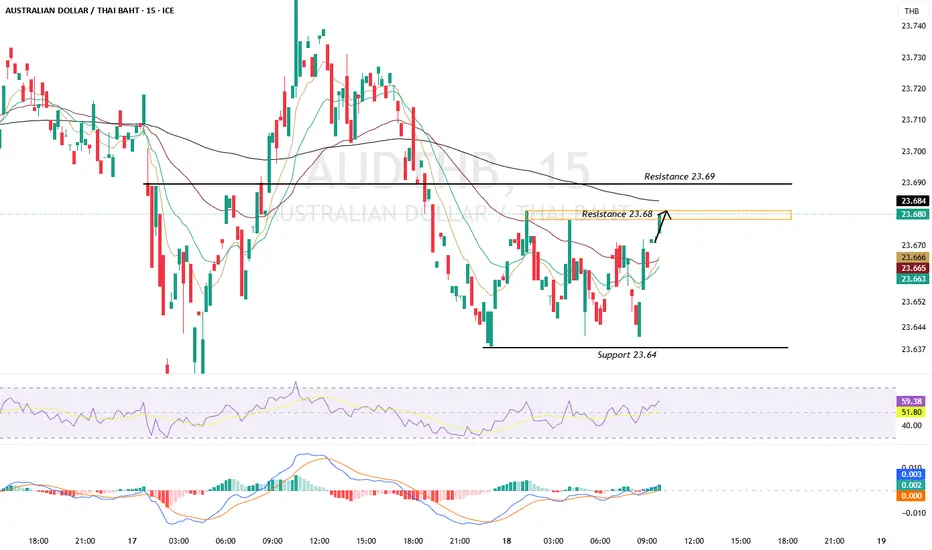
Technical Analysis — AUDTHB 15M
Bias: Sideway
View: The price has recovered from 23.64 and is currently consolidating near the 23.68 resistance level. RSI at 56.34 is above 50, indicating that momentum is starting to turn positive, while MACD has started to cross upward with a slightly positive Histogram, suggesting improving short-term momentum. If the price breaks above 23.68, it may move higher to test 23.69. However, if it fails to break above 23.68, the price may consolidate and return to a Sideway movement.
Resistance: 23.68 / 23.69
Support: 23.64
Target: 23.69
Cut Loss: 23.63 EURTHB Eyes Lagarde’s SpeechYesterday Recap
Yesterday, EURTHB closed at 38.27 in the Thai market. Meanwhile, Eurozone inflation increased from the previous month but came in slightly below expectations, while Core CPI declined, reflecting easing underlying inflationary pressures.
Fundamental 18/9/26
Key Events Today | Forecast | Previous
EU: 15:00 — Current Account | 30.7B | 35.1B
EU: 16:00 — Construction Production MoM | - | -1.34%
EU: 17:30 — ECB President Lagarde Speaks | - | -
Today, the key factor for EUR is the Eurozone Current Account, forecast at 30.7B, down from the previous 35.1B. A weaker-than-expected result could indicate softer external-sector conditions and put pressure on EUR, while a better-than-expected result could support EUR.
For Construction Production MoM, the market will monitor whether the construction sector shows signs of recovery. Meanwhile, Lagarde’s speech will be an important focus for EUR, as markets will look for signals regarding the inflation outlook and the ECB’s monetary policy direction.
Overall, EURTHB is expected to move within a range, with the main focus on Lagarde’s comments and the ECB’s monetary policy outlook.
Technical Analysis — EURTHB 1H
Bias: Sideway
View: The price remains weak but is showing potential for a rebound from the 38.15–38.12 zone. RSI at 27.44 is in the Oversold zone, indicating that selling pressure may have become excessive. Meanwhile, MACD remains negative but is starting to flatten, suggesting that selling pressure may be slowing. If the price holds above 38.15, it may rebound toward 38.24, which is an FVG. If the price breaks above the FVG, it may test the 38.28 resistance level. However, if the price breaks below 38.15, further downside toward the 38.12 support level is possible.
Resistance: 38.24 / 38.28
Support: 38.15 / 38.12
Target: 38.24 → 38.28
Cut Loss: 38.11 USDTHB Eyes US Industrial ProductionYesterday Recap 17/9/26
Yesterday, USDTHB closed at 33.35 in the Thai market. U.S. manufacturing activity, as measured by the Philadelphia Fed Manufacturing Index, was stronger than expected, while Initial Jobless Claims declined, suggesting that the U.S. economy remained relatively strong and supporting the USD.
Fundamental 18/9/26
Key Events Today | Forecast | Previous
US: 20:15 Industrial Production MoM | 0.1% | 0.2%
US: 20:15 Capacity Utilization | 76.4% | 76.3%
US: 20:30 FOMC Member Bowman Speaks
Today's key U.S. economic release is Industrial Production MoM, forecast at 0.1%, down from the previous 0.2%. A weaker-than-expected reading could signal a slowdown in the manufacturing sector and pressure the USD, while stronger-than-expected data could support the USD.
Meanwhile, Capacity Utilization is forecast at 76.4%, slightly higher than the previous 76.3%. A stronger reading would indicate improved capacity utilization and could support the USD. FOMC Member Bowman will also speak, with markets monitoring her views on the Fed's interest-rate outlook following the latest meeting.
Overall, USDTHB is expected to move within a range with a slight upside bias, with the main focus on U.S. manufacturing data, the Fed's policy outlook, and Bond Yields.
Technical Analysis — USDTHB 1H
Bias: Bullish
The overall structure remains in an Up Trend, but RSI and MACD indicate that short-term upward momentum is weakening. Therefore, 33.25 is an important support level to watch. If price holds above this level, it could rebound toward 33.37. However, a break below 33.25 would weaken the bullish structure and could lead to a test of the next support at 33.15.
Resistance: 33.37
Support: 33.25 / 33.15
Target: 33.37
Cut Loss: 33.14

 Short
Short