CAD/JPY SENDS CLEAR BEARISH SIGNALS|SHORT
CAD/JPY SIGNAL
Trade Direction: short
Entry Level: 115.690
Target Level: 115.398
Stop Loss: 115.881
RISK PROFILE
Risk level: medium
Suggested risk: 1%
Timeframe: 1h
Disclosure: I am part of Trade Nation's Influencer program and receive a monthly fee for using their TradingView charts in my analysis.
✅LIKE AND COMMENT MY IDEAS✅
Forex market
AUDUSD: Bearish Drop to 0.668?As the previous analysis worked exactly as predicted, FX:AUDUSD is eyeing a bearish reversal on the 4-hour chart , with price testing resistance after forming lower highs, converging with a potential entry zone that could trigger downside momentum if sellers defend amid recent volatility. This setup suggests a pullback opportunity in the uptrend, targeting lower support levels with close to 1:5.5 risk-reward overall.🔥
Entry between 0.702–0.704 (entry from current price with proper risk management is recommended). Targets at 0.676 (first), 0.668 (second). Set a stop loss at a daily close above 0.709 , yielding a risk-reward ratio of close to 1:5.5 overall . Monitor for confirmation via a bearish candle close below entry with rising volume, leveraging the pair's weakness near resistance.🌟
📝 Trade Setup
🎯 Entry (Short):
0.7020 – 0.7040
(Entry from current price is valid with proper risk & position sizing.)
🎯 Targets:
• 0.6760 (First Target)
• 0.6680 (Final Target)
❌ Stop Loss:
• Daily close above 0.7090
⚖️ Risk-to-Reward:
• ~ 1:5.5 Overall
💡 Does AUDUSD reject the 0.7020–0.7040 resistance zone and decline toward 0.6760 and 0.6680, or will buyers break higher and extend the current recovery? 👇
EURUSD Turtle Soup ReversalEURUSD has swept short-term sell-side liquidity and is now reacting from a precision breaker while respecting a nearby Fair Value Gap. If buyers continue to defend this area, the next objective is the cluster of buy-side liquidity resting overhead.
A classic Turtle Soup setup in the making.
Market Structure
• Sell-side liquidity has already been raided.
• Price is reacting from a precision breaker.
• A nearby FVG offers additional confluence.
• Buy-side liquidity remains the primary draw.
Bullish Scenario
🟢 Hold above the breaker after the liquidity sweep.
🟢 Look for bullish displacement through the FVG.
🎯 TP1: Internal buy-side liquidity.
🎯 TP2: External buy-side liquidity.
🎯 Final Target: Major buy-side liquidity (BSL).
Execution Plan
✅ Wait for confirmation above the breaker.
✅ Use the FVG as the decision point.
🛑 Invalidation below the Turtle Soup low.
🎯 Scale profits into each liquidity objective.
Liquidity creates the setup. Confirmation triggers the trade.
Not financial advice. Trade your own plan.
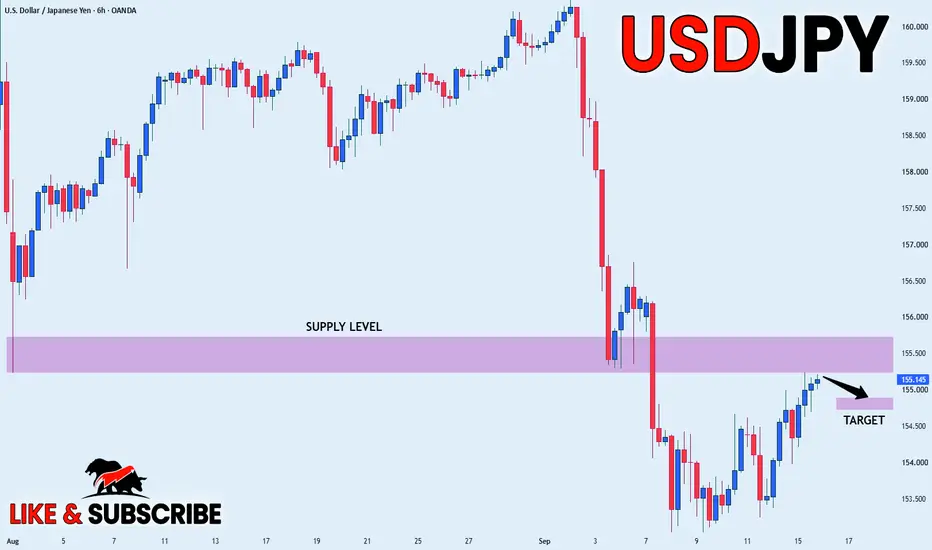
USDJPY Analysis: High-Risk Zone as BOJ Signals InterventionUSDJPY Analysis: High-Risk Zone as BOJ Signals Intervention
I know this is getting old and boring considering the BOJ is constantly sending out messages about possible intervention in Forex.
Yesterday they sent out another message warning about intervention in Forex. Many expect USDJPY to fly higher, but in my opinion we should be careful when the BOJ speaks.
It is impossible to know when they might act again, but considering that they have already intervened in the current zone, the chances are very high that this is the zone where they could make a small or larger intervention again.
The problem is that this will happen as soon as we give up and it carries a high risk.
Main objectives according to the strength of the intervention:
162.20
157.90
155.50
152.30
You can find more details on the chart.
Thank you and good luck! 🍀
⚠️PS: Do your own analysis and use your own strategy to join the trade.
❤️ If this analysis helps your trading day, please support it with a like or comment ❤️
Fundamental Market Analysis for July 17, 2026 EURUSDThe euro enters the session without sustained support from the eurozone economy. A decline in industrial production has reinforced doubts about the strength of the recovery, while higher European gas prices have revived concerns about pressure on business activity and household spending. Expectations of a firmer ECB stance are partly limiting euro selling but have yet to generate a strong local catalyst.
The main factor supporting the US dollar today is the combination of a resilient US labor market and stronger demand for defensive assets. A decline in jobless claims confirmed continued stability in employment, while escalating tensions between the United States and Iran are supporting the American currency. Softer inflation has reduced the likelihood of an imminent Federal Reserve rate increase, leaving the dollar’s advantage moderate.
When comparing the two currencies, the euro appears more vulnerable in the short term. Energy-related risks have a greater impact on the eurozone economy, while resilient demand and employment in the United States limit the scope for a reassessment of the dollar outlook. If cautious market sentiment and pressure from energy prices persist, the baseline scenario allows for a decline in EUR/USD during the current session.
Trading idea: SELL 1.14350, SL 1.14600, TP 1.13750
GBPCAD: Bearish Drop to 1.8887?FX:GBPCAD is eyeing a bearish reversal on the 4-hour chart , with price testing resistance near the upper boundary of the recent range, converging with a potential entry zone that could trigger downside momentum if sellers defend amid volatility. This setup suggests a pullback opportunity, targeting lower support levels with 1:5 risk-reward .🔥
Entry between 1.9024–1.9036 (entry from current price with proper risk management is recommended). Target at 1.8887 . Set a stop loss at a daily close above 1.9050 , yielding a risk-reward ratio of 1:5 . Monitor for confirmation via a bearish candle close below entry with rising volume, leveraging the pair's weakness near resistance.🌟
Fundamentally , GBPCAD is trading around 1.902 in July 10, 2026.
For the British Pound, today's key release is the BoE Governor Bailey Speech (if scheduled) or latest inflation-related comments, where any hawkish tone could support GBP, while dovish signals would weigh on it.
For the Canadian Dollar, the most important data today is the Canadian Employment Change and Unemployment Rate (July 10), where stronger job gains would strengthen CAD and support bearish pressure on GBPCAD.
Overall, soft Canadian labor data versus mixed UK signals could influence the pair's direction today. 💡
📝 Trade Setup
🎯 Entry (Short):
1.9024 – 1.9036
(Entry from current price is valid with proper risk & position sizing.)
🎯 Target:
• 1.8887
❌ Stop Loss:
• Daily close above 1.9050
⚖️ Risk-to-Reward:
• 1:5
💡 Does GBPCAD reject the 1.9024–1.9036 resistance zone and decline toward 1.8887, or will buyers break above the range and extend the recovery? 👇
EURCAD: Strong Bullish Price Action 🇪🇺🇨🇦
EURCAD looks bullish after a confirmed bearish trap below a solid
intraday horizontal support cluster.
A breakout of a resistance line of a bullish flag pattern confirms
a strong buying interest.
The price will likely reach 1.6078 level soon.
❤️Please, support my work with like, thank you!❤️
I am part of Trade Nation's Influencer program and receive a monthly fee for using their TradingView charts in my analysis.
EURUSD: ConsolidationEURUSD is on a consolidation momentum. The pair have been ranging horizontally for a couple of days now, after the price failed to break above the significant resistance zone, in respect to the structure. Price is currently approaching the resistance, as we anticipate sell retracement, between 1.1459-1.1469.
A clear reverse below this levels, triggers a sell position down to 1.1393, as next potential bearish.
Thanks for reading.
Title: USDCAD Bullish Rebound from Key Support
USDCAD on the **1-hour timeframe** is trading at a major support zone around **1.4035**, where buyers are attempting to defend the recent decline. After a strong bearish move below the Ichimoku Cloud, price has stabilized near the highlighted demand area, suggesting selling pressure may be fading.
The Ichimoku Cloud remains bearish, meaning the overall trend is still under pressure. However, the current support has previously attracted buying interest, increasing the possibility of a short-term corrective rebound if bulls maintain control above this zone.
A successful hold above **1.4035–1.4020** could trigger a recovery toward the first resistance near **1.4102**, which aligns with the projected upside target shown on the chart. A break above that level would strengthen bullish momentum and open the door for a move toward higher resistance levels.
On the downside, a decisive close below the support area would invalidate the rebound scenario and could lead to further bearish continuation.
### **Target:**
* 🎯 **Bullish Target:** **1.4102**
### **Key Levels:**
* **Support:** 1.4035–1.4020
* **Target/Resistance:** 1.4102
* **Major Resistance:** 1.4240
**Outlook:** Cautiously bullish for a short-term rebound while price remains above the highlighted support zone. A confirmed bounce could see USDCAD recover toward **1.4102** before the broader trend direction is reassessed.
Market Cycles:Every trader has experienced it.
A market that seemed unstoppable suddenly loses momentum.
A long downtrend unexpectedly turns into a powerful rally.
News outlets search for explanations after the move has already happened, while traders wonder how the trend changed so quickly.
The truth is that markets rarely move in a straight line forever.
They evolve through cycles.
Every bull market, every bear market, and every period of consolidation is part of a repeating process driven by human behavior, supply and demand, and changing expectations.
Understanding these cycles doesn't allow you to predict every turning point, but it does help you understand **where the market may be in its journey**.
Every Trend Begins Quietly
Most major trends don't start with excitement.
They begin when very few people believe in them.
After a prolonged decline, pessimism is widespread.
News remains negative.
Many traders have already given up.
Yet beneath the surface, buyers slowly begin accumulating positions.
Price stabilizes.
Selling pressure weakens.
The market stops making aggressive new lows.
This stage is often called accumulation.
Confidence is low, but the balance between buyers and sellers is beginning to shift.
Momentum Attracts Attention
As buying pressure increases, price starts making higher highs and higher lows.
At first, only experienced traders notice.
Then momentum traders join.
Analysts begin changing their outlook.
Positive news becomes more common.
The trend becomes visible to everyone.
This is the growth phase of the cycle.
Confidence replaces doubt, trading volume often increases, and more participants enter the market.
The trend feeds on itself as optimism spreads.
Euphoria Often Appears Near the Top
No trend lasts forever.
As prices continue rising, emotions begin replacing logic.
Success stories dominate social media.
Friends and family who never cared about investing suddenly start asking how to buy.
Many traders stop focusing on risk.
Instead, they believe prices can only move higher.
This is the distribution phase.
Large, experienced participants may begin taking profits while enthusiasm among retail traders reaches its highest level.
The market still looks strong, but the balance between buyers and sellers is quietly changing.
Decline Begins Before Most People Notice
Market tops are rarely obvious.
The first signs often appear as weaker rallies and failed breakouts.
Volatility increases.
Good news has less impact.
Selling pressure gradually grows.
Eventually, confidence gives way to uncertainty.
Some investors take profits.
Others hold on, convinced the correction is temporary.
As selling accelerates, fear spreads.
This marks the beginning of the **markdown phase**, where supply overwhelms demand and prices move lower.
Why Cycles Repeat
Technology changes.
Trading platforms improve.
New financial products appear.
But one thing remains remarkably consistent:
Human nature.
People still experience fear, greed, hope, regret, and overconfidence.
These emotions influence buying and selling decisions just as they did decades ago.
Because human psychology changes very little, market cycles continue to repeat across stocks, forex, cryptocurrencies, commodities, and other financial markets.
The names of the assets may change, but the emotional journey remains surprisingly familiar.
News Usually Follows the Trend
One of the biggest surprises for new traders is realizing that markets often move **before** the headlines explain why.
Positive news frequently appears after a strong rally has already begun.
Negative headlines often dominate after prices have fallen significantly.
This doesn't mean news is unimportant.
It means markets are forward-looking.
Prices reflect expectations about the future, not simply current events.
Understanding this helps traders avoid chasing headlines after much of the move has already occurred.
Recognizing the Stage Matters More Than Predicting the Exact Top
Many traders become obsessed with calling the exact market top or bottom.
In reality, that is rarely necessary.
A more useful approach is asking:
Is the market accumulating or distributing?
Is momentum strengthening or weakening?
Are emotions driven by fear or greed?
Is participation expanding or fading?
These questions provide context.
And context often leads to better decisions than trying to predict exact turning points.
Final words:
Markets don't move randomly from one candle to the next.
They progress through repeating cycles shaped by supply and demand, changing expectations, and human emotion.
Every major trend begins quietly.
It grows as confidence spreads.
It reaches a point where optimism becomes excessive.
Eventually, it weakens as emotions shift and a new cycle begins.
The traders who consistently succeed are not the ones trying to predict every twist and turn.
They are the ones who understand where the market is within the cycle and adapt their decisions accordingly.
Because while markets constantly change, the behavior of the people participating in them rarely does.
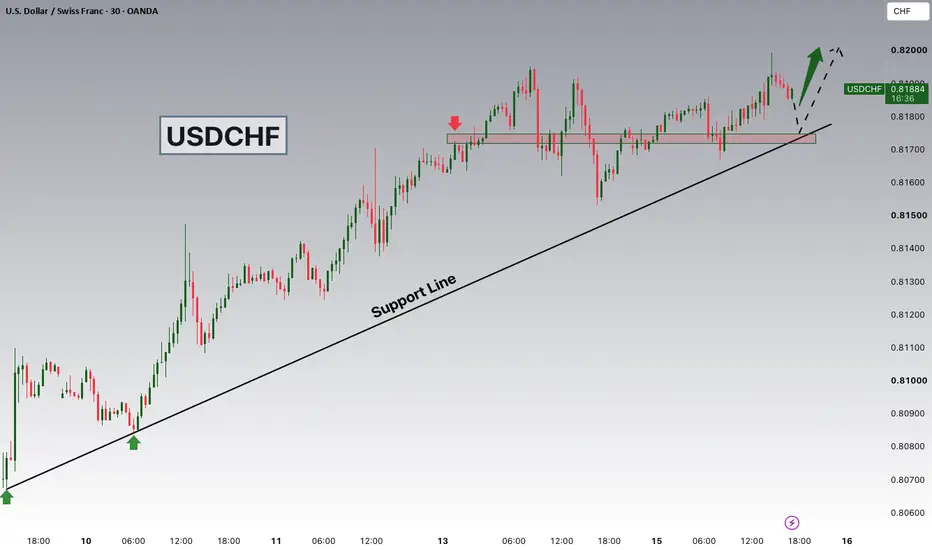
USD/CHF: THE 0.81600 MACRO WEDGE BREAKOUT! 🇨🇭 🚀
Playing with fire at 0.80844! Are you expecting the Swiss Franc to hold the line, or are you preparing for a massive dollar-driven breakout? 🤔
The Swiss National Bank's cautious monetary outlook is clashing directly with hawkish Fed sentiment, giving the greenback a perfect window to assert dominance. On this 1-hour OANDA chart, USD/CHF is tightly coiling within a massive macro Wedge pattern and is on the verge of shattering its internal diagonal Resistance line. 📈💥
The purple trajectory lays out a highly precise bullish continuation script. After a brief local consolidation, the algorithm is primed to launch an explosive impulse above the resistance wall, execute a clean retest of the breakout zone represented by the green box, and then charge vertically toward the macro wedge ceiling near 0.81600. 🪤
Patience remains your absolute edge in this setup. Instead of chasing the market when it starts to pump, smart money waits for the breakout to confirm and scales into the retest of the newly established floor. Let the retail bears exhaust themselves first! 🧘♂️⚡
Trade Parameters:
🛒 Long Zone: 0.80700 - 0.80950 🛍️
🛑 Stop-Loss: Hourly close below 0.80350 ❌
💰 Take-Profit: 0.81600 🩸
The bears are desperately trying to defend the descending trendline, but they are rapidly running out of liquidity. Keep your strategy clean, ignore the retail noise, and let the market makers push the price toward our terminal targets.
The macro trend is clearly gearing up for a major expansion phase. Stay disciplined, trust the geometric structure, and we will see you at the 0.81600 peak! 🚀💎
USDJPY - sideways, trendline reversal reaction1. Trend
Short-term bias: Neutral to slightly bearish.
Price is trading inside a symmetrical triangle, indicating consolidation.
EMA9 is slightly above EMA89, showing short-term momentum has improved.
However, the pair remains capped by the descending trendline around 162.30–162.40, where sellers have repeatedly stepped in.
A breakout from the triangle will likely determine the next directional move.
----------------
SELL USDJPY zone : 162.350 - 162.500
SL : 162.750
TP : 162.000 - 161.700 - 161.300
------------------
2. EMA & RSI
EMA9 is slightly above EMA89, suggesting improving short-term momentum.
RSI is near 50, indicating a neutral market with no strong momentum.
A breakout above 162.40 would favor buyers, while a break below 161.80 would strengthen the bearish case.
Economic Outlook (USD/JPY)
USD/JPY is primarily influenced by:
Federal Reserve policy and U.S. economic data
Strong U.S. CPI, NFP, Retail Sales, or hawkish Fed comments generally support the USD and lift USD/JPY.
Weak data or expectations of Fed rate cuts tend to pressure the pair lower.
Bank of Japan (BoJ) policy
Any signals of further rate hikes or tighter monetary policy typically strengthen the JPY and weigh on USD/JPY.
A dovish BoJ stance tends to weaken the yen and support the pair.
U.S. Treasury yields
Rising Treasury yields usually push USD/JPY higher.
Falling yields generally support the yen.
Risk sentiment
During periods of market uncertainty, demand for the safe-haven JPY often increases, putting downward pressure on USD/JPY.
Title: EUR/USD Bullish Continuation Toward Key Resistance
EUR/USD on the **1-hour timeframe** is showing signs of a bullish continuation after successfully recovering from a prolonged downtrend. Price has broken above the descending structure and is now trading above the Ichimoku cloud, indicating improving bullish momentum.
The recent consolidation near **1.1440–1.1450** suggests buyers are defending this area before attempting another leg higher. As long as the price remains above the cloud and nearby support, the bullish outlook remains valid.
The marked resistance levels are likely to act as the next upside objectives. A successful breakout above the first resistance could accelerate buying pressure toward the higher supply zone.
### **Bullish Targets**
* 🎯 **Target 1:** **1.1474**
* 🎯 **Target 2:** **1.1511**
### **Key Support**
* **Support Zone:** **1.1330 – 1.1340**
* Immediate support is around **1.1440** (Ichimoku cloud area).
### **Trading Outlook**
A sustained hold above **1.1440** keeps the bullish scenario intact. A break above **1.1474** would confirm continuation momentum and open the path toward **1.1511**, where a stronger resistance zone is expected. However, losing the cloud support may trigger a pullback before the next bullish attempt.
**Bias:** 🟢 **Bullish**
**Targets:** **1.1474 → 1.1511**
**Invalidation:** A decisive break below **1.1440** increases the probability of a deeper retracement.
AUDCHF: Short-Term Bullish SetupAUDCHF: Short-Term Bullish Setup
AUDCHF looks like completed a small Inverse Head and Shoulders pattern on the 60 min chart.
The trend is bullish on this time frame so the odds are that AUDCHF may rise as shown on the chart for another short-term bullish movement.
Short-Term Targets:
0.56530
0.5663
You can find more details on the chart.
Thank you and good luck! 🍀
⚠️PS: Do your own analysis and use your own strategy to join the trade.
❤️ If this analysis helps your trading day, please support it with a like or comment ❤️
Q3 | W29 | D16 | Y26 | +3% AUDUSD BREAKDOWN📈| Q3 | W29 | D16 | Y26 | +3% AUDUSD BREAKDOWN📊 TECHNICAL BREAKDOWN💡| FRGNT DAILY CHART ANALYSIS |
This forecast is built using an advanced adaptation of Smart Money Concepts, with a structured and disciplined approach:
• Marking Key Points of Interest (POIs) on Higher Time Frames (HTFs) 🕰️
• Defining a clear, controlled trading range from those zones 📐
• Refining entries on Lower Time Frames (LTFs) 🔎
• Waiting for confirmed Break of Structure (BoS) before execution ✅
This process ensures precision, removes emotional decision-making, and keeps me aligned with the overall market narrative.
💡 Core Philosophy
“Capital management, discipline, and consistency create longevity.”
A strong risk-to-reward model, paired with high-probability execution, is the foundation of sustainable trading 📈🔐
⚠️ Understanding Losses
"Losses are part of the game" — a mathematical certainty 🎲
They don’t define performance. Nor do they define you as a Trader.
They are managed, reviewed, and used as evidence for growth 📊
🙏 Final Note
Appreciate you taking the time to review today’s forecast.
Stay disciplined 🎯
Protect your capital 🔐
— FRGNT 🚀📈
📌 Disclaimer
This content is provided for educational purposes only and does not constitute financial advice.
It reflects my personal approach to the markets — a tested framework that has supported my own journey toward consistent profitability in currency trading.
Please understand that any forecasts shared are not financial advice. I will be looking for confirmation in line with my setup model and specific entry criteria from the key areas identified on the chart.
All analysis, whether presented via image or video, is shared strictly for educational insight and is not intended to breach any TradingView House Rules.
CHFJPY: Why I'm Still WaitingOver the past few weeks I've been monitoring CHFJPY closely, and the more confluences I gather, the more interested I become in this market. While price hasn't triggered my entry yet, I believe the current structure deserves attention.
From a technical perspective, CHFJPY is developing an ascending structure after rejecting the June lows. Price is compressing beneath a higher-timeframe supply zone while respecting weekly demand, suggesting accumulation rather than distribution.
However, I'm not interested in buying at current prices.
The area I'm watching is the liquidity resting below the most recent swing low. A sweep into that liquidity would provide a much cleaner location for institutions to accumulate before any meaningful continuation higher.
If that liquidity is taken and the lower timeframe confirms with a bullish shift in market structure, I'll start looking for long opportunities targeting the daily supply around 201.90–202.60.
Commitment of Traders (COT)
The latest positioning continues to support the bullish case.
Swiss Franc (CHF)
Speculators remain net short overall, but recent data shows increasing long exposure together with short covering.
This often represents the early stages of positioning before a larger directional move.
Japanese Yen (JPY)
Large speculators are still heavily net short.
Although open interest contracted during the latest report, speculative positioning continues to reflect structural weakness in the Yen.
Seasonality
Seasonality also aligns with my current thesis.
Historically, the Swiss Franc tends to strengthen during the second half of July, while the Japanese Yen has shown relatively weaker historical performance over the same period.
Retail Sentiment
Retail traders remain heavily positioned against this market.
Current sentiment shows approximately 78% of traders are short CHFJPY.
I generally treat extreme retail positioning as a contrarian indicator. When combined with technical confluence and COT data, it adds another layer supporting a potential bullish continuation.
My Trading Plan
I'm not trying to predict the next move.
I'm waiting for the market to offer confirmation.
My ideal scenario is:
Liquidity sweep below the recent swing low.
Bullish market structure shift on the lower timeframe.
Long entry only after confirmation.
Targets into the daily supply around 201.90–202.60.
AUD/USD Bearish Breakdown with Recovery Target at 0.7016
AUD/USD remains under bearish pressure after breaking below a consolidation range and continuing its downward move beneath the Ichimoku cloud. The pair failed to sustain gains near the 0.7070–0.7090 resistance zone, leading to a sharp sell-off that pushed price toward the 0.6960 support area.
The highlighted range shows a period of consolidation before the bearish breakout. Price is currently trading in oversold territory, suggesting a potential corrective rebound toward the previous support-turned-resistance zone.
**Bullish Recovery Target:** **0.7016**
**Key Levels:**
* **Target:** 0.7016
* **Current Support:** 0.6960
* **Resistance Zone:** 0.7016 – 0.7030
* **Major Resistance:** 0.7070 – 0.7090
**Outlook:**
As long as AUD/USD holds above the recent low around 0.6960, a short-term recovery toward **0.7016** remains possible. However, the broader trend stays bearish while price trades below the Ichimoku cloud and key resistance levels.
USD/CAD Bearish Pullback Toward Trendline SupportUSD/CAD remains in a strong overall uptrend, supported by a rising trendline and the Ichimoku Cloud. After a sharp bullish breakout that pushed price into the 1.4180–1.4200 resistance zone, the pair is showing signs of exhaustion near resistance.
The chart highlights a potential corrective move from the current supply area, with price expected to retrace toward the ascending trendline and key support around **1.4080**. This level aligns with previous structure support and could attract buyers if the broader bullish trend remains intact.
As long as price stays above the rising trendline and the Ichimoku Cloud support, the pullback may be viewed as a healthy correction within the larger uptrend.
**🎯 Target:** **1.4080**
**Key Levels:**
* **Resistance:** 1.4180 – 1.4200
* **Pullback Target:** 1.4080
* **Trend Support:** Rising trendline below current price
**Bias:** Short-term Bearish Pullback | Long-term Bullish Trend Structure Remains Intact.
EUR/AUD Daily | The Silent Trendline Trap is LoadingPrice has been grinding higher in a classic bullish structure, but smart money just swept liquidity below the recent lows and is now respecting a clean ascending trendline.
Look at that orange demand zone sitting perfectly on the trendline, this is textbook SLP Confluence:
Structure: Higher highs & higher lows intact on the daily.
Liquidity Sweep: Recent wick below the lows (inducement done ✅).
POI + Trendline Retest: Fresh unmitigated order block / demand zone aligning beautifully with the trendline retest.
Displacement Potential: Rejection candle forming right at the zone.
Bias: Bullish continuation expected.
Key Level to Watch: 1.6500 (orange box), strong magnet.
Entry Idea: Long on LTF confirmation (15m/5m) at the trendline + POI zone around current levels ~1.6388.
Stop Loss: Below the recent low / trendline (~1.6300 area), tight thanks to confluence.
Targets: 1.6500 (first liquidity), then extend to 1.6700+ for runners.
RR: Minimum 1:2.5, very favorable.
This setup screams “smart money accumulation before the next leg up.” Trendline + POI magic never gets old.
What do you see here? Bullish continuation or fakeout? Drop your thoughts below
### **Title:** **EUR/USD Bullish Reversal After Descending ChanEUR/USD has confirmed a bullish reversal after breaking out of a well-defined descending channel that guided price lower over several sessions. The pair found strong buying interest at the highlighted support zone around **1.1330**, where buyers successfully defended the level and triggered a recovery.
Price has now reclaimed short-term structure and is attempting to build momentum above the Ichimoku cloud. Holding above the breakout area could attract additional buying pressure, opening the door for a continuation toward the next resistance.
**🎯 Bullish Target:** **1.1479**
**Key Levels:**
* **Support:** 1.1330–1.1340
* **Current Resistance:** 1.1400–1.1425
* **Target:** **1.1479**
A sustained move above the nearby resistance would strengthen the bullish outlook, while a break back below the support zone could invalidate the recovery scenario and shift momentum back to the downside.
#CHFJPY , Just a Follower !╭━━━━━━━━━━━╮
🌅 LONDON WATCHLIST
╰━━━━━━━━━━━╯
🎯 Target Pair: #CHFJPY
🩸 Risk Profile: High
👁 The Vision:
Same as #USDCHF , Same Condition .
Lets box it and might we do have a setup
As i reach my Monthly TP , rather to just watch it but if it be turn to Quality setup might take it as HighRisk Setup
📋 Tactical Plan:
↳ Condition A: Momentum strikes the POI.
↳ Condition B: LTF entry triggers ‼️
↳ Exit: Fast. No lingering.
#Ash_TheTrader #Scalping #Scalper
NZDUSD ejection candlesticks at the 61.8% Fib Overall Structure: The higher timeframe structure is heavily bearish, characterized by a series of lower highs and lower lows. The recent upward movement behaves as a textbook corrective leg within a macro downtrend.
Fibonacci Retracement: The corrective bounce perfectly tested the 61.80% Fibonacci golden pocket level. Price action is currently showing clear signs of rejection at this key resistance zone, confirming that sellers are defending the area.
RSI (Relative Strength Index): The RSI (14) has become overstretched/overbought during this minor rally, indicating that the immediate bullish momentum is exhausted and due for a reversal.
USDJPY may extend its gains, although intervention risks remain.USDJPY has the potential to extend its gains, although the uptrend is not without risk, as currency intervention remains possible.
Fundamental Analysis
1. US retail sales rose 0.2%, the GDP-linked control group gained 0.5%, and jobless claims fell to 208k. The resilient data reduced expectations for near-term Fed cuts, supporting Treasury yields and the dollar.
2. Although the BoJ raised rates to 1.00% and signalled further hikes, it stressed that financial conditions would remain accommodative and tightening would be cautious. Markets therefore expect the yield gap with the US to remain wide, supporting the dollar.
3. Higher oil prices have increased Japan’s import costs, weakening the trade balance, purchasing power, and growth outlook. Geopolitical risks have also boosted safe-haven demand for the dollar, while oil heads for a weekly gain of more than 11%.
Technical Analysis
4. USDJPY is forming an ascending triangle, a bullish continuation pattern, and is approaching the pattern’s apex. A breakout is more likely to occur to the upside and could provide a bullish follow-through signal.
5. However, a downside breakout could trigger a mean reversion toward the EMA before the price resumes its uptrend.
Analysis by: Krisada Yoonaisil, Financial Markets Strategist at Exness