King of the North promises to rebuild BritainDubbed the “King of the North,” Andy Burnham became the United Kingdom’s seventh prime minister in a decade on Monday, following the resignation of Keir Starmer.
For gilt investors and pound traders, attention will turn to whether the new government can deliver Burnham’s more interventionist economic agenda while maintaining control over public borrowing and spending.
“We will make this moment a circuit breaker for Britain, bringing forward a new political model and a new economic model,” Burnham said in his first speech as prime minister.
He pledged to build an economy that places essential services under stronger public control, while using public procurement to support British industry and accelerate the country’s reindustrialisation. He argued that Britain’s current problems were partly the result of decades in which economic power was transferred to the private sector.
Forex market
GBPAUD: Growth & Bullish Forecast
Remember that we can not, and should not impose our will on the market but rather listen to its whims and make profit by following it. And thus shall be done today on the GBPAUD pair which is likely to be pushed up by the bulls so we will buy!
Disclosure: I am part of Trade Nation's Influencer program and receive a monthly fee for using their TradingView charts in my analysis.
❤️ Please, support our work with like & comment! ❤️
USDCAD🚨 USDCAD 🚨
📉 Market Bias: DOWNTREND
The market remains in a bearish trend. Focus on SELL opportunities while following your trading strategy and wait for proper confirmation before entering. Avoid FOMO trades.
✅ Trend: Bearish
🎯 Focus: SELL
⚠️ Risk only 1–2% of your capital per trade.
📊 Trade with the trend, not against it.
Disclaimer: This is not financial advice. Always conduct your own analysis before making any trading decisions.
USD/CHF Idea🚨 USD/CHF Idea 🚨
📉 Market Bias: DOWNTREND
The market remains in a bearish trend. Focus on SELL opportunities while following your trading strategy and wait for proper confirmation before entering. Avoid FOMO trades.
✅ Trend: Bearish
🎯 Focus: SELL
⚠️ Risk only 1–2% of your capital per trade.
📊 Trade with the trend, not against it.
Disclaimer: This is not financial advice. Always conduct your own analysis before making any trading decisions.
EUR/USD: news flow leaning bearish — the net read
The wire has been busy on EUR/USD. Weighing the stories from the last 24h against each other — new against old, and tracking which ones have already faded:
−−− Dollar gains as US-Iran conflict intensifies; sterling gives back gains
−−− Gold falls toward $4,000 as US-Iran hostilities boosts Fed rate hike bets
−−− Market moving news for Asian trading: Oil jumps as US-Iran war spread, Hormuz tankers struck
−−− Euro bulls remain on the sidelines as USD gains on US-Iran tensions and inflation fears
−− Every time Iran kills an American Soldier they will pay for that killing many times over! This directive has been passed on to Secretary of War, Pete Hegseth, Chairman of the Joint Chiefs of Staff, Daniel Caine, and every Leader in the Military. President DONALD J. TRUMP
Net read: −−− leaning bearish — top of our scale.
What this is: a measure of which way the *news* is leaning right now — not a promise about price. Strong reads fade as the market digests them, and a fresh headline can flip the whole picture. That's exactly what we track.
The rule of this account: every read gets a public update once the market has had time to speak — the ones that landed and the ones that didn't. No deleted calls. Watch for the update on this idea.
(Informational only — not financial advice, not a signal.)
Bearish breakout for the cable?The price could rise towards the resistance level, which is an overlap resistance and could drop from this level to our take profit.
Entry: 1.3437
Why we like it:
There is an overlap resistance level.
Stop loss: 1.3538
Why we like it:
There is a pullback resistance level.
Take profit: 1.3342
Why we like it:
There is a pullback support level.
Enjoying your TradingView experience? Review us!
Please be advised that the information presented on TradingView is provided to Vantage (‘Vantage Global Limited’, ‘we’) by a third-party provider (‘Everest Fortune Group’). Please be reminded that you are solely responsible for the trading decisions on your account. There is a very high degree of risk involved in trading. Any information and/or content is intended entirely for research, educational and informational purposes only and does not constitute investment or consultation advice or investment strategy. The information is not tailored to the investment needs of any specific person and therefore does not involve a consideration of any of the investment objectives, financial situation or needs of any viewer that may receive it. Kindly also note that past performance is not a reliable indicator of future results. Actual results may differ materially from those anticipated in forward-looking or past performance statements. We assume no liability as to the accuracy or completeness of any of the information and/or content provided herein and the Company cannot be held responsible for any omission, mistake nor for any loss or damage including without limitation to any loss of profit which may arise from reliance on any information supplied by Everest Fortune Group.
CADJPY - Bearish BatCADJPY has completed a bearish harmonic structure near the 0.886 XA retracement, with price reacting from the D-zone around major resistance. The pair is currently attempting to push back upward after the initial rejection, but it remains below the main resistance/PRZ area.
In relation to the volume profile, price is trading near the upper portion of value, with heavier volume below acting as a potential magnet if rejection continues. RSI is rising back toward the upper range, so momentum is currently recovering, but this zone still requires caution because price is approaching a prior rejection area.
Overall, this is a bearish reversal watch, not an automatic short. The key is whether price rejects again near resistance or breaks and holds above the D/PRZ zone.
USDCHF sideways consolidation resistance at 0.8137USDCHF continues to trade within the broader prevailing trend, with recent price action showing signs of a corrective pullback phase.
Key Level: 0.8025
This area previously acted as a consolidation zone and is currently being monitored as a notable support level.
Scenario Above 0.8025
If price remains above 0.8025, market structure may continue to reflect near-term upside pressure. In this context, the following levels may act as reference resistance areas:
0.8137 – Initial resistance
0.8170 – Psychological and structural level
0.8207 – Extended resistance on the longer-term chart
Scenario Below 0.8025
A sustained move and daily close below 0.8025 would indicate a shift in the current short-term structure. In that scenario, the following levels may become relevant on the downside:
0.7990 – Minor support
0.7957 – Stronger support and potential demand zone
Conclusion
USDCHF remains near an important technical area, with 0.8025 acting as a key reference level for the current price structure. Price behaviour around this zone may help determine whether the market continues within the recent uptrend phase or transitions toward further downside continuation.
The information provided does not constitute investment advice nor take into account the individual financial circumstances or objectives of any investor. Any information that may be provided relating to past performance is not a reliable indicator of future results or performance. To the extent permitted by law, in no event shall Trade Nation (or any affiliate or employee) have any liability for any loss arising from the use of the information provided. Any person acting on the information does so entirely at their own risk. Any information which could be construed as “investment research” has not been prepared in accordance with legal requirements designed to promote the independence of investment research and as such is considered to be a marketing communication.
CFDs are complex instruments and come with a high risk of losing money rapidly due to leverage. 73.1% of retail investor accounts lose money when trading CFDs with this provider. You should consider whether you understand how CFDs work and whether you can afford to take the high risk of losing your money.
AUDCHF Bearish BatAUDCHF is approaching completion of a Bearish Bat harmonic pattern near the ideal 0.886 XA retracement, aligning with a major resistance zone and the upper high-volume area of the profile.
Price is pushing into the PRZ while RSI is elevated, suggesting momentum is strong but nearing a potential exhaustion area.
This zone is worth watching closely for bearish rejection, especially if price fails to hold above the 0.5760–0.5770 resistance region.
USDCAD: 50% Fibonacci Level tested– Is Another Leg Lower Coming?The sharp USD/CAD selloff that began after softer U.S. inflation data and resilient Canadian fundamentals has now reached another important technical decision point.
After breaking below the ascending channel and turning former support into resistance, price has continued respecting the bearish structure. The market is now consolidating around the 50% Fibonacci retracement, suggesting that sellers remain in control while buyers attempt to stabilize the decline.
From my perspective, the broader thesis remains intact: fundamentals are setting the direction, while technicals determine the timing.
Macro Picture
Last week provided several major catalysts:
• Softer U.S. CPI and PPI reduced expectations of aggressive Federal Reserve tightening.
• The Bank of Canada kept interest rates unchanged, citing economic uncertainty rather than signalling imminent easing.
• Canada's resilient labour market continues to provide underlying support for the Canadian dollar.
With those events now priced in, this week's focus shifts toward whether fresh data can validate the current trend or trigger a correction.
Technical Structure
The chart continues to respect bearish market structure.
Key observations:
Price remains below the broken ascending channel.
Previous support around 1.4140–1.4150 has become resistance.
The 38.2% Fibonacci level failed to hold.
Price is now consolidating around the 50% Fibonacci retracement near 1.4000.
The Stochastic RSI has recovered from oversold territory, indicating bearish momentum is slowing, but there is not yet a confirmed bullish reversal.
At this stage, the move looks more like bearish consolidation than trend exhaustion.
Levels I'm Watching
Resistance
1.4050 (38.2% Fibonacci)
1.4140–1.4150 (former support, now resistance)
Support
1.4000 (50% Fibonacci)
1.3950 (61.8% Fibonacci)
1.3900 (major historical support zone)
A sustained break below the 50% retracement would increase the probability of price extending toward the 61.8% Fibonacci level, where I expect stronger buying interest to emerge.
Trading Advantage™ Framework
USD/CAD Macro Score™ (UMS): 30/100 🔴
U.S. Dollar: Soft
Canadian Dollar: Supported
Technical Structure: Bearish
Overall Bias: Bearish
Market Risk Meter™ (MRM): 🟡 Moderate Markets are transitioning from reacting to last week's data toward positioning for the next macro catalysts, which may increase volatility as new information emerges.
My Trading Plan
I'm not interested in chasing price after an extended move lower.
Instead, I'll continue watching how price behaves around the current Fibonacci support. If sellers remain in control, the next objective becomes the 61.8% retracement. If buyers reclaim the 38.2% level and hold above it, that would be the first sign that a deeper correction may be developing.
As always, fundamentals provide the directional bias, while technical analysis determines the entries and exits.
The Trading Advantage™
"The highest-probability trades come from waiting for the market to confirm your thesis not from predicting every move."
EUR/USD — Sellers taking control again?
🔥EUR/USD is showing renewed selling pressure after failing to sustain its recent recovery. Price remains inside the broader range, but momentum has shifted toward the downside as buyers continue to struggle below the major resistance zone.
📈 Bullish scenario
A strong breakout above the upper supply zone would invalidate the current bearish pressure and could trigger a continuation toward higher prices.
📉 Bearish scenario
If the current support zone fails to hold, sellers may push the pair toward the next demand levels below. Until a bullish breakout occurs, downside pressure remains the dominant scenario.
For now, the market is trading between key support and resistance, making these zones the most important areas to monitor before expecting the next impulsive move.
EUR/JPY weekly trade analysis: 20–24 July 2026EUR/JPY retains a bullish higher-timeframe trend, but the immediate structure points towards consolidation or a corrective decline before another sustained advance.
Price remains above the four-hour 55 and 200 EMAs, while four-hour and hourly OBV remain above their respective 200-period averages. This confirms that the broader accumulation structure has not broken. However, price has fallen below the short-term EMA cluster on the hourly and 15-minute charts. The 15-minute OBV is also below its 200-period EMA, showing that intraday participation is no longer supporting the recent advance.
The preferred setup is a conditional short following rejection from 185.65–185.75. This is a tactical retracement trade inside a broader bullish trend. The bearish case loses validity following sustained hourly acceptance above 185.80–185.90.
EUR/JPY sits between two competing macro forces.
The euro could receive support from an ECB hold accompanied by concern about energy-driven inflation. Higher European front-end yields would preserve the euro’s rate advantage over the yen. However, Europe’s exposure to elevated oil prices creates a growth and terms-of-trade headwind.
The yen remains vulnerable to Japan’s low-yield environment, but the global backdrop increases the probability of safe-haven demand. Renewed equity weakness, weaker global PMIs or an escalation in geopolitical risk would support the yen and pressure EUR/JPY. EUR/JPY is also exposed to intervention spillover. Japanese intervention would most likely target USD/JPY directly, but broad yen buying could transmit quickly into this cross.
The macro balance therefore supports a near-term EUR/JPY correction, while the larger interest-rate differential continues to limit the conviction of aggressive short positions.
Expectation
Entry zone: 185.66–185.73
Stop-loss: 185.94
Take-profit 1: 185.44
Take-profit 2: 185.20
Take-profit 3: 184.92
Precaution rebound
Entry level: 185.581
Stop-loss: 185.199
Take-profit 1: 185.728
Market Structure Read | Building ContextIn this EURUSD Market Structure Read, the objective is to understand the current market environment before thinking about execution.
The focus is not on predicting where price will go or providing a trading signal.
Instead, this breakdown explains how we build context by starting with the higher timeframe and working down through the lower timeframes to understand structure, key reaction areas and market behaviour.
Every analysis begins with the same question:
Where is price positioned within the larger market structure?
Only after understanding that context do we look for confirmation on the lower timeframe.
The process discussed in this video follows these principles:
• Higher timeframe context
• Market structure
• Key reaction areas
• Lower timeframe confirmation
• Risk before execution
No single candle or timeframe should be viewed in isolation.
The goal is to understand how the market is organised before making any trading decisions.
Educational content only. Not financial advice. Past performance does not guarantee future results.
GBPAUD Technical Analysis – Bullish Reversal Setup📊 GBPAUD Technical Analysis – Bullish Reversal Setup 🚀
GBPAUD is approaching a high-probability bullish reaction zone after a controlled decline into a key Fair Value Gap (FVG) and Order Block (OB). Price is currently testing an important demand area where buyers could regain control.
🔍 Market Structure
🟢 Price is entering the FVG, offering potential liquidity for buyers.
📦 The Order Block below provides strong institutional support.
🔄 A short-term dip into the OB is possible before a bullish reversal.
📈 Holding above the demand zone would strengthen the case for continuation higher.
🎯 Bullish Scenario
✅ Wait for bullish confirmation inside the OB/FVG region.
🚀 A successful rebound could target the 1.9310 – 1.9325 area first.
🎯 Extended upside may challenge the 1.9360 resistance if buying momentum increases.
⚠️ Risk
A decisive close below the Order Block would weaken the bullish outlook and could trigger a deeper decline toward the lower support zone.
💡 Bias: Bullish while price respects the Order Block and Fair Value Gap support. 📈
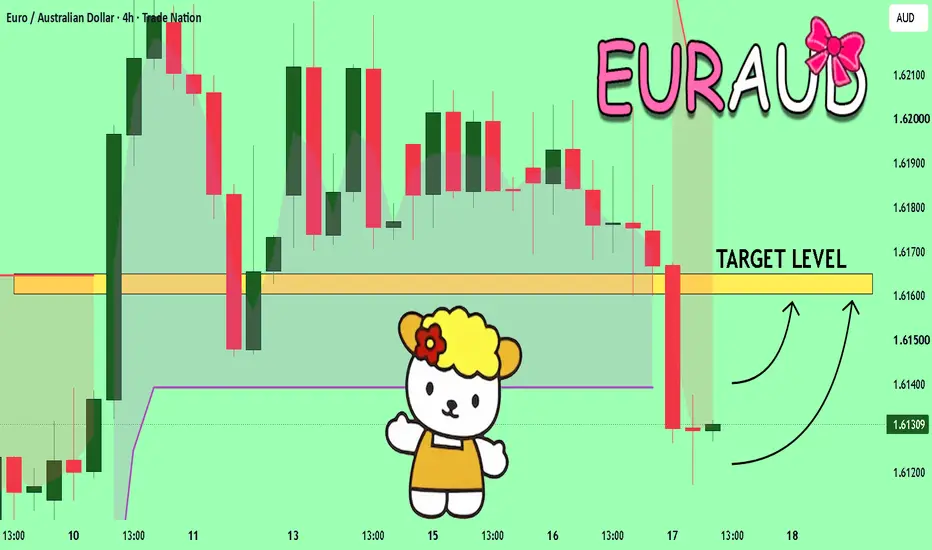
EURAUD UPDATEEUR/AUD remains in a clear bearish trend, with price continuing to form lower highs and lower lows after repeated rejections from key supply zones. The recent pullback failed to break resistance, allowing sellers to regain control and push the pair back toward the current support level. If bearish momentum continues, a confirmed break below support could open the way for a move toward the 1.6200 area in the coming sessions. As long as price remains below the highlighted resistance zone, the overall outlook favors further downside.
GBP/USD | FVG and Supply Zone retestBy examining the 4H chart of GBPUSD we can see that by reaching the 1.3558 level, it swept away all the liquidity pools on its way, broke above the supply zone, and then after testing the 4H FVG, it dropped all the way to an old supply zone, and after reaching it, it bounced back up from 1.3446 to 1.3481, and is currently being traded at around 1.3461 level.
Same as other pairs, Cable is also under the influence of the war between US-IR, which has strengthened the USD, causing massive dropdowns. As long as the war continues and the end or another ceasefire has not been announced, this situation continues.
Now I expect GBPUSD to retest the 4H FVG once more, should it break above it, I'd expect it to go towards the Supply Zone to retest it once more, and then a move towards the 1.3558 to sweep the minor BSL there, as well as retesting the FVG between the 1.3553 to 1.3580 levels.
However, if GBPUSD is rejected by the 4H FVG at 1.3480 to 1.3493 level, it can drop back again towards the old supply zone, if then it doesn't stabilize above the supply zone, further drop towards the 4H FVG High at 1.3384 is expected.
EURUSD H1 — Short-Term Bearish SetupEURUSD is reacting from the 1.1430 area, and we are watching for a possible move lower while price remains below 1.1450–1.1452.
As long as this resistance holds, the pair may continue toward 1.1418 first, with a possible extension to 1.1405.
Invalidation: Above 1.1452
Targets: 1.1418 and 1.1405