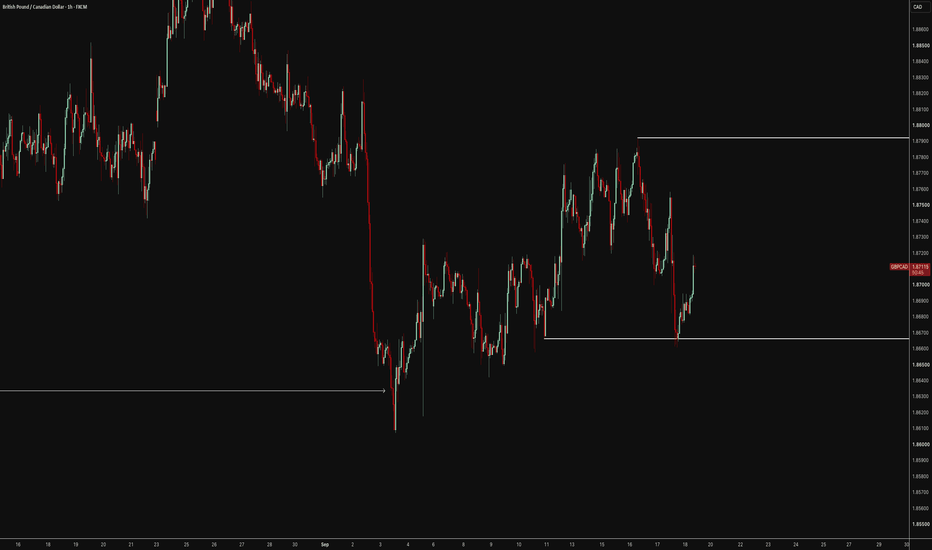
GBPUSD REPEATATION OF STRUCTUREGBPUSD is currently testing a key demand zone after breaking down from a rising wedge pattern.
The ascending trendline failed to hold, and sellers pushed the price directly into an important support area. This is where patience becomes critical.
I'm not looking to buy immediately. Instead, I want to see a clear bullish confirmation—such as a bullish engulfing candle, strong rejection wick, or another reliable reversal pattern—before considering any long position.
If buyers step in and defend this zone, we could see a relief move back toward the previous structure. However, if this demand area fails to hold, the bearish momentum may continue and open the door for lower prices.
Wait for confirmation.
Let price reveal its intention.
Trade the reaction, not the prediction.
Forex market
EURCAD - Bearish BatEURCAD is approaching the completion of a Bullish Bat harmonic pattern near the ideal 0.886 XA retracement, aligning with a major demand zone and lower volume-profile support area.
Price has been rotating lower from the C-point with weakening downside momentum, while RSI is nearing oversold conditions.
This PRZ around the lower support zone is a key area to watch for bullish rejection and reversal confirmation.
AUDJPY Very Strong Uptrend!
HI,Traders !
#AUDJPY is trading in a
Very strong uptrend and
The pair broke a key horizontal
Level around 113.429 which
Is now a support and we
Are already seeing a rebound
So we are bullish biased
And we will be expecting
A further move up !
Comment and subscribe to help us grow !
GBPUSD: Support at 1.3420 Keeps Buyers in ControlFollowing a sharp pullback from the 1.3550 area, GBPUSD found buying interest around 1.3420—a level where the EMA34, EMA89, and an H4 demand zone converge. Price is currently consolidating just above this support, indicating that buyers are absorbing selling pressure rather than allowing the bullish structure to break.
If the 1.3420 level holds, GBPUSD could rebound toward the 1.3550 area, where the nearest supply zone is located. Underlying positive momentum for the GBP also supports this scenario.
Strategy: Prioritize BUY positions around 1.3420, targeting 1.3550. The bullish scenario is invalidated if the price closes below 1.3420 on the H4 timeframe.
EUR/USD Breakout Setup – Buyers Target Higher Resistance EUR/USD has broken above a key resistance around 1.1420, turning that level into potential support. As long as price stays above it, buyers appear to have the upper hand.
I’m now watching for a continuation toward the 1.1450 resistance zone, where price has previously been rejected. That’s my current TP area.
Australian Dollar / US Dollar ($AUDUSD) Daily: Dynamic LTA Australian Dollar / US Dollar ( OANDA:AUDUSD ) Daily: Dynamic LTA & 200-EMA Defense Fuels Bullish Reversal Wave
### 🇦🇺🇺🇸 Australian Dollar / US Dollar ( OANDA:AUDUSD ) Daily Technical Framework (Ref: AUDUSD_2026-07-21_08-48-25.png)
We are releasing a structural trend-following study on the Australian Dollar / US Dollar ( OANDA:AUDUSD ) currency pair on the Daily (1D) interval. Following a strong multi-month corrective sequence from its May peak at 0.72643, the Aussie dollar has printed a textbook bullish defense against its long-term baseline.
The pair is building upward momentum today, trading up at **0.70178 (+0.27%)**, actively testing immediate structural resistance.
---
### 🔍 Technical Architecture & Support Confluence:
Our quantitative framework highlights a major structural higher low grounded by a powerful multi-layer support matrix:
1. **The Primary Ascending Support Baseline (LTA):** The macro diagonal support trendline (black diagonal LTA) originating from early 2026 remains fully validated. Price action respected this boundary with extreme precision during the recent July dip.
2. **The Institutional 200-EMA Cushion:** The pullback bottomed out precisely as it collided with the **200-period EMA (purple line sitting at 0.69127)**, which confluenced cleanly with the static support shelf at **0.68771**.
3. **Immediate Resistance Challenge:** Buyers are currently pushing against the immediate horizontal pivot level at **0.70243** (the middle red horizontal baseline).
---
### 🚀 The Expansion Projection (Blue Vector)
As mapped by our technical blue upward-tracking vector, clearing current localized supply sets up a major recovery sequence:
* **The Breakout Trigger:** A decisive daily candle close above **0.70243** will confirm a structural trend continuation, signaling buy-side dominance over the short-term pullback.
* **Intermediate Dynamic Target:** The first upside objective sits at the **72-period SMA cluster (tracked between 0.70770 and 0.70850)**.
* **Macro Supply Destination:** Sustaining momentum above the 72-SMA ribbon unlocks the technical path toward a full retest of the major structural high at **0.72643** (upper red horizontal baseline).
### 📊 Tactical Trading Parameters:
* **Current Bias:** Strongly Bullish (Trend Reversal & Continuation)
* **Immediate Barrier:** 0.70243
* **Intermediate Target:** 0.70770 – 0.70850 (72-SMA Cluster)
* **Macro Target:** 0.72643 (Major All-Time High Resistance)
* **Risk Invalidation Anchor:** Daily Close below 0.68771 / 200-EMA Corridor
---
📊 **ChartPro Data**
*FX Market Architecture, Structural Higher Lows & Trend Continuity Frameworks.*
⚠️ **Disclaimer:** For educational and informational purposes only. This active market study represents a personal trading framework and does not constitute financial or investment advice.
NZDUSD Bullish Setup: Demand Zone Supports ContinuationOANDA:NZDUSD is trading inside a clear ascending channel, keeping the broader bullish structure intact. Price continues to form higher highs and higher lows, while the recent pullback looks more like a healthy correction than a change in trend.
Price is now retesting a key support zone around 0.5850, where previous resistance is beginning to act as support. If buyers continue to defend this area, the next bullish leg could extend toward the 0.5935 target, near the upper boundary of the channel.
As long as price holds above the support zone and the ascending trendline, the bullish outlook remains valid. A decisive break below this structure would weaken the setup and increase the risk of a deeper correction.
Always wait for confirmation and manage your risk properly.
Best of luck!
AUDUSD H4: Support Keeps Bulls AliveAUDUSD continues to maintain its bullish structure after forming a base and moving within an ascending price channel. The pair is currently making a modest pullback toward the 0.7000–0.7005 support zone, where short-term support converges with the rising trendline, indicating that buyers are still defending the current uptrend.
If this support area continues to hold and bullish confirmation appears, AUDUSD could resume its upward move and retest the 0.70690–0.70700 resistance zone. This is a key level that will determine whether the bullish momentum can extend further.
Entry focus: Prefer Buy positions around 0.7000–0.7005 once bullish confirmation is confirmed.
Target: 0.70690–0.70700
Invalidation: A clear H4 candle close below the lower boundary of the ascending channel would indicate that the short-term bullish structure has been broken.
AUDUSD 15 MIN SELL 15-minute trendline break to the downside, followed by a clean retest and rejection. Entering sells here, with the stop loss above the previous highs. Further confirmation comes from a key higher-timeframe resistance area and clear bearish MACD divergence.
Stop Loss: 0.70176
Take Profit: 0.69664
AUDUSD H4 | The Breakout Everyone Was Waiting For? # AUDUSD H4 | The Breakout Everyone Was Waiting For? 👀📈
After weeks of respecting a descending trendline, AUDUSD is finally knocking on the door.
This isn't just another resistance test—it's a potential market structure shift that could define the next swing.
🔍 Here's what caught my attention:
✅ Descending trendline under pressure
✅ Bullish continuation pattern formed after a strong impulsive move
✅ Higher lows suggest buyers are gaining control
✅ Price is testing a key breakout zone with momentum building
📊 My Scenarios
🟢 Bullish Case A decisive close above the descending trendline could trigger the next expansion phase, opening the path toward 0.7040 and potentially 0.7110.
🔴 Bearish Case If sellers reject this level again, expect a pullback toward the demand zone before buyers attempt another breakout.
💡 The biggest moves don't begin with FOMO—they begin with confirmation. Let the market prove itself before pulling the trigger.
❓What's your bias?
👍 LIKE if you see a breakout.
💬 Comment "BUY" if you think AUDUSD is heading higher, or "SELL" if you believe this is another bull trap.
I read every technical opinion—let's discuss the chart.
Follow for more high-probability price action analysis, trendline setups, and market structure breakdowns.
#AUDUSD #Forex #TradingView #TechnicalAnalysis #PriceAction #ForexTrading #SwingTrading #ChartAnalysis #SmartMoney #Breakout #TrendTrading #PulseTradesFX
Precision setups. Smart execution. PulseTradesFX.
Here’s what’s next for EURUSDEURUSD is preparing for another downward move.
The HTF structure has not changed since the last analyses and is developing exactly in line with our analysis.
At the LTF , the structure becomes more interesting, as the waves support the HTF trend. We are currently in an expansion of Wave 3 (blue), and the sub-waves of this Wave 3 correspond to our orange count. There, we can see that we recently experienced a Wave 4 correction that formed in an wxy pattern, and the price has already reacted strongly to the 61.80% Fibonacci level.
We now expect the market to transition into a downward Wave 5. As soon as we have more confirmation that Wave 4 has ended, we will take a short position.
EURUSD STILL ON A BULLISH BIAS CREATING A RETEST ON OUR 71 FIBEURUSD ON A BULLISH BIAS CREATING A RETEST ON OUR 71 FIB LEVEL FOR A REVERSAL ENTRY A TRADE WITH A 2.5 REWARD RATIO...ill keep you updated if the price rejects our level we take our entrys at the 15min time frame after a change of structure or the market structure shift
GBPJPY: Buyers Successfully Defend the 218.40 LevelGBPJPY maintains its bullish trend as the price continues to move within an ascending channel on the H4 timeframe. Following a pullback from the 219.60–220.00 resistance zone, selling pressure has significantly waned; the price reacted positively at the 218.40 support area—which aligns with the channel's lower boundary and the Ichimoku Cloud. This indicates that buyers retain control of the primary structure, preventing a shift to a bearish trend.
Notably, the recent correction did not break any key lows, and recent candlesticks have consistently held above the support zone. If the price continues to form higher lows and reclaims the 219.70–220.00 area, bullish momentum could quickly return, targeting the 220.90 level.
Fundamentally, the British Pound remains supported by positive sentiment regarding the UK economy, while the Yen faces pressure as the Bank of Japan (BOJ) maintains a cautious stance. This dynamic continues to favor GBPJPY in the short term.
Strategy: Prioritize BUY positions around 218.40 upon a bullish confirmation signal; target 220.90.
Title: EUR/USD Bearish Triangle Breakdown Setup**
EUR/USD is trading inside a **symmetrical triangle**, signaling a period of consolidation after recent price fluctuations. The pair is approaching the apex of the pattern, where a breakout is expected. Based on the current market structure and the bearish projection shown on the chart, a downside breakout could trigger increased selling pressure.
A confirmed candle close below the triangle's lower trendline would strengthen the bearish bias and may open the way for a continuation toward the highlighted support area. Traders should wait for breakout confirmation before considering bearish positions, while keeping an eye on false breakouts around the pattern.
**🎯 Target:** **1.13822**
NZD/USD Holds Strong – Can Bulls Reach 0.5940?NZD/USD Holds Strong – Can Bulls Reach 0.5940?
From our previous analysis, NZDUSD reached the first target near 0.5855 and the price started to rally again.
It seems that the price is well positioned to rise further from this area considering that the bullish trend has not changed all these days.
On the other hand, NZD continues to hold strong the bullish momentum created after the RBNZ meeting. With or without a strong reason, this is another topic, but NZD could recover again.
The question is only what market catalyst can create this move.
Targets:
0.5900
0.5940
You can find more details on the chart.
Thank you and good luck! 🍀
⚠️PS: Do your own analysis and use your own strategy to join the trade.
❤️ If this analysis helps your trading day, please support it with a like or comment ❤️
20.07.26 Daily ForecastPairs on Watch -
FX:EURUSD : This pair is moving very nicely for the sells off the back of last week and the correlation with the DXY is also looking clean. Once the DXY finds its base, this pair will likely be tapping into either value area for sells. We have to be ready that it could sell early especially going into London session and may not reach the higher value area, but either way I am looking for an insurance entry if price provides one.
FX:GBPUSD : Price has tapped into a value area on the left in the form of a 123 reversal pattern and already started to sell from the area. A clear hook point has been left for us to use as a reference for price to tap back into a provide a simple insurance entry. This would allow the DXY to find its base before heading long. A 1H impulse followed by a small stack of price for the sells.
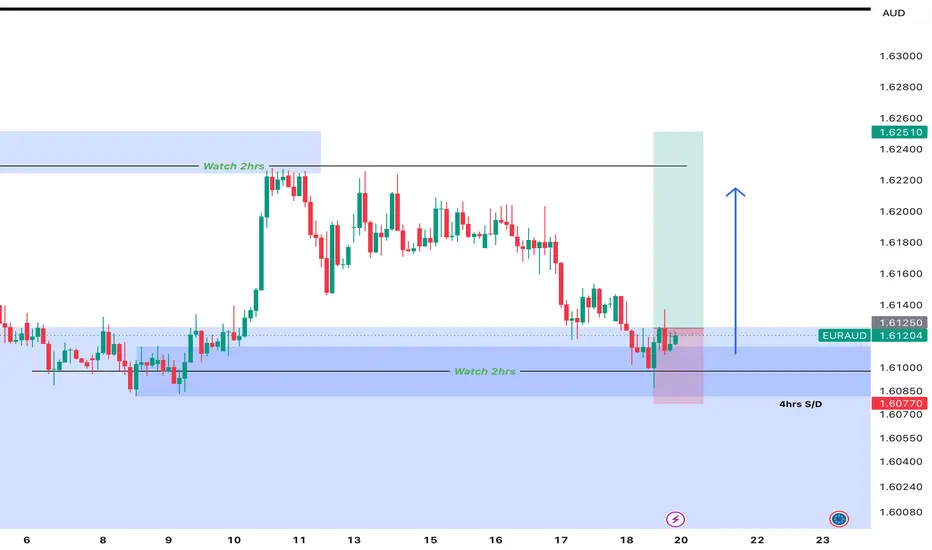
FX:EURAUD : We can see the move down from the larger structure has not been the most impulsive, but where price is positioned we can still take advantage of the higher timeframe bearish run we are currently in. Right now price is trading underneath the lows to the left, so any 15M structure that forms here I am more than happy to look for a risk entry short and protect stops above the lows to the left.
NZDCHF: Overbought Market & Pullback 🇳🇿🇨🇭
NZDCHF will likely retrace from a key historical resistance level.
A bearish choch on an hourly time frame provides a strong confirmation
of the overbought state of the market.
Goal - 0.4739
❤️Please, support my work with like, thank you!❤️
I am part of Trade Nation's Influencer program and receive a monthly fee for using their TradingView charts in my analysis.
| GBPUSD | ASIA RANGE SHORT | Q3 | W30 | D21 | Y26 | 📈| Q3 | W30 | D21 | Y26 | FRGNT DAILY CHART ANALYSIS
📊| GBPUSD | ASIA RANGE SHORT AVAILABLE
This forecast is built using an advanced adaptation of Smart Money Concepts, with a structured and disciplined approach:
• Marking Key Points of Interest (POIs) on Higher Time Frames (HTFs) 🕰️
• Defining a clear, controlled trading range from those zones 📐
• Refining entries on Lower Time Frames (LTFs) 🔎
• Waiting for confirmed Break of Structure (BoS) before execution ✅
This process ensures precision, removes emotional decision-making, and keeps me aligned with the overall market narrative.
💡 Core Philosophy
“Capital management, discipline, and consistency create longevity.”
A strong risk-to-reward model, paired with high-probability execution, is the foundation of sustainable trading 📈🔐
⚠️ Understanding Losses
"Losses are part of the game" — a mathematical certainty 🎲
They don’t define performance. Nor do they define you as a Trader.
They are managed, reviewed, and used as evidence for growth 📊
🙏 Final Note
Appreciate you taking the time to review today’s forecast.
Stay disciplined 🎯
Protect your capital 🔐
— FRGNT 🚀📈
📌 Disclaimer
This content is provided for educational purposes only and does not constitute financial advice.
It reflects my personal approach to the markets — a tested framework that has supported my own journey toward consistent profitability in currency trading.
Please understand that any forecasts shared are not financial advice. I will be looking for confirmation in line with my setup model and specific entry criteria from the key areas identified on the chart.
All analysis, whether presented via image or video, is shared strictly for educational insight and is not intended to breach any TradingView House Rules.
FX:GBPUSD