USD/CAD Pullback Tests Rising Trend SupportUSD/CAD remains in a broader bullish structure on the daily chart, although recent price action shows a clear loss of short-term momentum after rejection from the 1.4200–1.4250 region.
Price has pulled back beneath the 1.41405 resistance level and is now approaching an important confluence zone around 1.39670. This area combines prior horizontal resistance-turned-support with the rising 50-day SMA near 1.3993. Holding above this region would preserve the sequence of higher lows and keep the medium-term structure constructive.
The moving averages continue to support a broader bullish bias. The 50-day SMA remains above the 200-day SMA, while both averages are trending upward. Price also remains well above the 200-day SMA near 1.3854, suggesting that the current decline is still a correction within the larger advance rather than a confirmed trend reversal.
Momentum indicators are more cautious. The MACD line has crossed below its signal line and is declining toward the zero level, reflecting weakening upside momentum. RSI has also retreated from overbought territory to approximately 45, placing it in neutral-to-bearish territory without yet reaching oversold conditions.
Overall, the chart presents a neutral-to-moderately bullish medium-term bias, with 1.39670 and the 50-day SMA acting as the key technical test. A sustained recovery above 1.41405 would indicate renewed strength, while a decisive breakdown below the support confluence would weaken the existing bullish structure.
-MW
Forex market
EURUSD Reversal: Will It Crash Past the IDM Floor?Euro / U.S. Dollar is demonstrating strong structural distribution on the H1 timeframe successfully building a localized bearish reversal matrix away from its premium resistance block based on the technical layout in image_fed8c9.jpg.
Following a definitive defense of the macro upper baseline the immediate price action has cleared localized internal structures with aggressive downward expansion blocks and is now executing a highly efficient technical retest of the broken liquidity zone.
Global Context
The broader financial spectrum continues to navigate intense structural volatility forcing massive capital relocations between safe haven assets and premium dollar matrices ahead of key economic data releases.
Smart money has perfectly engineered this technical ceiling to trap overeager breakout buyers at the absolute market top before initiating a high velocity downward impulse wave.
This temporary upward correction behaves like a classic liquidity engineering mechanism pulling price action directly back into the 1.14450 1.14500 POI zone to mitigate institutional orders and capture early long stops before an aggressive supply wave expands straight toward Target 1 and Target 2.
Technical Playbook
The Bias Short Term Bearish Retest / Medium Term Structural Expansion we are strictly focused on tracking this dynamic supply ceiling to ride the multi stage downward delivery corridor.
The Main Horizons tactical execution focal points are locked directly on the 1.14450 1.14500 POI block and the 1.14200 IDM Target 1 liquidity array shown in image_fed8c9.jpg.
The Target Path following the structural layout price action is projected to surge into the lower POI first before executing a sharp secondary downward expansion leg straight through the IDM zone toward the primary premium demand floor at Target 2 where heavy historical buyers rest.
Invalidation the entire bearish reversal framework is instantly invalidated if the market breaks convincingly above the critical protection ceilings down through the upper structural POI block.
GBPUSD REPEATATION OF STRUCTUREGBPUSD is currently testing a key demand zone after breaking down from a rising wedge pattern.
The ascending trendline failed to hold, and sellers pushed the price directly into an important support area. This is where patience becomes critical.
I'm not looking to buy immediately. Instead, I want to see a clear bullish confirmation—such as a bullish engulfing candle, strong rejection wick, or another reliable reversal pattern—before considering any long position.
If buyers step in and defend this zone, we could see a relief move back toward the previous structure. However, if this demand area fails to hold, the bearish momentum may continue and open the door for lower prices.
Wait for confirmation.
Let price reveal its intention.
Trade the reaction, not the prediction.
EURCAD - Bearish BatEURCAD is approaching the completion of a Bullish Bat harmonic pattern near the ideal 0.886 XA retracement, aligning with a major demand zone and lower volume-profile support area.
Price has been rotating lower from the C-point with weakening downside momentum, while RSI is nearing oversold conditions.
This PRZ around the lower support zone is a key area to watch for bullish rejection and reversal confirmation.
GBP/AUD Bearish Confirmed , Short Setup Detected To Get 150 PipsHere Is My 4H GBP/AUD Chart And Here Is My Opinion , we entered a buy trade last week from the support that shown on the chart and now the price reached the max level it can reach i think this week , so i found a good res area that mentioned on the chart and the price make a fake breakout and then back again below my res area and below the last high with amazing bearish 4h candle , also i put my C.T.L And now finally we have a 4H Closure Below It So It`s our time to enter a sell trade and targeting 50 to 150 pips and using a decent stop loss , if we have a daily closure above the last high again this idea will not be valid anymore .
Entry Reasons :
- Over Bought
- Fake Breakout
- Res Respected
- Bearish P.A
USD/JPY Fluctuates Within a Narrow RangeUSD/JPY fluctuated (choppy consolidation) within a narrow range throughout Monday's Asian trading session.
Spot prices traded slightly below the mid-162.00s, restrained by relatively thin market liquidity due to the Japanese national holiday (Marine Day).
-----------------------------------------------------------------------------------------------------------
✅ Katayama Warning & Thin Liquidity Dilemma During Tokyo Holiday
The downside of the JPY pair received temporary psychological protection due to the latest verbal threats from Japanese fiscal authorities:
- ⚡Katayama Friday Notice: Japanese Finance Minister Satsuki Katayama reiterated last Friday's stern warning, asserting that the Japanese government is prepared to take decisive action at any time if deemed necessary to curb detrimental exchange rate speculation.
- ⚡Risk of Intervention During Market Holiday: Institutional traders are being extremely cautious not to push prices above 162.80 during today's Asian session. A national holiday in Japan creates thin liquidity conditions, where stealth intervention by the Bank of Japan (BoJ) at the behest of the MoF would have a much more destructive volatility multiplier effect on dollar buyers.
-----------------------------------------------------------------------------------------------------------
✅ Technical Analysis 4-Hour Chart (H4)
Technically, USD/JPY is forming a horizontal consolidation pattern near a macro peak, where any daily pullbacks are responded to as buy-on-drops:
- ⚡Buy-on-Pullbacks Opportunity: The pro-USD fundamental backdrop and the massive interest rate gap indicate that the path of least resistance remains to the upside. Any corrective pullbacks are likely to be limited and exploited as buy-on-drops accumulation opportunities.
- ⚡Breakout Confirmation: A clean breakout and H4 candle close above 162.50 would pave the way for a retest of the four-decade high at 162.84, before testing the new psychological area at 163.00.
EUR/CAD BULLISH BIAS RIGHT NOW| LONG
Hello, Friends!
The BB lower band is nearby so EUR-CAD is in the oversold territory. Thus, despite the downtrend on the 1W timeframe I think that we will see a bullish reaction from the support line below and a move up towards the target at around 1.609.
Disclosure: I am part of Trade Nation's Influencer program and receive a monthly fee for using their TradingView charts in my analysis.
✅LIKE AND COMMENT MY IDEAS✅
GBPUSD — Step-by-Step Bullish DeliveryET = Engulf Target
TH = Target Hit
ML = Magnet Level
TRZ = Trap Zone
BS = Base Shoulder
FS = Final Shoulder
IBS = Ignore Base Shoulder
My overall expectation for GBPUSD remains bullish.
The schematic on the chart illustrates the path I currently expect price to follow rather than a fixed prediction.
Three potential reaction zones have been identified where I will be looking for bullish confirmations and possible long executions.
The plan is to move step by step with the market instead of anticipating every move.
If price delivers one of these opportunities with the expected structure and risk-to-reward, it could provide a high-quality execution.
If no new setup has been shared recently, it doesn't mean there is no plan.
It simply means price has not yet reached the areas where our execution model becomes valid.
Patience is part of the strategy.
Current analysis focuses on liquidity behavior, structural reactions, and step-by-step market delivery.
As precise as a Swiss watch.
AUDJPY: Will Start Falling! Here is Why:
Balance of buyers and sellers on the AUDJPY pair, that is best felt when all the timeframes are analyzed properly is shifting in favor of the sellers, therefore is it only natural that we go short on the pair.
Disclosure: I am part of Trade Nation's Influencer program and receive a monthly fee for using their TradingView charts in my analysis.
❤️ Please, support our work with like & comment! ❤️
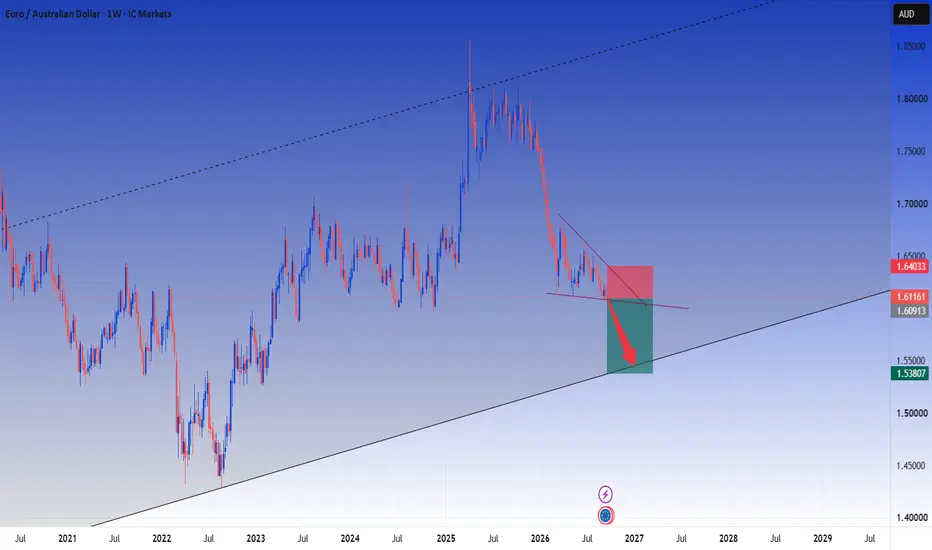
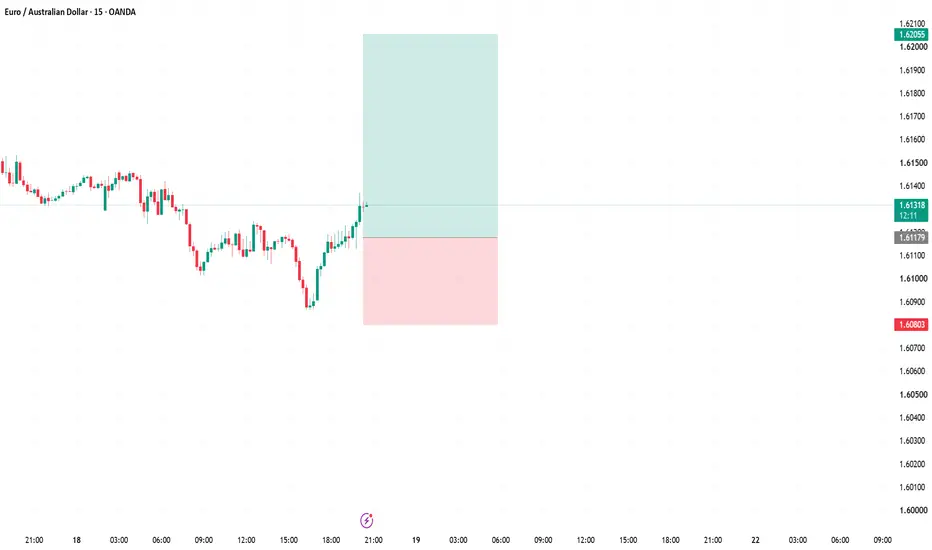
EURAUD Expected Growth! BUY!
My dear friends,
My technical analysis for EURAUD is below:
The market is trading on 1.6310 pivot level.
Bias - Bullish
Technical Indicators: Both Super Trend & Pivot HL indicate a highly probable Bullish continuation.
Target - 1.6356
About Used Indicators:
A pivot point is a technical analysis indicator, or calculations, used to determine the overall trend of the market over different time frames.
Disclosure: I am part of Trade Nation's Influencer program and receive a monthly fee for using their TradingView charts in my analysis.
———————————
WISH YOU ALL LUCK
EURUSD at Major Resistance — Is a Bigger Correction Beginning?EURUSD ( FX:EURUSD ) is currently trading near a resistance zone($1.1573-$1.1473), the Potential Reversal Zone (PRZ) , and the Resistance Lines.
From an Elliott Wave perspective, EURUSD appears to have completed its Primary Wave 4 near the resistance lines. The overall structure of Wave 4 seems to be developing as a Double Three Correction (W-X-Y).
Also, we can see a Negative Regular Divergence (RD-) between two consecutive peaks, which could be an early sign of weakening bullish momentum.
I expect EURUSD to continue its bearish move in the coming hours and decline at least toward 1.1430. If the bearish momentum increases, the pair could extend its decline further. A break below the key trading level of 1.1428 could open the door for a deeper correction.
First Target: $1.1430
Second Target: $1.1410
Third Target: $1.13920
Stop Loss(SL): $1.1496(Worst)
What’s your view on EURUSD? Do you think the pair can continue its bullish trend, or should we expect a deeper correction?
💡 Please respect each other's opinions and express agreement or disagreement politely.
📌 Euro/U.S Dollar Analyze (EURUSD), 1-hour time frame.
🛑 Always set a Stop Loss(SL) for every position you open.
✅ This is just my idea; I’d love to see your thoughts too!
🔥 If you find it helpful, please BOOST this post and share it with your friends.
EURJPY Daily Trade SetupThe EURJPY chart presents a constructive multi-timeframe bullish setup, supported by a constructive weekly Elliott Wave thesis on the higher timeframe. The weekly chart on the right shows price trending firmly higher within a rising channel, with the broader structure maintaining a clean sequence of higher highs and higher lows. From an Elliott Wave perspective, the advance appears to remain impulsive rather than exhausted, with the current consolidation likely representing a corrective pause within the broader bullish sequence. As long as price continues to hold above weekly channel support and the prior higher-low structure, the thesis remains that EURJPY is preparing for another upside leg toward the next Fibonacci extension zones.
On the H4 execution chart on the left, EURJPY is building a clear base above ascending trendline support after reclaiming the lower range. The recent consolidation appears to be forming a continuation structure, with price compressing beneath nearby resistance while maintaining a sequence of higher lows. This fits well with the weekly Elliott Wave view, as the H4 price action looks like a smaller corrective structure developing inside the larger bullish wave count. A short-term pullback or liquidity sweep into the rising support zone could therefore provide the next execution opportunity before continuation higher. The orange projection path suggests a potential dip, reclaim, and expansion phase, targeting the upper Fibonacci and channel resistance levels above.
The key bullish invalidation sits below the H4 ascending support and the recent major swing low. As long as EURJPY continues to hold that rising support structure, the broader thesis remains focused on upside continuation in line with the constructive weekly Elliott Wave count. A sustained break below the H4 higher-low base would weaken the execution setup and suggest a deeper retracement is underway, while a higher-timeframe break below weekly channel support would be required to challenge the broader bullish Elliott Wave thesis.
**EUR/USD Weekly Outlook: Liquidity Building Below Daily Resista
## Description
EUR/USD is currently trading inside a developing consolidation after an aggressive decline from the 1.1600 region.
The important question is not whether price appears “bullish” or “bearish” at its current location. The question is whether the recent buying represents genuine accumulation capable of changing delivery, or simply temporary support before the next bearish expansion.
### Fundamental context
The macroeconomic backdrop is becoming more supportive of EUR/USD, but the picture is not one-sided.
The ECB raised its deposit rate to 2.25% in June and remains concerned that higher energy costs could prevent inflation from returning sustainably to target. The current expectation among economists is that the ECB will hold rates at its July meeting, while leaving the possibility of another increase in September open. ( )
At the same time, softer US inflation data has reduced the immediate pressure on the Federal Reserve to raise rates again. June producer prices unexpectedly declined, weakening the dollar as traders adjusted their expectations for the Fed’s next move. ( )
This creates a potential shift in relative monetary-policy expectations:
* The ECB may remain restrictive because of energy-driven inflation risks.
* The Fed has more room to remain patient following softer inflation data.
* The resulting narrowing in expected policy divergence could support the euro.
However, higher oil prices and renewed geopolitical tension remain significant risks. Europe is more exposed to imported energy costs, while periods of uncertainty can simultaneously generate safe-haven demand for the US dollar. The fundamental environment therefore supports volatility rather than a simple one-directional euro trade. ( )
Recent FX strategy surveys also show that the broader weak-dollar view remains dominant, although an increasing number of strategists are expecting a smaller decline or a near-term dollar recovery. Dollar positioning therefore appears increasingly crowded and vulnerable to two-way corrections. ( )
### EXODUS technical perspective
From an EXODUS perspective, liquidity is not treated as a horizontal line that price is automatically programmed to attack.
Liquidity is a **condition** created by positioning, available counterparties and the way orders are being introduced into the market.
Following the bearish expansion, EUR/USD began printing repeated lower rejection wicks between approximately **1.1330 and 1.1380**. These wicks show bullish orders being injected into the market and an increasing willingness to absorb selling pressure.
However, bullish participation alone does not confirm bullish control.
Price is still trading beneath the **1.1460–1.1480 bearish array**. This area represents the immediate boundary between accumulation and continuation. Buyers have reacted from lower prices, but they have not yet demonstrated the ability to consume the opposing orders above them.
The highs around **1.1475–1.1480** must be removed before I consider the daily delivery structurally bullish.
### Weekly bias
My bias is **conditionally bullish**, not blindly bullish.
A sustained displacement through **1.1480**, followed by acceptance above the current bearish array, would suggest that the recent bullish injections are transitioning into genuine control.
That would open the path toward the main daily pocket between approximately:
**1.1528 and 1.1575**
This is the next meaningful area in which I would expect price to encounter opposing liquidity and reassess whether further upside can be facilitated.
Until the confirmation level is removed, EUR/USD remains inside a broader consolidation and both sides of the range remain vulnerable.
### Bullish scenario
For bullish continuation, I want to see:
1. Selling pressure continue to be absorbed above the recent lows.
2. A decisive expansion through **1.1480**.
3. Acceptance above the bearish array rather than an immediate rejection.
4. Lower-timeframe retracements holding as bullish arrays.
5. Continued delivery toward **1.1528–1.1575**.
The preferred day-trading opportunity would not be to buy directly into resistance. It would be to wait for the resistance to be consumed and then assess whether a retracement offers continuation from a newly established bullish array.
### Bearish scenario
If price repeatedly trades into **1.1460–1.1480** but cannot consume the available offers, the upper wicks may represent failed acceptance rather than preparation for a breakout.
A bearish reaction from this area could return price toward:
* **1.1380**
* **1.1350**
* Sell-side liquidity around **1.13246**
A meaningful break beneath **1.13246** would invalidate the developing bullish thesis and indicate that the lower injections were insufficient to change the dominant bearish delivery.
### Execution framework
The objective is not to predict the next candle.
The objective is to observe which side demonstrates the ability to:
* Absorb opposing pressure.
* Consume the next array.
* Maintain acceptance after displacement.
* Defend the origin of the new delivery.
Below **1.1480**, bullish intent is visible but unconfirmed.
Above **1.1480**, with acceptance, the daily pocket becomes the primary draw.
Below **1.13246**, the bullish thesis fails and bearish continuation becomes the higher-probability condition.
**Liquidity provides the opportunity. Delivery provides the confirmation. Execution comes last.**
*This analysis is educational and reflects a conditional market framework, not financial advice.*
EUR/USD (4H) – Trade Idea**EUR/USD (4H) – Trade Idea**
🔹 **Bias:** Bullish
Price is pulling back into a rising trendline after rejecting the resistance zone. This area can act as a higher-low if buyers defend it.
**What I'm watching:**
* Price taps the ascending trendline.
* Bullish confirmation (strong bullish candle or CHoCH/BOS on lower timeframe).
* Then continuation toward the previous resistance and higher.
**Trade Plan:**
* **Entry:** Buy after bullish confirmation from the trendline.
* **Stop Loss:** Below the trendline and recent swing low.
* **Target:** Previous resistance around **1.1470–1.1480**, with potential extension toward **1.1550**.
⚠️ If price closes decisively below the trendline, the bullish setup becomes invalid and a deeper pullback is more likely.
USDJPY Will Go Lower! Short!
Take a look at our analysis for USDJPY.
Time Frame: 1h
Current Trend: Bearish
Sentiment: Overbought (based on 7-period RSI)
Forecast: Bearish
The market is approaching a significant resistance area 162.359.
Due to the fact that we see a positive bearish reaction from the underlined area, I strongly believe that sellers will manage to push the price all the way down to 162.229. level.
P.S
The term oversold refers to a condition where an asset has traded lower in price and has the potential for a price bounce.
Overbought refers to market scenarios where the instrument is traded considerably higher than its fair value. Overvaluation is caused by market sentiments when there is positive news.
Like and subscribe and comment my ideas if you enjoy them!
USD/CHF Bullish Recovery Toward 0.8110 Resistance
USD/CHF on the **1-hour timeframe** is showing signs of stabilization after a prolonged period of sideways consolidation. Price is trading above a key support zone around **0.8070**, while the Ichimoku cloud is beginning to flatten, suggesting that bearish momentum is fading.
The chart highlights a strong support area near **0.8020**, where buyers have repeatedly stepped in. As long as price remains above the **0.8070** support, bulls may attempt another push toward the next resistance.
A break above the nearby consolidation range could trigger a continuation move toward the marked target at **0.8110**, which aligns with a previous resistance level. However, failure to hold above **0.8070** may result in another retest of the lower support zone before any sustained bullish move.
### **Target**
🎯 **Bullish Target:** **0.8110**
### **Key Levels**
* **Support:** 0.8070 – 0.8020
* **Resistance:** 0.8095
* **Main Target:** **0.8110**
**Trade Idea:** A sustained hold above **0.8070** favors a bullish continuation toward **0.8110**, while a break below support would weaken the bullish outlook and increase the probability of a move back toward **0.8020**.
GBPAUD: Bullish Push to 1.970?FX:GBPAUD is eyeing a bullish continuation on the 1-hour chart , with price rebounding from support after recent consolidation, converging with a potential entry zone that could ignite upside momentum if buyers defend amid volatility. This setup suggests a rally opportunity in the current structure, targeting higher resistance levels with more than 1:2 risk-reward .🔥
Entry between 1.895–1.907 (entry from current price with proper risk management is recommended). Target at 1.970 . Set a stop loss at a daily close below 1.878 , yielding a risk-reward ratio of more than 1:2 . Monitor for confirmation via a bullish candle close above entry with rising volume, leveraging the pair's momentum near support.🌟
Fundamentally , GBPAUD is trading around 1.901 in early July 2026.
For the British Pound, one of the most important releases this week is the UK GDP (Q2 Preliminary) and Manufacturing Production data (expected around July 8-10). Stronger-than-expected growth would support GBP.
For the Australian Dollar, the key event is the RBA Monetary Policy Meeting Minutes (likely released July 7-8) and Retail Sales data, where a dovish RBA tone or weak consumer spending would weigh on AUD.
Overall, resilient UK data versus potential softness in Australian figures could favor bullish momentum in GBPAUD this week. 💡
📝 Trade Setup
🎯 Entry (Long):
1.8950 – 1.9070
(Entry from current price is valid with proper risk & position sizing.)
🎯 Target:
• 1.9700
❌ Stop Loss:
• Daily close below 1.8780
⚖️ Risk-to-Reward:
• > 1:2
💡 Does GBPAUD use the 1.8950–1.9070 demand zone as a launchpad toward 1.9700, or do you expect another consolidation phase before the next bullish expansion? 👇
Falling towards pullback support?Loonie (USD/CAD) is falling toward the pivot, which acts as a pullback support that aligns with the 38.2% Fibonacci retracement and could bounce towards the 1st resistance.
Pivot: 1.3985
1st Support: 1.3869
1st Resistance: 1.4179
Disclaimer:
The opinions given above constitute general market commentary and do not constitute the opinion or advice of IC Markets or any form of personal or investment advice.
Any opinions, news, research, analyses, prices, other information, or links to third-party sites contained on this website are provided on an "as-is" basis, are intended to be informative only, and are not advice, a recommendation, research, a record of our trading prices, an offer of, or solicitation for, a transaction in any financial instrument and thus should not be treated as such. The information provided does not involve any specific investment objectives, financial situation, or needs of any specific person who may receive it. Please be aware that past performance is not a reliable indicator of future performance and/or results. Past performance or forward-looking scenarios based upon the reasonable beliefs of the third-party provider are not a guarantee of future performance. Actual results may differ materially from those anticipated in forward-looking or past performance statements. IC Markets makes no representation or warranty and assumes no liability as to the accuracy or completeness of the information provided, nor any loss arising from any investment based on a recommendation, forecast, or any information supplied by any third party.
Bearish reversal at pullback resistance?Fiber (EUR/USD) has rejected off the pivot, which has been identified as a pullback resistance, aligning with the 50% Fibonacci retracement and could drop toward the 1st support.
Pivot: 1.1461
1st Support: 1.1324
1st Resistance: 1.1510
Disclaimer:
The opinions given above constitute general market commentary and do not constitute the opinion or advice of IC Markets or any form of personal or investment advice.
Any opinions, news, research, analyses, prices, other information, or links to third-party sites contained on this website are provided on an "as-is" basis, are intended to be informative only, and are not advice, a recommendation, research, a record of our trading prices, an offer of, or solicitation for, a transaction in any financial instrument and thus should not be treated as such. The information provided does not involve any specific investment objectives, financial situation, or needs of any specific person who may receive it. Please be aware that past performance is not a reliable indicator of future performance and/or results. Past performance or forward-looking scenarios based upon the reasonable beliefs of the third-party provider are not a guarantee of future performance. Actual results may differ materially from those anticipated in forward-looking or past performance statements. IC Markets makes no representation or warranty and assumes no liability as to the accuracy or completeness of the information provided, nor any loss arising from any investment based on a recommendation, forecast, or any information supplied by any third party.