AVAX BULLLiquidity below the 4H range has been taken. A move to the upside following a touch of the IFVG is highly probable. by RangeTrader331
bullish three drives bottom catalyst of the next rally up?Liquidity is showing the low target of this abc correction and the projected zone lines up with the 1.414 extension of the second drive and will end the third drive down. The 0.618 retracement of the whole pattern will bring us back up to right below the point of control. I’m under the impression this will be the catalyst of the next macro impulsive Elliott wave 3. Buyside order blocks are right below the next major resistance level right below 15.00 and is the projected area sell level.Longby QuantMasterEcch0
AVAX - Reversal Out of Down TrendPrice is trending downwards along the channel in red I suspect price will still use this horizontal in the dashed green as a support again Look for a break of the down channel for a complete reversal in price direction Daily timeframe by Bixley20
Avax head and shoulders/testing neckline of 2yr falling wedgeAvalanche formed a clean head and shoulders and is targeting 9.06 in the shorter timeframe and is also testing the neckline of a giant falling wedge going back 2 years. Wait to enter at the projected measured move for the head and shoulders if there is a clean sweep of sellside liquidity and bulls step in at that level. The target for the falling wedge if this breakout keeps its strength is 50.95. Is Avax shooting for the moon? Let’s wait and see. Longby QuantMasterEcch1
AVAX EW counts shows initial signs of breakout On the weekly chart, AVAX is now testing and beginning to break its long-standing local downtrend resistance. Since this is the first major test of that trendline, I would not be surprised to see an initial rejection before a more convincing breakout develops. From an Elliott Wave perspective, the move from the recent lows can currently be interpreted as three waves higher. For a cleaner confirmation that a new impulsive structure is developing, I would ideally like to see a complete five-wave aby zakoraio5
AVAX validated double bottom breakout. Target = 13.50AVAX has commenced moonshotting. Next target is 13.50 *not financial advice* Golden cross happening soon. by DrDovetail14
AVAX: $10.50open-source platform designed to process transactions quickly and support decentralized applications it may re gain the narrative, users, liquidity, and mindshare this TOKENiZATiON season just as ZEC got a big fund pushing privacy so shall AVAX as the ultimate gaming rwa chain to hop on by senyor10x8
Is AVAX a sleeping giant soon to be awakened? Avalanche’s chart has looked more and more miserable as each month passes and is currently still rather cheap although it is hinting that its bottom may be in. Fundamentally this news just broke that the UAE announced its going to integrate Avalanche blockchain into its national digital identity platform UAE PASS. This should provide an initial spark to the wick at the end of the avalanche powder keg. I do believe montis group had also listed avalanche as one of the chains they would likely. Be by DrDovetail14
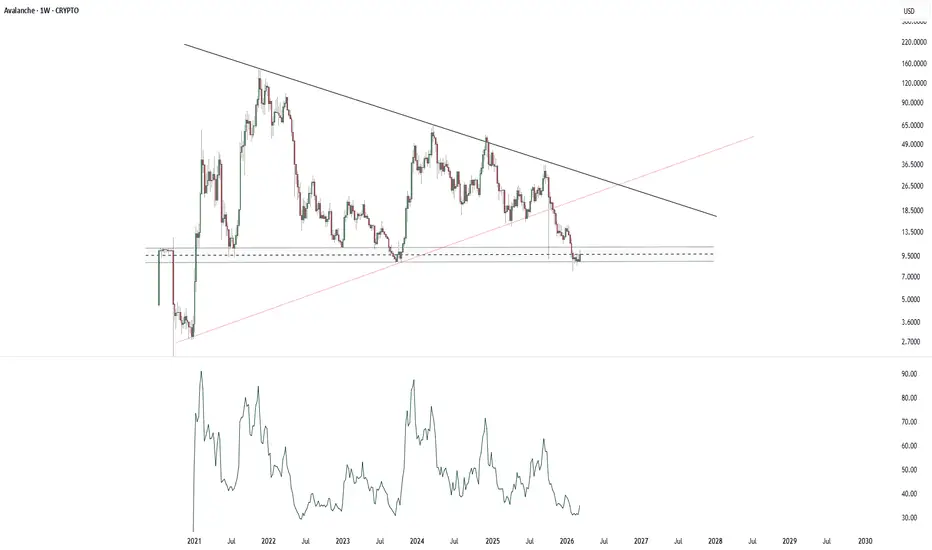
AVAX — Multi-Year Falling Wedge Targets $264 → $634 → $1,385Avalanche (AVAX) is approaching one of the most important areas on its long-term chart. On the monthly timeframe, AVAX has spent years compressing inside a large descending/falling wedge structure following its 2021 cycle high. Price is currently around $7.84, deep within the lower portion of the historical range, while the descending upper resistance and rising/lower structural support continue converging. That creates a straightforward thesis: The compression is interesting — but the bulliLongby STP_MrNodeItAll211
AVAX - time for reversal incomingAVAX had a long correction, just like ZEC. Looking at pattern we see similar pattern to XRP and ZEC where it seems we are now ending last corrective phase before a reversal. Expecting bounce up and push to test ATH range with possible overshoot and then we get again big correction (70-80%).Longby Zorroreny17
AVAX | Channel Broken Down — The Bounce Is OverAVAX | Rejected From Supply — The Downtrend Resumes Toward Liquidity! By analyzing the #AVAX (Avalanche) chart on the 4H timeframe, we can see that price remains firmly within a downtrend. Every attempt higher has been sold, and the most recent one just failed at a critical level — keeping sellers in full control. 📊 4H Timeframe On the 4H, the structure is clearly bearish. Price has printed a series of bearish BOS on its way down, and the most recent corrective rally pushed all the way upby BigBeluga125
AVALANCHE [$AVAX] Weekly TF Elliott Wave Crypto Analysis FIB TCAVAX update: My bearish outlook from February has played out almost exactly as anticipated. Price has remained inside the long-term descending channel, while the Wave C decline has continued to unfold toward the Fibonacci Golden Zone between $5.18 and $6.11. This is the area I’m watching most closely. If my Elliott Wave count is correct, AVAX should be approaching the final stages of this macro correction. That doesn’t necessarily mean the low is already in—Wave C could still extend slightly Longby Anakyn7
AVAXUSD | Continue to decline | Week, 15 - 19,2026Hello Traders! Let’s return to the cryptocurrency market. A familiar pattern has emerged in BINANCE:AVAXUSD , where a signal candle with valid volume has broken down from the trend line. Place a Sell stop order and wait for the market’s response.Shortby cncstarUpdated 20
$AVAX Warning: Big Mountain Ranges = BIG Crevices!Why the MountainBears are Growling The "Mountains of Avalanche" is looking shaky. Avalanche by name. Avalanche by nature? While the bulls are trying to hold the line, the chart is printing a Head and Shoulders pattern that looks like a final warning for Q1 2026 before breakdown (maybe q2) Negative Momentum: The MACD histogram on longer timeframes is showing weak momentum, and the RSI is hovering in a neutral-to-bearish zone near 38–42, suggesting sellers are slowly taking control. InstitShortby BallaJiUpdated 133
AVAX | Jun, 2026 | The time to go long has come- Timeframe: Monthly - Trade type: Buy stop order - Price: 10.4828 - Take Profit: Open - Stop Loss: 8.6479 (-17.50 %) Idea: Long on a breakout above last monthly's high — bullish momentum continuation. Entry: Buy stop above last monthly’s high. Stop-loss: Below the low of the same candle. If the monthly candle closes below this level, the trade is invalidated. Take Profit: Trailing stop following the lows of new monthly candles. Feel free to like and share your thoughts in the comments! ❤️Longby Tired-WolfUpdated 210
AVAX double top neckline broke aiming for new cycle lowAVAX has broken the neckline on a double top targeting a new cycle low. It’s aiming for breaking out of its lower channel resistance which will bring it in line for a higher timeline double top targeting much lower.Shortby QuantMasterEcch0
AVAX double top flip chart short & macro cycle market analysisAVAX along with most other coins is seeing a big correction downward. It’s broken the neckline on a double top and the measured move is 7.41. The macd was trending down while price was heading up indicating a divergence on the indicator. Analysts have noted btcs rise to 82k was a mid cycle correction and is potentially going to bottom out at 45k. With on chain metrics off all coins showing large downside corrections that possibility is starting to seem like it’s more likely than not with the marShortby QuantMasterEcch1
Breakout structure AVAUSDBreakout structure confirmed on AVAUSD 📈 Price respected trendline support perfectly and is now pushing toward the next major resistance zone. Eyes on the 10.00 psychological level — a clean break above could open the path toward the higher supply area marked on the chart. 🚀 Patience + structure = high probability setups. #AVAUSD #Crypto #TradingView #PriceAction #TechnicalAnalysis #Breakout #SupportAndResistance #SmartMoney #CryptoTrading #cyberaiLongby Cyber4PF4
BULLISH HIGH TIME FRAMEAltcoin season is coming and nobody is talking about it until its time to exit positions. been bullish on CRYPTOCAP:AVAX for years, this is a gem and I believe it is one of the few chosen ones that will see insane long term growth. One of the ways it will achieve this is through guaranteed support from BlackRock by providing future liquidity.Longby MotesTrades12
$AVAX / 8$ to 150$ CRYPTOCAP:AVAX ------------------------ If you step back from the daily noise and look at the Avalanche (AVAX) 1-Week chart, you are looking at one of the most asymmetric risk/reward setups in the current crypto market. Here is the professional breakdown of the core technical dynamics currently at play: Generational Support Block ($8 - $10) The dashed horizontal zone around the $8 mark represents the absolute floor for AVAX. As seen on the chart, the price has perfectly tested this historicby Cryptollica119
Avalanche holding key support — traders positioning for a bouncCurrent Price: 9.72 (Analysis was generated on Monday Morning) Direction: LONG Confidence level: 52%(Direct trader snippets were limited, but price is holding a major support zone with strong buyer dominance and no aggressive bearish pressure, favoring a short-term upside attempt.) Targets Target 1: 10.20 Target 2: 10.80 Stop Levels Stop 1: 9.15 Stop 2: 8.60 Key Insights: Here’s what’s driving this setup. Avalanche is trading right above a well-established support band between $9.20 and $9.Longby CrowdWisdomTrading3
AVAX ROADMAP While the uneducated retail crowd is paralyzed by micro-volatility and generating doomsday narratives, institutional algorithms are tracking one of the most severe macroeconomic compressions in the sector. You are looking at the 1-Week (1W) structural anatomy of AVAX. $10 Volumetric Bedrock (Institutional Footprint): Direct your attention to the horizontal dashed axis at exactly $10.00. This is not a random psychological support level. It is a multi-year "Volumetric Void" where Smart Money hby Cryptollica9
AVAX - High probability of upside Don’t sleep on this guys. Daily chart showing a recent double bottom and now producing a bull flag with inside bar price action. It’s at near all time low sitting on major support. There’s a trade with an upside of 50% hereLongby geordiecrew773
AVAX downtrend continuesIt seems that CRYPTOCAP:AVAX has formed a double top. So price should continue its downtrend. If you want to get my analysis of your altcoin send me a DM.by Stan_Leimanis0