BCH USDT SHORT SIGNALBCH/USDT 4H Analysis
BCH has lost its short-term ascending structure and remains under the 219.5–222.3 resistance zone.
As long as price stays below 222.3, the bearish scenario remains valid. A 4H close below 209.6 may lead to 205.2, followed by the main demand zone at 202.3–196.1.
If this demand zo
Key facts today
01 Aug 2026: BCHUSD saw Bitcoin Cash launch its first mainnet native zk-SNARK shielded pool enabling base-layer shielded transactions; impact on volume depends on user adoption and app uptime. 1
Key stats
Open interest
Liquidations
Long
Short
Price
BCHUSD H4 | Bearish Reversal Off Strong ResistanceBased on the H4 chart analysis, we could see the price rise to our sell entry level of 228.78, which is an overlapping resistance that aligns with the 38.2% Fibonacci retracement.
Our stop loss is set at 247.78, which is a pullback resistance.
Our take profit is set at 214.06, which is a pullback
Bitcoin Cash ($BCHUSD) 4H: Fibonacci 61.8% Retest ValidatesBitcoin Cash ( COINBASE:BCHUSD ) 4H: Fibonacci 61.8% Retest Validates Elliott Wave 3 Impulse Setup Toward $284.57
### 🪙 Bitcoin Cash / U.S. Dollar ( COINBASE:BCHUSD ) 4H Technical Structure (Ref: BCHUSD_2026-07-21_11-54-44.png)
We are releasing an intraday structural study on Bitcoin Cash ( COINBA
BCHUSD H4 | Pullback Resistance AheadBased on the H4 chart analysis, we can see that the price is rising to our sell entry level at 217, a pullback resistance.
Our stop loss is set at 225.6, an overlap resistance.
Our take profit is set at 200.3, an overlap support.
High Risk Investment Warning
65% of retail investor accounts lose
BCH at macro floor: base recovery toward $300The Macro Picture 🗺️
BCH went through a brutal structural reset — the May $470 highs unwound all the way to $185 by June, a flush deep enough to push RSI into extreme oversold and exhaust the sellers. That kind of capitulation is exactly what carves durable floors. Since then, price has built a bas
BCHUSD H4 | Bullish Bounce OffBased on the H4 chart, we can see that the price has bounced off our buy entry level of 228.78, which is a pullback support.
Our stop loss is set at 214.04, which is a pullback suport that aligns with the 50% Fibonacci retracement.
Our take profit is set at 248.61, which is a pullback resistance.
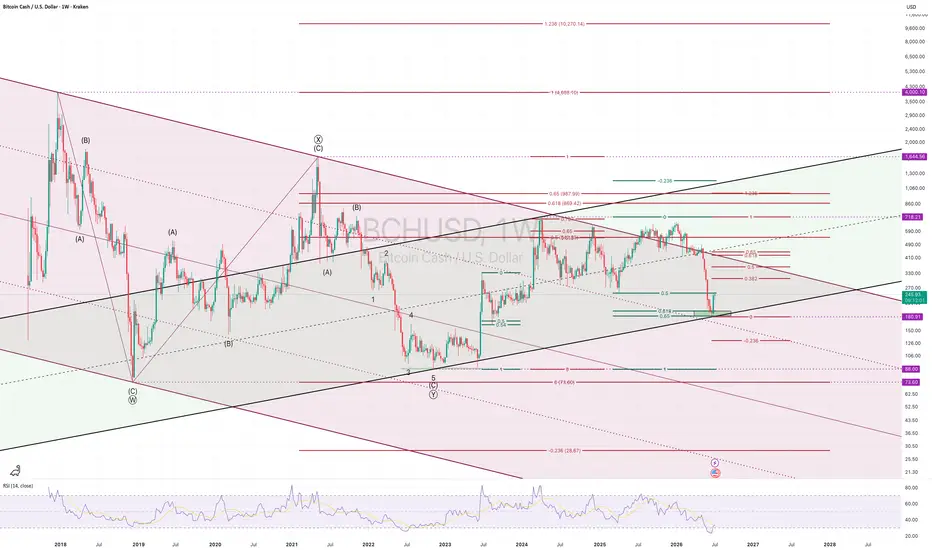
BITCOIN CASH [$BCH] ELLIOTT WAVE CRYPTO ANALYSIS WEEKLY TFNYSE:BCH Bitcoin Cash has arrived at what I consider the most important price level of the entire macro structure.
The recent sell-off found support almost perfectly inside the weekly Golden Zone (GZ) around $180, where several technical factors converge. This area is far more than just another s
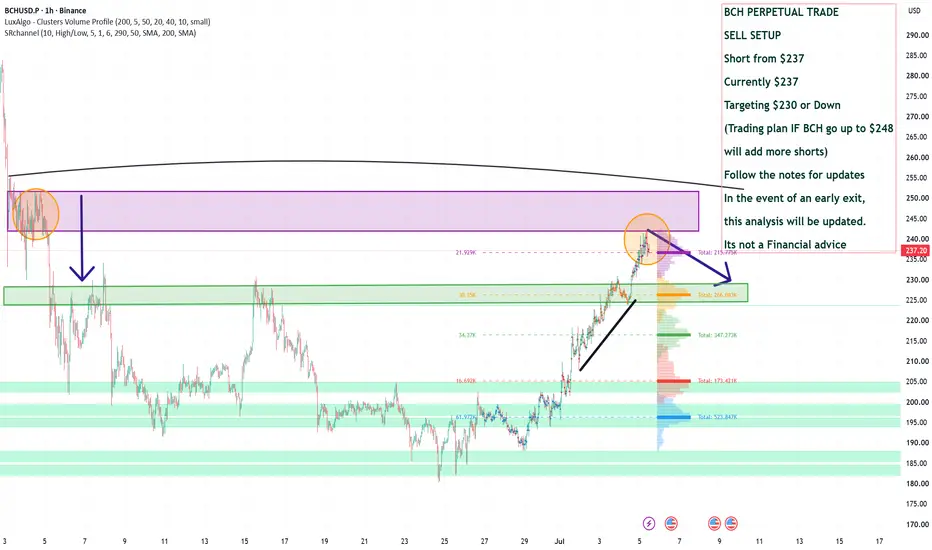
BCH PERPETUAL TRADE SELL SETUP Short from $237BCH PERPETUAL TRADE
SELL SETUP
Short from $237
Currently $237
Targeting $230 or Down
(Trading plan IF BCH go up to $248
will add more shorts)
Follow the notes for updates
In the event of an early exit,
this analysis will be updated.
Its not a Financial advice
See all ideas
Displays a symbol's price movements over previous years to identify recurring trends.
Frequently asked questions
Bitcoin Cash (BCH) reached its highest price on May 12, 2021 — it amounted to 1,641.73 USD. Find more insights on the BCH price chart.
See the list of crypto gainers and choose what best fits your strategy.
Bitcoin Cash (BCH) reached the lowest price of 87.08 USD on Nov 10, 2022. View more Bitcoin Cash dynamics on the price chart.
See the list of crypto losers to find unexpected opportunities.
The safest choice when buying BCH is to go to a well-known crypto exchange. Some of the popular names are Binance, Coinbase, Kraken. But you'll have to find a reliable broker and create an account first. You can trade BCH right from TradingView charts — just choose a broker and connect to your account.
You can discuss Bitcoin Cash (BCH) with other users in our public chats, Minds or in the comments to Ideas.