BCH USDT SHORT SIGNALBCH/USDT 4H Analysis
BCH has lost its short-term ascending structure and remains under the 219.5–222.3 resistance zone.
As long as price stays below 222.3, the bearish scenario remains valid. A 4H close below 209.6 may lead to 205.2, followed by the main demand zone at 202.3–196.1.
If this demand zone breaks, 188.3 becomes the next target. A reclaim above 222.3 would weaken the bearish outloo
In-depth trading ideas
BCHUSD H4 | Bearish Reversal Off Strong ResistanceBased on the H4 chart analysis, we could see the price rise to our sell entry level of 228.78, which is an overlapping resistance that aligns with the 38.2% Fibonacci retracement.
Our stop loss is set at 247.78, which is a pullback resistance.
Our take profit is set at 214.06, which is a pullback support.
High Risk Investment Warning
Stratos Markets Limited fxcm.com Stratos Europe Ltd, fxcm.com CFDs are complex instruments and come with a high risk of losing money rapidly due to leverage. 69% of retail investor accounts lose money when trading CFDs with this provider. You should consider whether you understand how CFDs work and whether you can afford to take the high risk of losing your money.
Stratos Global LLC fxcm.com Losses can exceed deposits.
Please be advised that the information presented on TradingView is provided to FXCM (‘Company’, ‘we’) by a third-party provider (‘TFA Global Pte Ltd’). Please be reminded that you are solely responsible for the trading decisions on your account. Any information and/or content is intended entirely for research, educational and informational purposes only and does not constitute investment or consultation advice or investment strategy. The information is not tailored to the investment needs of any specific person and therefore does not involve a consideration of any of the investment objectives, financial situation or needs of any viewer that may receive it. Past performance is not a reliable indicator of future results. Actual results may differ materially from those anticipated in forward-looking or past performance statements. We assume no liability as to the accuracy or completeness of any of the information and/or content provided herein and the Company cannot be held responsible for any omission, mistake nor for any loss or damage including without limitation to any loss of profit which may arise from reliance on any information supplied by TFA Global Pte Ltd.
Stratos Trading Pty. Limited fxcm.com Trading FX/CFDs carries significant risks. FXCM AU (AFSL 309763), please read the Financial Services Guide, Product Disclosure Statement, Target Market Determination and Terms of Business at fxcm.com
Bitcoin Cash ($BCHUSD) 4H: Fibonacci 61.8% Retest ValidatesBitcoin Cash ( COINBASE:BCHUSD ) 4H: Fibonacci 61.8% Retest Validates Elliott Wave 3 Impulse Setup Toward $284.57
### 🪙 Bitcoin Cash / U.S. Dollar ( COINBASE:BCHUSD ) 4H Technical Structure (Ref: BCHUSD_2026-07-21_11-54-44.png)
We are releasing an intraday structural study on Bitcoin Cash ( COINBASE:BCHUSD ) tracking the 4-Hour (4H) interval. Following a strong initial directional leg from the macro low printed at 180.23 up to the 256.27 local peak, price action has completed a textbook harmonic pullback, setting up a potential high-velocity Elliott Wave 3 expansion phase.
The asset is currently building buy-side momentum, trading up at **224.37 (+0.25%)**, initiating a clean higher-low pivot.
---
### 🔍 Technical Architecture & Harmonic Confluences:
Our quantitative analysis highlights a structurally sound Elliott Wave configuration:
1. **Precision 61.8% Fibonacci Absorption:** The corrective Wave 2 retraced cleanly into the golden ratio zone at **209.27 (0.618 Fibonacci)**, finding aggressive buyer defense right above the **209.62** structural support shelf.
2. **Dynamic Resistance Gauntlet:** The immediate recovery leg is approaching a minor dynamic hurdle formed by the **72-period SMA ribbons (229.82 – 234.26)** and the institutional **200-period EMA (purple line sitting at 230.70)**.
3. **Pivotal Trigger Level:** A decisive 4H candle close above the **230.70 – 234.26** dynamic average band will officially confirm the Wave 3 expansion trigger.
---
### 🚀 Wave 3 Fibonacci Projection Targets:
Clearing overhead moving average resistance unlocks a clean technical corridor for upside expansion:
* **Target 1 (Wave 1 Peak Retest):** The initial objective sits at **255.94** (confluencing with the 0.618 macro retracement and the previous swing high).
* **Target 2 (Harmonic Extension):** The secondary target points toward the **268.53** expansion level (0.786 Fibonacci).
* **Target 3 (Full 1.0 Expansion Ceiling):** The ultimate structural Wave 3 target projects up to the **284.57** key supply node.
### 📊 Tactical Parameters Summary:
* **Current Bias:** Strongly Bullish (Elliott Wave 3 Setup)
* **Wave 2 Invalidation Support:** 209.27 (0.618 Golden Ratio Floor)
* **Breakout Acceleration Zone:** 230.70 – 234.26 (200-EMA / 72-SMA Cluster)
* **Primary Profit Target (Wave 3):** 284.57
---
📊 **ChartPro Data**
*Crypto Structural Architecture, Elliott Wave Sourcing & Systematic Risk Management.*
⚠️ **Disclaimer:** For educational and informational purposes only. This active market study represents a personal trading framework and does not constitute financial or investment advice.
BCHUSD H4 | Pullback Resistance AheadBased on the H4 chart analysis, we can see that the price is rising to our sell entry level at 217, a pullback resistance.
Our stop loss is set at 225.6, an overlap resistance.
Our take profit is set at 200.3, an overlap support.
High Risk Investment Warning
65% of retail investor accounts lose money when trading CFDs with this provider. You should consider whether you understand how CFDs work and whether you can afford to take the high risk of losing your money.
BCH at macro floor: base recovery toward $300The Macro Picture 🗺️
BCH went through a brutal structural reset — the May $470 highs unwound all the way to $185 by June, a flush deep enough to push RSI into extreme oversold and exhaust the sellers. That kind of capitulation is exactly what carves durable floors. Since then, price has built a base above $185 and launched a sharp V-recovery back to $255, before settling at $240 with RSI reclaiming the midline. The violence of the bounce tells you demand is back, and the market is now working to reclaim the ground it lost on the way down.
The Setup ⚙️
The Buy Area: The $200–240 band is where accumulation has played out since the flush. Bulls stepped in hard off the lows, and as marked on the chart, price is holding well above the base with momentum turning up.
The Accumulation Zone: A deeper retest toward $200 opens a textbook pocket for staggered, averaging-based entries — the $185 macro floor makes this a high-confluence zone to build a position rather than chase the recovery.
The Ceiling: The $255 decision line caps the local range. A clean reclaim confirms the recovery structure and opens the path toward the $300 macro resistance above.
The Roadmap: Primary target sits at $300 — the green roadmap points there as price works up from the base toward the next major shelf. Invalidation: a clean daily close below $185 would invalidate this bullish thesis and signal the base has failed.
More setups in profile.
#BCH #CRYPTO #BitcoinCash #Altcoins #TechnicalAnalysis
BCHUSD H4 | Bullish Bounce OffBased on the H4 chart, we can see that the price has bounced off our buy entry level of 228.78, which is a pullback support.
Our stop loss is set at 214.04, which is a pullback suport that aligns with the 50% Fibonacci retracement.
Our take profit is set at 248.61, which is a pullback resistance.
High Risk Investment Warning
Stratos Markets Limited fxcm.com Stratos Europe Ltd, fxcm.com CFDs are complex instruments and come with a high risk of losing money rapidly due to leverage. 69% of retail investor accounts lose money when trading CFDs with this provider. You should consider whether you understand how CFDs work and whether you can afford to take the high risk of losing your money.
Stratos Global LLC fxcm.com Losses can exceed deposits.
Please be advised that the information presented on TradingView is provided to FXCM (‘Company’, ‘we’) by a third-party provider (‘TFA Global Pte Ltd’). Please be reminded that you are solely responsible for the trading decisions on your account. Any information and/or content is intended entirely for research, educational and informational purposes only and does not constitute investment or consultation advice or investment strategy. The information is not tailored to the investment needs of any specific person and therefore does not involve a consideration of any of the investment objectives, financial situation or needs of any viewer that may receive it. Past performance is not a reliable indicator of future results. Actual results may differ materially from those anticipated in forward-looking or past performance statements. We assume no liability as to the accuracy or completeness of any of the information and/or content provided herein and the Company cannot be held responsible for any omission, mistake nor for any loss or damage including without limitation to any loss of profit which may arise from reliance on any information supplied by TFA Global Pte Ltd.
Stratos Trading Pty. Limited fxcm.com Trading FX/CFDs carries significant risks. FXCM AU (AFSL 309763), please read the Financial Services Guide, Product Disclosure Statement, Target Market Determination and Terms of Business at fxcm.com
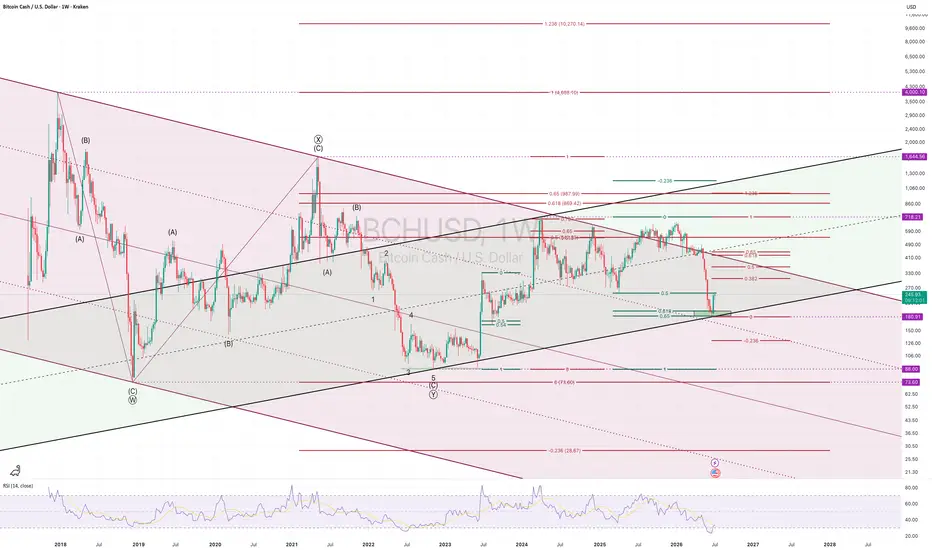
BITCOIN CASH [$BCH] ELLIOTT WAVE CRYPTO ANALYSIS WEEKLY TFNYSE:BCH Bitcoin Cash has arrived at what I consider the most important price level of the entire macro structure.
The recent sell-off found support almost perfectly inside the weekly Golden Zone (GZ) around $180, where several technical factors converge. This area is far more than just another support level—it represents the crossroads that will likely determine the next multi-year direction for BCH.
As long as the weekly Golden Zone continues to hold, my Elliott Wave count remains constructive. The market may still be completing a large corrective structure before beginning the next impulsive advance. If this interpretation proves correct, the long-term target remains the $4,000 region, with an ALGO take-profit objective near $10,270.
However, this bullish outlook still requires confirmation.
The first technical confirmation would be a decisive break above the daily Golden Zone, currently located around $443. Reclaiming that level would strengthen the bullish wave count considerably and suggest that the recent decline has indeed completed its corrective phase.
On the other hand, the current support cannot be lost. A sustained breakdown below the $180 weekly Golden Zone would invalidate my preferred bullish scenario and significantly increase the probability that BCH is still unfolding a much larger bearish structure. In that case, the next major downside objective shifts dramatically towards approximately $28.67.
This is why I believe the current price region deserves close attention. Markets rarely provide such clearly defined technical crossroads where both the bullish and bearish scenarios are so well separated by one critical level.
For now, Bitcoin Cash remains compressed between long-term support and multi-year resistance. The longer this compression persists, the more significant the eventual breakout is likely to become.
As always, Elliott Wave analysis is about probabilities rather than certainties. The market will ultimately determine which path unfolds—but from my perspective, $180 is the line that separates a potential multi-year bull market from the risk of one final capitulation.
Like and follow for more Elliott Wave and macro crypto analysis.
BCH USDTSHORT SIGNAL#32. BCH/USDT – Trade Setup (SHORT)
📈 Position Type: SHORT
🕒 Timeframe: 1 H
📊 Market: Futures
💰 Entry Zone:
234.20
243.09
🛑 Stop-Loss:
247.35
🎯 Take-Profit Targets:
• TP1: 227.12
• TP2: 217.68
• TP3: 211.16
• TP4: 204.92
TP5:
TP6:
⚙️ Leverage:
5- 10
⚠️ After reaching TP1, move Stop-Loss to Entry Price.
📌 Risk Management:
Risk only 1–2% of your capital per trade.
Always confirm the setup on your chart before entry
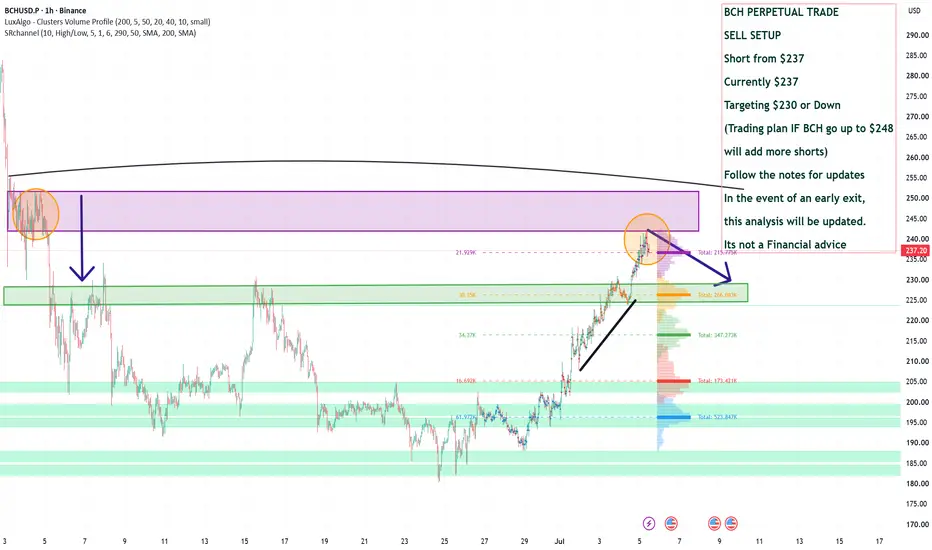
BCH PERPETUAL TRADE SELL SETUP Short from $237BCH PERPETUAL TRADE
SELL SETUP
Short from $237
Currently $237
Targeting $230 or Down
(Trading plan IF BCH go up to $248
will add more shorts)
Follow the notes for updates
In the event of an early exit,
this analysis will be updated.
Its not a Financial advice
BCH USDT SHORT SIGNAL#19 BCH/USDT – Trade Setup (SHORT)
📈 Position Type: SHORT
🕒 Timeframe: 1 H
📊 Market: Futures
💰 Entry Zone:
239.90
🛑 Stop-Loss:
245.45
🎯 Take-Profit Targets:
• TP1: 235.48
• TP2: 230.43
• TP3: 226.59
• TP4: 222.40
TP5: 218.60
TP6:
⚙️ Leverage:
5- 10
⚠️ After reaching TP1, move Stop-Loss to Entry Price.
📌 Risk Management:
Risk only 1–2% of your capital per trade.
Always confirm the setup on your chart before entry
BCHUSD H1 | Bulls Slowly Regaining MomentumThe price is falling to our buy entry level of 195.49, which is a pullback support.
Our stop-loss is set at 186.81, which is a pullback support.
Our take-profit is set at 205.41, which is a pullback resistance.
High Risk Investment Warning
Stratos Markets Limited fxcm.com Stratos Europe Ltd, fxcm.com CFDs are complex instruments and come with a high risk of losing money rapidly due to leverage. 69% of retail investor accounts lose money when trading CFDs with this provider. You should consider whether you understand how CFDs work and whether you can afford to take the high risk of losing your money.
Stratos Global LLC fxcm.com Losses can exceed deposits.
Please be advised that the information presented on TradingView is provided to FXCM (‘Company’, ‘we’) by a third-party provider (‘TFA Global Pte Ltd’). Please be reminded that you are solely responsible for the trading decisions on your account. Any information and/or content is intended entirely for research, educational and informational purposes only and does not constitute investment or consultation advice or investment strategy. The information is not tailored to the investment needs of any specific person and therefore does not involve a consideration of any of the investment objectives, financial situation or needs of any viewer that may receive it. Past performance is not a reliable indicator of future results. Actual results may differ materially from those anticipated in forward-looking or past performance statements. We assume no liability as to the accuracy or completeness of any of the information and/or content provided herein and the Company cannot be held responsible for any omission, mistake nor for any loss or damage including without limitation to any loss of profit which may arise from reliance on any information supplied by TFA Global Pte Ltd.
Stratos Trading Pty. Limited fxcm.com Trading FX/CFDs carries significant risks. FXCM AU (AFSL 309763), please read the Financial Services Guide, Product Disclosure Statement, Target Market Determination and Terms of Business at fxcm.com
The Bitcoin Cash bull runLong entry: 200 USD
Take profit: between 0,4 million and 2,4 million USD
In my opinion there is a high probability that it will reach between 1 and 2.4 million, 1.2 million could be a likely target.
This is my personal opinion and this is not a financial advice! Good trading!
BCH USDT SHORT SIGNALBCH/USDT – Trade Setup (SHORT)
📈 Position Type: short
🕒 Timeframe: 4 H
📊 Market: Futures
💰 Entry Zone:
194
201.42
🛑 Stop-Loss:
205.40
🎯 Take-Profit Targets:
• TP1: 181.24
• TP2: 163.71
• TP3: 149.74
• TP4: 129.87
TP5:
⚙️ Leverage:
5–3
⚠️ After reaching TP1, move Stop-Loss to Entry Price.
📌 Risk Management:
Risk only 1–2% of your capital per trade.
Always confirm the setup on your chart before entry
Bitcoin Cash Price Action SoonBitcoin Cash is setting up it's micro retract beautifully.
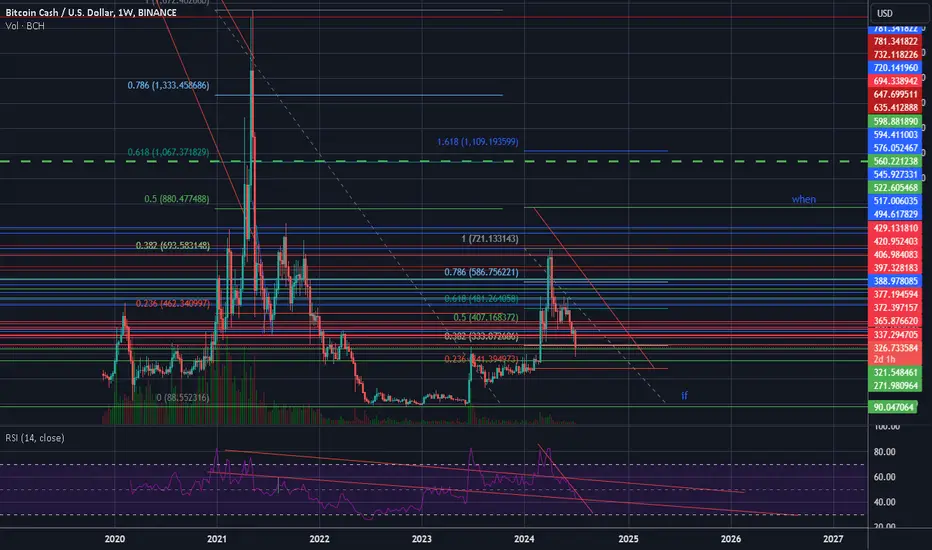
If this coin triple bottoms at $90, I would be inclined to pay attention. BCH is volatile and loves volatility funnels, it always follow fib retracements.
If BCH closes at $90 within the next few months (this month?), the micro retrace to the upside is almost identical to BCH's macro target at .50 fib retracement;
that target zone is $883
$1068 is the .61 target.
This macro/micro target is based on Binance's chart history on Tradingview.
The true macro target is much larger based on other exchanges true BCH history - a different chart.
The market is punishing weak altcoins!Over the past three months, BCHAUD, LRCUSD, ADAUSD, SANUSD, and XTZUSD have been among the weakest cryptocurrencies in their group. Their decline is driven not by a single factor, but by a combination of market fear, declining interest in older altcoins, and specific issues within the projects themselves. Even positive news such as network upgrades or new product launches has so far failed to restore investor confidence.
Decline factors:
BCHAUD: the upgrade failed to trigger a recovery . The network received a major technical upgrade, but the market reacted calmly: amid the broader crypto downturn, BCH continued to lose ground.
LRCUSD: delisting hit investor confidence . The removal of LRC from major exchanges significantly reduced its accessibility and increased concerns about the project’s future.
ADAUSD: internal signals alarmed the market . ADA’s decline accelerated following news of ecosystem issues, the cancellation of a major event, and doubts about the sustainability of certain projects.
SANUSD: interest in the metaverse remains weak . Even the launch of a new AI tool failed to shift sentiment, as investors still do not see a quick return in demand for gaming and metaverse tokens.
XTZUSD: a roadmap exists, but the market is waiting for results . XTZ is preparing important updates, yet its price continues to suffer from weak interest in altcoins and a lack of strong inflow from new buyers.
BCHAUD, LRCUSD, ADAUSD, SANUSD, and XTZUSD may remain under downward pressure if the overall crypto market stays weak. For these coins, simply announcing updates is no longer enough—investors want to see real growth in users, trading volumes, and trust.
Until that happens, any rebounds may remain short-lived. Projects facing liquidity issues, delistings, internal conflicts, or weak demand for their core concept appear especially vulnerable.
BCHUSD Price-Volume Breakout Ignites Recovery Ichimoku Eyes$300Ichimoku analysis (4 -hour chart)
Tenken-Sen- $212.61
Kijun-Sen- $212.61
OBV(Volume indicator) - Showing a nice uptick (indicates price-volume breakout)
BCHUSD showed a nice pullback after a massive sell-off. It hits a intraday high of $229.56 and is currently trading around $229.15. Overall trend is bullish as long as support $190 holds.
The pair holds above the short-term (34 and 55-day EMA) and below the long-term moving average (200-day EMA).
The near-term resistance is around $240 (Span B) any indicative breach above will take the pair to $288/$300. On the lower side, immediate support is $190, and any violation below targets $165/$150.
It is good to buy on dips around $220 with SL around $190 for TP of $285/$300.
I've lost my patience with BCHMoB point... (682) I don't have much hope for pump... If the whales decide to buy... all of the above targets are possible and easy.
1. Picture before my patience runs out
2. Picture what I would like before my patience runs out.
P.S.
BCH at $5.500 || market cap $111,00B
BCH at $16.500 || market cap $333,00B
BCH 7000$ FIRST TARGET !!For the formation to be considered correct, there must be an explosion. The prices must be very high, which we will see, as we are in wave 3 of wave 3, it is the strongest wave and there is a lot of euphoria in such movements.
How will it fit in with geopolitical developments? I have no idea.
Bitcoin Cash (BCHUSD) Weekly: Aggressive Capitulation Bitcoin Cash ( COINBASE:BCHUSD - Coinbase) is undergoing an aggressive, high-volume capitulation phase on the Weekly (1W) chart. As objective technical analysts, we must respect the raw momentum of this downside expansion and avoid catching a falling knife before major macro key levels are reached.
### Technical Breakdown & Momentum Matrix:
* **The Dual EMA Breakdown:** The weekly structural picture completely deteriorated following a decisive bearish cross between the **17-period Exponential Moving Average (17 EMA - red line)** and the **72-period Exponential Moving Average (72 EMA - blue line)**.
* **The Liquidity Vacuum:** Once the intermediate structural floor near $360.00 surrendered to intense distribution, BCH entered a severe liquidity vacuum. The absence of historical volume clusters explains the current vertical decline, driving price action down to the current **224.34** zone with absolute velocity.
### The Realistic Target Areas (The Search for a Bottom):
Due to the sheer force of the current weekly red bars, trying to force an early reversal setup carries an extremely poor probability. Instead, we map out the logical institutional interest baselines:
1. **The Primary Target Wall (170.18):** As identified by the upper horizontal red line, the **170.00 - 175.00** region represents a critical historical resistance point from past market cycles. By market structure polarity rules, this zone stands as the first high-probability demand block where institutional buying absorption might attempt a localized defensive stand.
2. **The Macro Absolute Floor (92.54):** In an extreme capitulation or extended multi-month crypto flush scenario, the ultimate historical accumulation baseline remains firmly anchored at the lower red horizontal wall near **92.54**.
### Tactical Blueprint:
There is currently no price action validation, exhaustion signature, or bullish structural shift (CHoCH) on lower timeframes to justify long exposure. The professional playbook dictates complete patience: we will let the price cascade into the major **170.18 horizontal support zone** and monitor the subsequent weekly candle closes for volume deceleration or long lower rejection wicks before defining any swing parameters.
---
📊 **ProData Chart** | By Rogerio Zaglia
*Technical Analysis, Crypto Asset Liquidity & Risk Mitigation Strategy.*
⚠️ **Disclaimer:** For educational and informational purposes only. This study does not constitute investment advice, trading recommendations, or an endorsement to buy or sell.
BCHUSD H1 | Bearish Continuation SetupBased on the H1 chart analysis, we could see the price rise to our sell entry level at 295.39, which is a pullback resistance that aligns with the 61.8% and the 23.6% Fibonacci retracement.
Our stop loss is set at 305.46, which is a pullback resistance that aligns with the 38.2% Fibonacci retracement.
Our take profit is set at 278.20, which is a pullback support.
High Risk Investment Warning
Stratos Markets Limited fxcm.com Stratos Europe Ltd fxcm.com
CFDs are complex instruments and come with a high risk of losing money rapidly due to leverage. 69% of retail investor accounts lose money when trading CFDs with this provider. You should consider whether you understand how CFDs work and whether you can afford to take the high risk of losing your money.
Stratos Global LLC fxcm.com Losses can exceed deposits.
Please be advised that the information presented on TradingView is provided to FXCM (‘Company’, ‘we’) by a third-party provider (‘TFA Global Pte Ltd’). Please be reminded that you are solely responsible for the trading decisions on your account. Any information and/or content is intended entirely for research, educational and informational purposes only and does not constitute investment or consultation advice or investment strategy. The information is not tailored to the investment needs of any specific person and therefore does not involve a consideration of any of the investment objectives, financial situation or needs of any viewer that may receive it. Past performance is not a reliable indicator of future results. Actual results may differ materially from those anticipated in forward-looking or past performance statements. We assume no liability as to the accuracy or completeness of any of the information and/or content provided herein and the Company cannot be held responsible for any omission, mistake nor for any loss or damage including without limitation to any loss of profit which may arise from reliance on any information supplied by TFA Global Pte Ltd.
Stratos Trading Pty. Limited fxcm.com
Trading FX/CFDs carries significant risks. FXCM AU (AFSL 309763), please read the Financial Services Guide, Product Disclosure Statement, Target Market Determination and Terms of Business at fxcm.com