BEAMXUSDT Forming Bllish MomentumBEAMXUSDT is holding steady inside its demand block on the daily timeframe after a healthy pullback from the recent high near $0.0066. Buyers stepped in to defend the $0.0035 to $0.0044 zone, keeping the macro uptrend intact and stabilizing the price around $0.00413.
With this support zone successfully holding off sellers, the chart sets up a strong continuation push toward the upside. The setup maps out an estimated +73.47% move targeting the $0.0072 area, aligning with the next major liquidit
BEAMX / TetherUS
No trades
No trades
In-depth trading ideas
BEAMUSDT: Bearish Trend Shift – Downside Targets in FocusThe previous uptrend has been broken, invalidating the bullish setup.
As long as price remains below 0.0051, the bearish scenario remains valid.
Invalidation: 0.0051
Short-term target: 0.0041
Mid-term target: 0.0035
We will monitor price action for further downside confirmation rather than chasing the move.
Chart:
Risk Warning: This is technical analysis, not financial advice. Always use a stop-loss and manage your risk.
BEAM: Strong Breakout as Buyers Target $0.0083BEAM is showing impressive relative strength while much of the crypto market remains under selling pressure.
Our previous analysis identified the bullish structure and the potential continuation setup. Since then, price has continued higher and broken through the previous resistance area.
Previous analyses:
BEAM: Bullish Structure Holds as Price Approaches Key Resistance
BEAM: Breakout, Pullback and Continuation
Current H4 Setup
BEAM has broken above the previous resistance a
Beam (BEAMX) & the Altcoins bull-market · Growth until 2028Can you see what I see? What one does, the rest follows... All the same chart patterns and market participants behavior continues to repeat, this is good and makes the market easy to predict.
BEAMXUSDT (Beam —Formerly Merit Circle) has been closing weekly-green since late August, week after week after week. This is the same we've seen with many projects. Some sectors move first then others. It is a big market and the energy flows slowly increasing until all corners of the markets are reached. W
BEAM: Bullish Structure Holds as Price Approaches Key ResistanceOur previous BEAM trade is still open. In the original analysis, we outlined a breakout, pullback, and continuation setup:
Previous analysis :
Since then, price has made another important move.
After a sharp correction, BEAM quickly recovered the lost ground, suggesting that buyers remain active around the rising trendline and support area.
The 4H chart is now showing a broader bullish structure, with price forming a pattern resembling an ascending trend and a potential bullish triangle.
BEAM is showing strong bullish momentum...BEAM is showing strong bullish momentum following an extended accumulation period. Price has reclaimed its major moving averages, supported by increasing volume and a developing bullish market structure.
The immediate resistance sits around $0.00337. A confirmed breakout could open the door toward $0.0040–$0.0050, although a short-term pullback remains possible.
The $0.00215 region is an important support zone, aligning with previous resistance and the moving averages. A successful retest coul
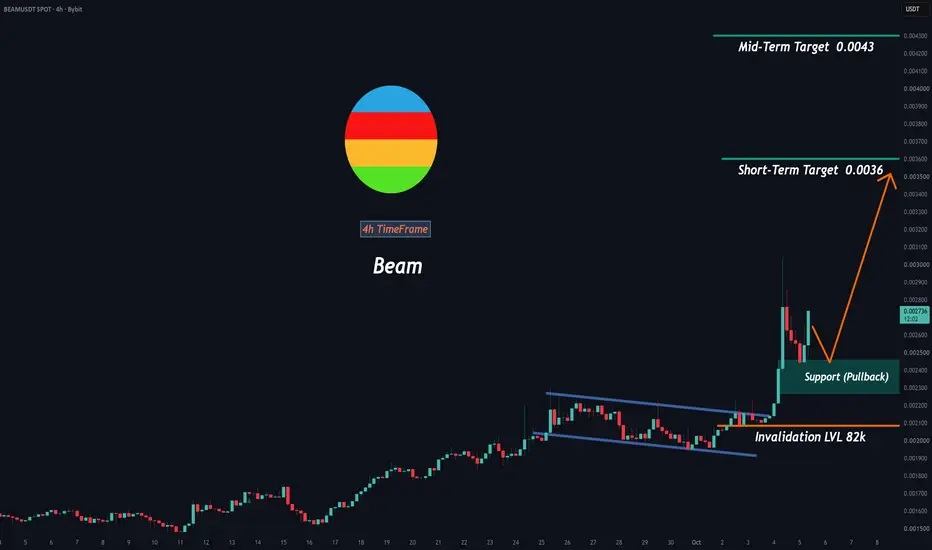
BEAM: Breakout, Pullback and ContinuationCRYPTOCAP:BEAM2 BEAM has broken out of its previous corrective channel and started a new bullish move on the 4H chart.
After the breakout, price expanded quickly, so I’m more interested in the next pullback than chasing the current move.
Trading Setup
Support / Pullback Zone: around 0.0024–0.0025
Short-Term Target: 0.0036
Mid-Term Target: 0.0043
Invalidation: around 0.0020
The preferred scenario is a pullback toward the support area followed by a bullish reaction.
If buyers defend
BEAM (BEAMUSDT) — Key Support & Resistance | Is a Major TrendBEAM (BEAMUSDT) — Key Support & Resistance | Is a Major Trend Reversal Developing?
BEAM | Technical Analysis & Market Structure
Beam (BEAM) is a blockchain ecosystem originally developed within Merit Circle, with a strong foundation in Web3 gaming and expanding activities across decentralized finance, artificial intelligence and digital infrastructure.
Fundamental Perspective
BEAM serves as the ecosystem's utility token, supporting network transactions, governance, staking and ecosystem paym
$BEAM DOWN 93% FROM ATH | IS A 2,500% RALLY POSSIBLE?NASDAQ:BEAM PRICE PREDICTION: DOWN 93% FROM ATH | IS A 2,500% RALLY POSSIBLE?
NASDAQ:BEAM has suffered a brutal correction of approximately 97% and remains around 93% below its March 2024 ATH of $0.044302.
But something interesting is happening.
After potentially bottoming in June 2026, NASDAQ:BEAM has rallied approximately 150% over the last three months.
Here’s My High-Timeframe Trading Plan:
🔹 Bullish Confirmation: $0.002173
🔹 Accumulation Zone: $0.0017–$0.0014
🔹 Targets: $0.00325/$0.
BEAMX Descending Trendline, Breakout or Rejection?📊 Technical Analysis
💵 Pair: BEAMX/USDT
⏳ Time Frame: 4D
📉 Pattern: Descending Trendline
📍 Condition: Price is still under pressure from the descending trendline.
The chart shows a Descending Trendline formed by a series of lower highs since the peak around 0.041090 USDT. The yellow trendline has repeatedly acted as dynamic resistance and kept the overall price structure bearish.
However, price has now moved closer to the lower section of the trendline and is beginning to show a consolidation
BEAM/USDT: Accumulation Range Breakout & Support Retest SetupBEAM has broken out above a prolonged horizontal consolidation range after accumulating inside the green demand zone. Price action is currently pushing above resistance near $0.001695, signaling potential trend continuation toward upper liquidity targets.
Key Observations:
Accumulation Zone: Price consolidated cleanly inside the green range before breaking above resistance.
Breakout & Retest: Looking for a pullback/retest into broken resistance (turning into support around $0.001672 - $0.0016
$beamxanyone know if this bubba is still alive or not ?
guess does not matter once the bull starts everything pumps
so scaling into this over this week till we flip the 200 ema
shall keep adding the lower we get but would not want to see us loose the 50 ema worsecase the yellow thick line below
target .0044 and then infinity
BEAM is over priced right nowPrice tricked buy and sell biased traders then took out their buy and sell orders between 10 to 19 july then the buyers control shifted to the sellers on the 19th and a pullback got more sniper traders in just for price to go higher and stop them out.
The Market makers are satisfied with this unloading phase
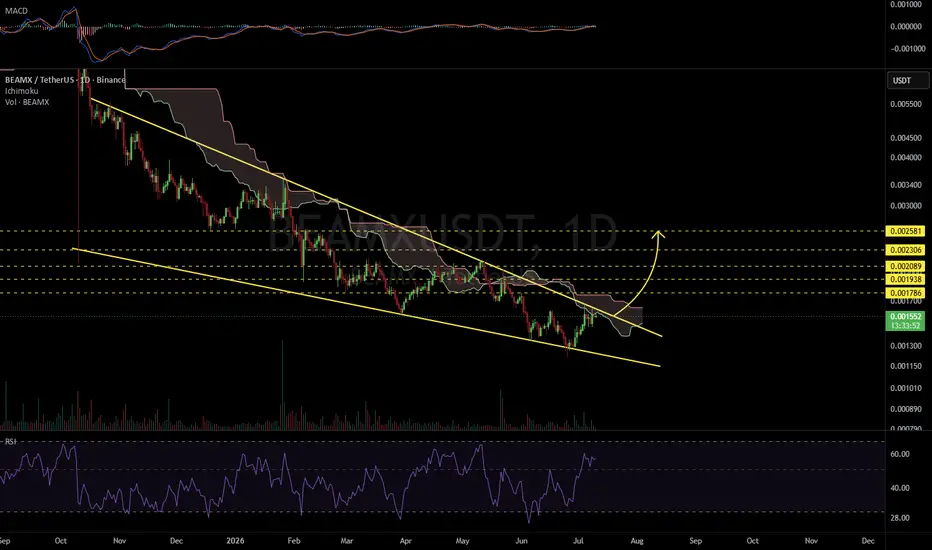
BEAMXUSDT 1D#BEAMX is moving inside a falling wedge pattern on the daily chart.
In case of a breakout above the wedge resistance and the Ichimoku cloud, the potential upside targets are:
🎯 $0.001786
🎯 $0.001938
🎯 $0.002089
🎯 $0.002306
🎯 $0.002581
⚠️ Always remember to use a tight stop-loss and maintain proper risk management.
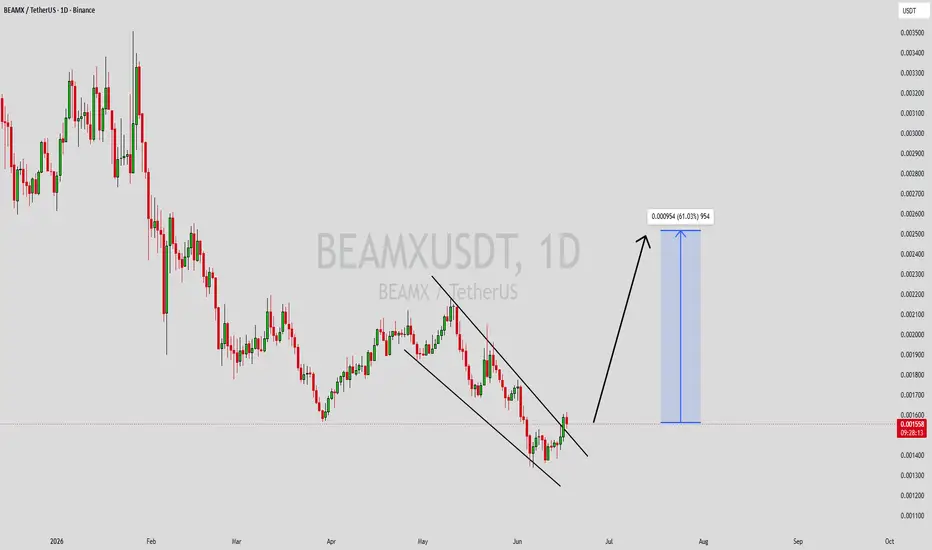
BEAMXUSDT Forming Falling WedgeBEAMXUSDT is forming a clear falling wedge pattern, a classic bullish wave signal that often indicates an upcoming breakout. The price has been consolidating within a narrowing range, suggesting that selling pressure is weakening while buyers are beginning to regain control. With consistent volume confirming accumulation at lower levels, the setup hints at a potential bullish breakout soon. The projected move could lead to an impressive gain of around 40% to 50% once the price breaks above the w
BEAMXUSDT Forming Falling WedgeBEAMXUSDT is forming a clear falling wedge pattern, a classic bullish wave signal that often indicates an upcoming breakout. The price has been consolidating within a narrowing range, suggesting that selling pressure is weakening while buyers are beginning to regain control. With consistent volume confirming accumulation at lower levels, the setup hints at a potential bullish breakout soon. The projected move could lead to an impressive gain of around 50% to 60% once the price breaks above the w
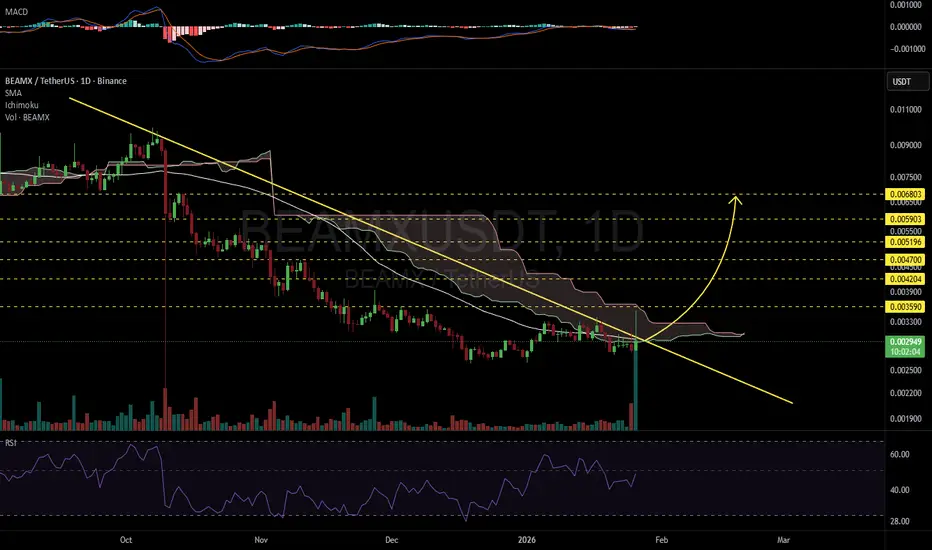
BEAMXUSDT 1D#BEAMX is facing a resistance cluster that includes the trendline, the daily SMA50, and the Ichimoku cloud. Volume has increased strongly, and RSI suggests a potential breakout. Keep a close eye on it. If a breakout occurs, the potential upside targets are:
🎯 $0.003590
🎯 $0.004204
🎯 $0.004700
🎯 $0.005196
🎯 $0.005903
🎯 $0.006803
⚠️ Always apply tight stop-losses and maintain strict risk management.
BEAMXUSDT Forming Falling WedgeBEAMXUSDT is forming a clear falling wedge pattern, a classic bullish reversal signal that often indicates an upcoming breakout. The price has been consolidating within a narrowing range after the recent down move, suggesting that selling pressure is gradually weakening while buyers are starting to regain control. With consistent volume confirming accumulation at these lower levels, the setup is hinting at a potential bullish breakout soon. If the price breaks decisively above the wedge resistan
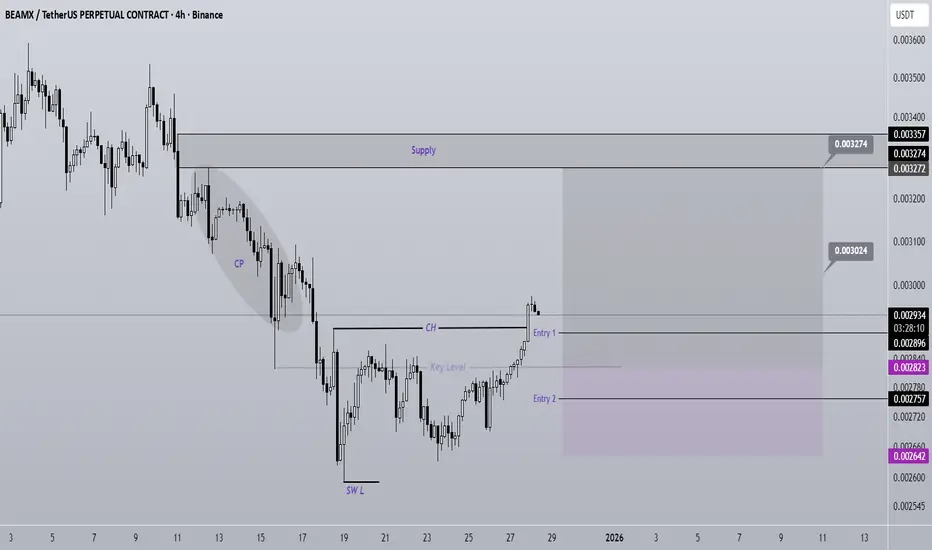
BEAMX Analysis (4H)Market makers, in this weak and low-volatility market, are hunting for liquidity. Bullish momentum on this asset is very weak, and the previous trend is bearish, which causes most traders to look for sell/short positions.
However, there are signs on the chart indicating a potential stop hunt for sellers.
Price is currently trading at a key level, and we have a bullish CH (Change of Character) after a bearish consolidation/compression.
We have two entry points, which can be executed using a DC
BEAM is showing strength as it finds its bottomBEAM is ranging sideways and has shown that selling pressure has diminished, indicating that sellers are likely exhausted. The good news is that the recent recovery was strong and is now looking for a breakout. In addition, momentum and trend oscillators are suggesting a continuation up as it enters oversold conditions.
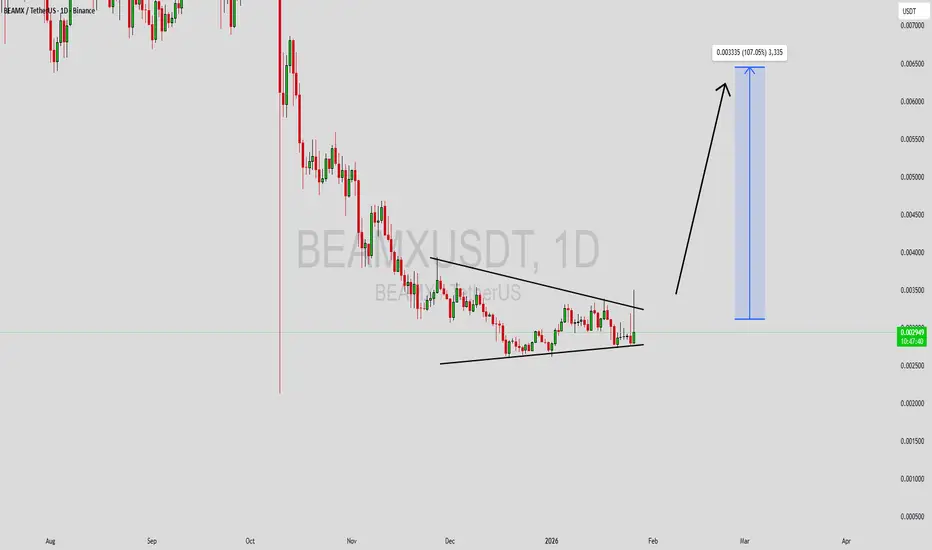
$BEAMX Breakout bullish symmetrical pattern in Daily time frame
**Execute the trade**
Once the breakout is confirmed, there are two primary entry strategies:
**Aggressive entry**: Enter a long position immediately after a candle closes above the upper trendline.
**Conservative entry:** Wait for a retest of the broken trendline, which now acts as a support level. Enter a long position when the price bounces off this line. This approach offers a tighter stop-loss but may cause you to miss the trade if the price does not retest the trendline.
@everyone
BEAMXUSDT 1D#BEAMX is moving within a symmetrical triangle. Consider buying at the current price and near the support levels of $0.007523 and $0.007035. If it breaks out above the triangle resistance, the targets are:
🎯 $0.008218
🎯 $0.008780
🎯 $0.009342
🎯 $0.010141
🎯 $0.011160
⚠️ Always remember to use a tight stop-loss and follow proper risk management.