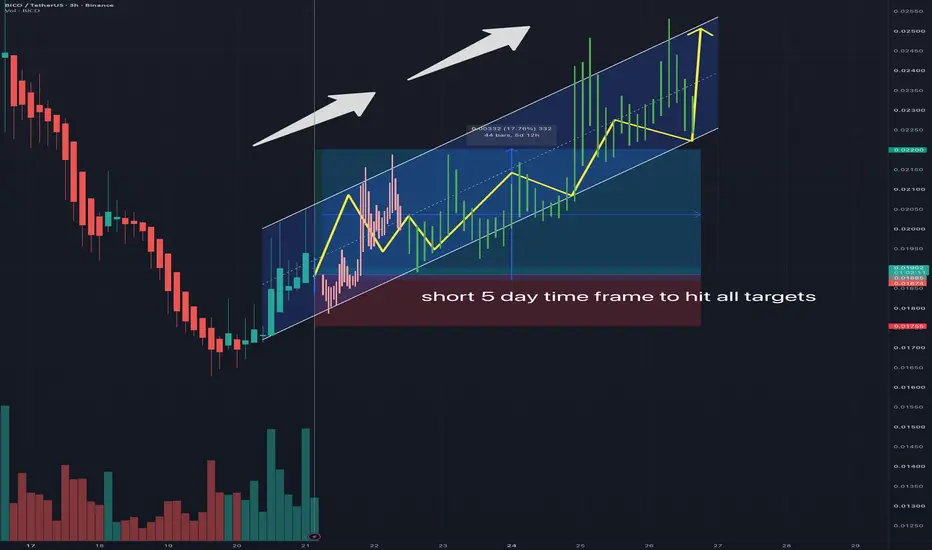
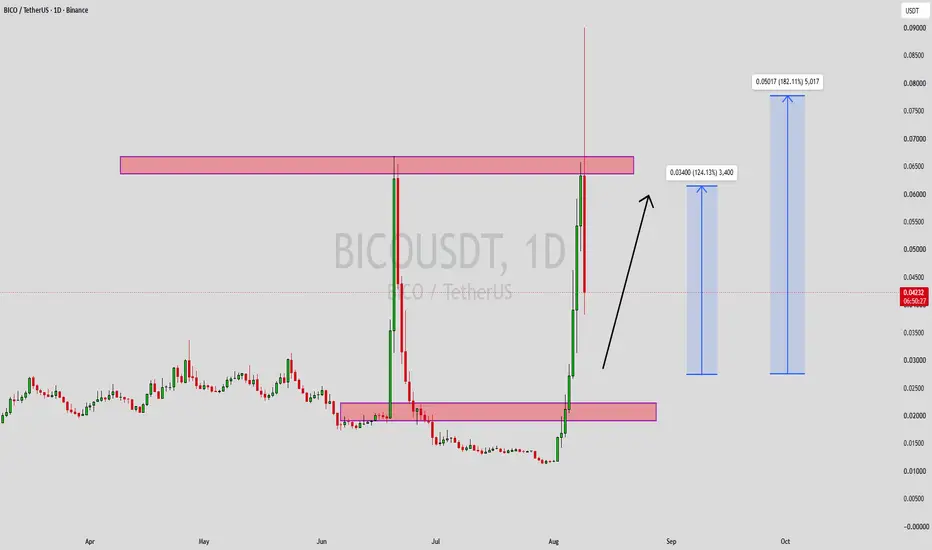
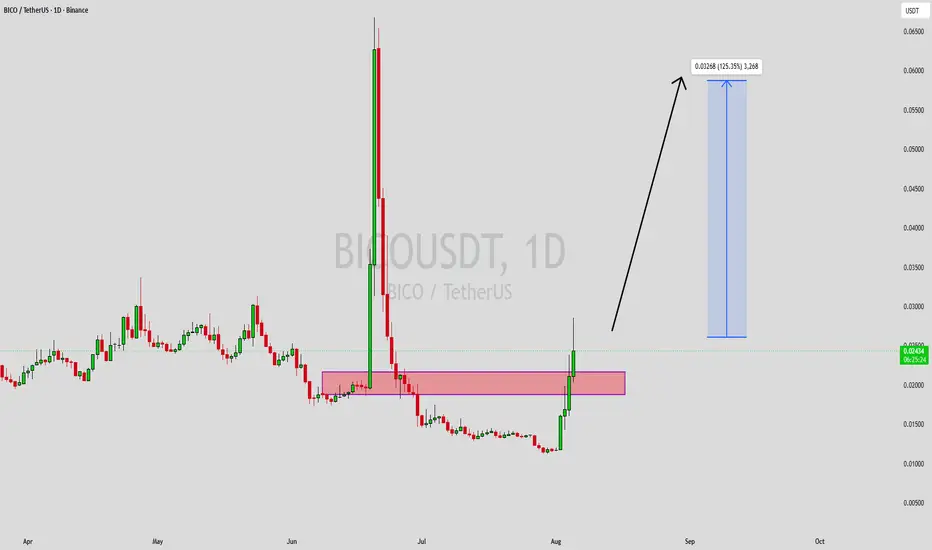
BICO/USDT: Long Setup — Accumulation Base Target +428% ExpansionBiconomy ( OMXSTO:BICO ) is establishing a long-term accumulation base around the **$0.0185 – $0.0195** demand floor. Following an extended contraction phase, momentum indicators are showing signs of absorption near historical multi-year lows, setting up a macro expansion attempt toward major overhe
Compare with BICO / TetherUS
BICO: An Oversold 15m Chart Primed for a Bounce BYBIT:BICOUSDT.P
BICO — Long
Stop loss: 0.021372
Take profit: 0.022227
EMA5 at 0.0216 climbing above the close at 0.0217 adds extra juice to the long outlook 🚀. Aroon Up at 64.29 points to possible continuation in the uptrend, aligning with your long bias. Bollinger Bands show the upper
BICO/USDT (1h) Developing Inside a Falling WedgeBICO/USDT is trading inside a large falling wedge on the 1H chart, with price continuing to form lower highs while the lower support trendline declines at a much slower pace. The structure has been gradually tightening following the sharp move from the $0.032 area.
Price is currently trading around
BICOUSDT Forming Bullish MomentumBICOUSDT is forming a clear bullish momentum pattern, a classic bullish reversal signal that often indicates an upcoming breakout. The price has been consolidating within a narrowing range, suggesting that selling pressure is weakening while buyers are beginning to regain control. With consistent vo
BICOUSDT Forming Bullish MomentumBICOUSDT is forming a clear bullish momentum pattern, a classic bullish wave signal that often indicates an upcoming breakout. The price has been consolidating within a narrowing range, suggesting that selling pressure is weakening while buyers are beginning to regain control. With consistent volume
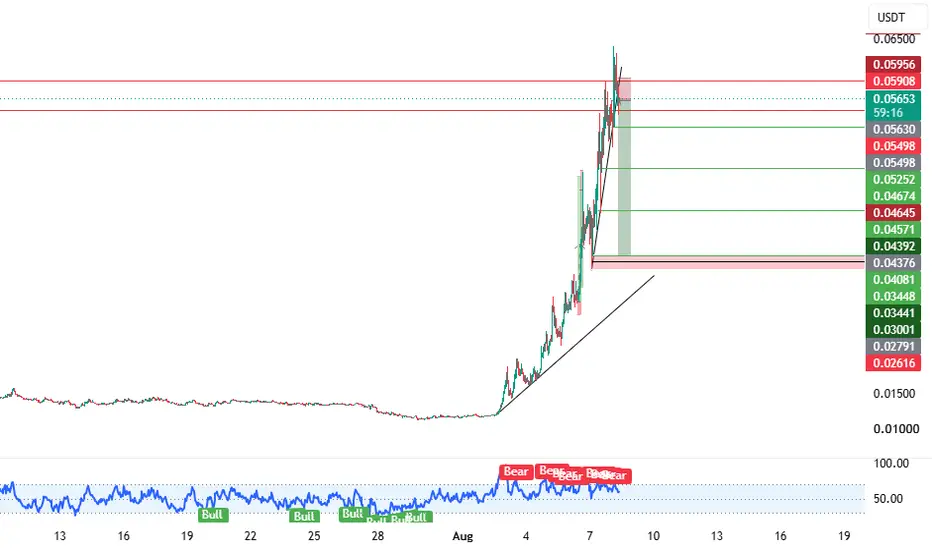
BICO USDT SHORT SIGNAL#28.bico/USDT – Trade Setup (SHORT)
📈 Position Type: SHORT
🕒 Timeframe: 1H
📊 Market: Futures
💰 Entry Zone:
0.05631
🛑 Stop-Loss:
0.05956
🎯 Take-Profit Targets:
• TP1: 0.05252
• TP2: 0.04675
• TP3: 0.04081
• TP4. 0.03441
Tp5.
⚙️ Leverage:
5*3
▫️ After TP1, move SL to Entry + 0.2%.
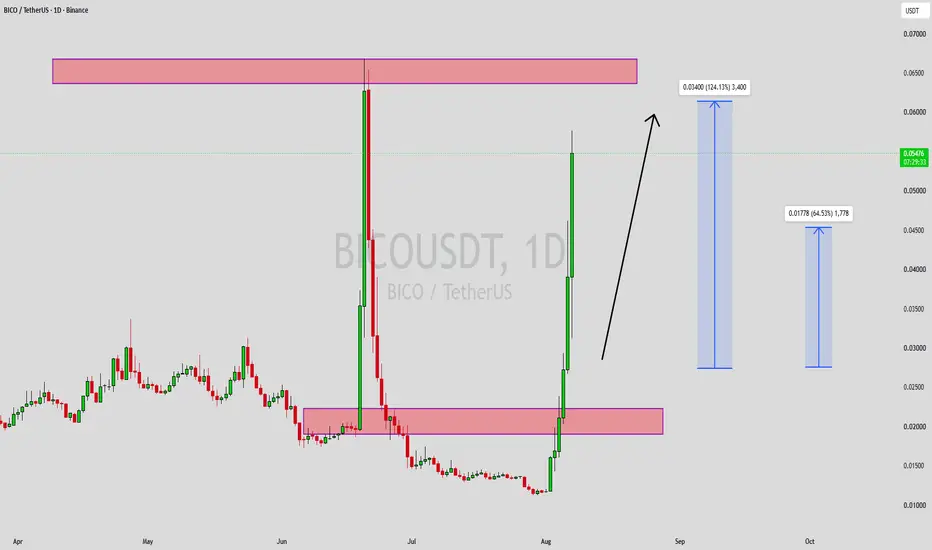
BICO PRICE SURGES AFTER ROCK BOTTOMOMXSTO:BICO surged massively on August 3, 2026, following an all-time low on July 30. The rally is attributed to a short squeeze where short positions lost $273.17K. The price is attempting to break out of a descending channel that has been in place since mid-June. This is a technically-driven boun
BICOUSDT Forming Bullish MomentumBICOUSDT is forming a clear bullish momentum pattern, a classic bullish wave signal that often indicates an upcoming breakout. The price has been consolidating within a narrowing range, suggesting that selling pressure is weakening while buyers are beginning to regain control. With consistent volume
See all ideas
Summarizing what the indicators are suggesting.
Oscillators
Neutral
Oscillators
Neutral
Summary
Neutral
Summary
Neutral
Summary
Neutral
Moving Averages
Neutral
Moving Averages
Neutral
Displays a symbol's price movements over previous years to identify recurring trends.
Frequently asked questions
The current price of BICO / TetherUS (BICO) is 0.02236 USDT — it has risen 2.37% in the past 24 hours. Try placing this info into the context by checking out what coins are also gaining and losing at the moment and seeing BICO price chart.
BICO / TetherUS price has risen by 4.03% over the last week, its month performance shows a −4.59% decrease, and as for the last year, BICO / TetherUS has decreased by −76.78%. See more dynamics on BICO price chart.
Keep track of coins' changes with our Crypto Coins Heatmap.
BICO / TetherUS (BICO) reached its highest price on Dec 9, 2021 — it amounted to 7.99900 USDT. Find more insights on the BICO price chart.
See the list of crypto gainers and choose what best fits your strategy.
BICO / TetherUS (BICO) reached the lowest price of 0.01124 USDT on Jul 29, 2026. View more BICO / TetherUS dynamics on the price chart.
See the list of crypto losers to find unexpected opportunities.
The safest choice when buying BICO is to go to a well-known crypto exchange. Some of the popular names are Binance, Coinbase, Kraken. But you'll have to find a reliable broker and create an account first. You can trade BICO right from TradingView charts — just choose a broker and connect to your account.
Crypto markets are famous for their volatility, so one should study all the available stats before adding crypto assets to their portfolio. Very often it's technical analysis that comes in handy. We prepared technical ratings for BICO / TetherUS (BICO): today its technical analysis shows the buy signal, and according to the 1 week rating BICO shows the sell signal. And you'd better dig deeper and study 1 month rating too — it's neutral. Find inspiration in BICO / TetherUS trading ideas and keep track of what's moving crypto markets with our crypto news feed.
BICO / TetherUS (BICO) is just as reliable as any other crypto asset — this corner of the world market is highly volatile. Today, for instance, BICO / TetherUS is estimated as 4.24% volatile. The only thing it means is that you must prepare and examine all available information before making a decision.
You can discuss BICO / TetherUS (BICO) with other users in our public chats, Minds or in the comments to Ideas.