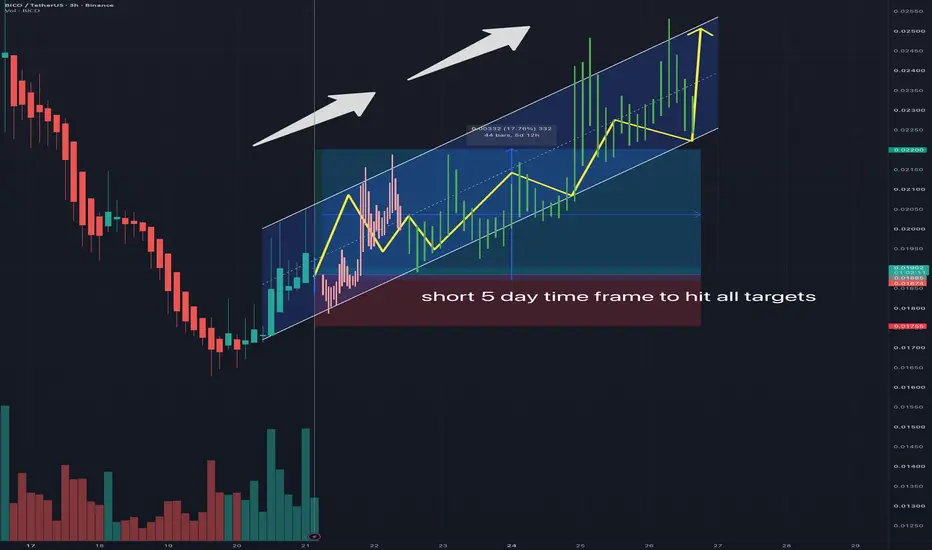
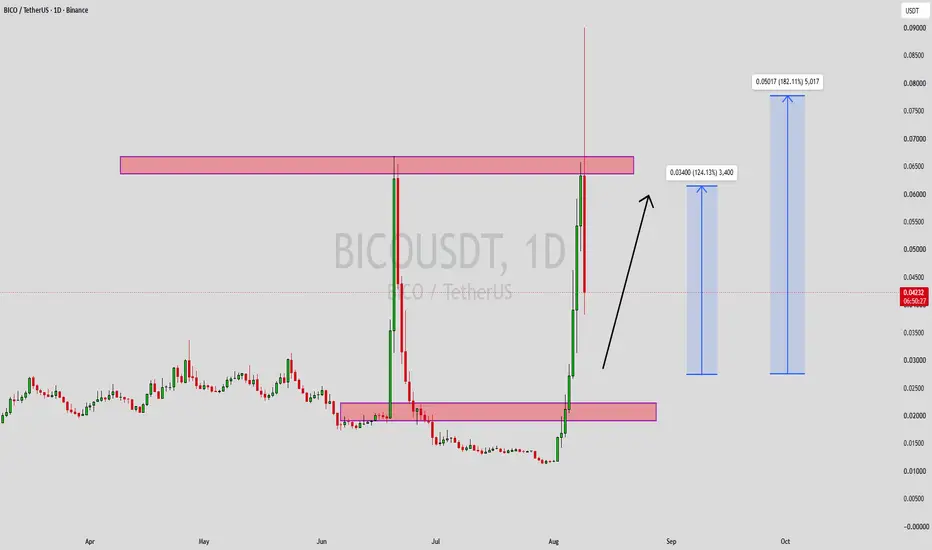
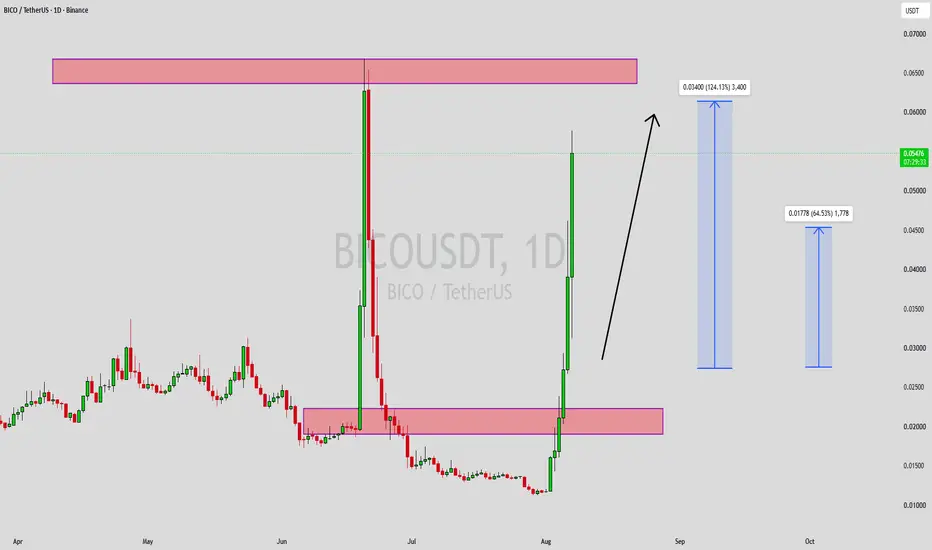
BICO/USDT: Long Setup — Accumulation Base Target +428% ExpansionBiconomy ( OMXSTO:BICO ) is establishing a long-term accumulation base around the **$0.0185 – $0.0195** demand floor. Following an extended contraction phase, momentum indicators are showing signs of absorption near historical multi-year lows, setting up a macro expansion attempt toward major overhead liquidity targets.
A high-volume daily close above $0.0225 confirms buyer strength and opens the path for a sustained macro rebound targeting upper supply pools.
*(Educational analysis only. Alwa
In-depth trading ideas
BICO: An Oversold 15m Chart Primed for a Bounce BYBIT:BICOUSDT.P
BICO — Long
Stop loss: 0.021372
Take profit: 0.022227
EMA5 at 0.0216 climbing above the close at 0.0217 adds extra juice to the long outlook 🚀. Aroon Up at 64.29 points to possible continuation in the uptrend, aligning with your long bias. Bollinger Bands show the upper band at 0.0221, hinting there's room towards your target 🎯. Stochastic RSI D at 15.80 hints it's oversold, laying the groundwork for a bounce 🔄. Parabolic SAR at 0.0220 nearing transition supports po
BICO/USDT (1h) Developing Inside a Falling WedgeBICO/USDT is trading inside a large falling wedge on the 1H chart, with price continuing to form lower highs while the lower support trendline declines at a much slower pace. The structure has been gradually tightening following the sharp move from the $0.032 area.
Price is currently trading around $0.0218, still below the descending resistance. A confirmed breakout above the upper trendline could signal a bullish reversal and open the way toward the $0.030–$0.031 target area. A breakdown below
BICOUSDT Forming Bullish MomentumBICOUSDT is forming a clear bullish momentum pattern, a classic bullish reversal signal that often indicates an upcoming breakout. The price has been consolidating within a narrowing range, suggesting that selling pressure is weakening while buyers are beginning to regain control. With consistent volume confirming accumulation at lower levels, the setup hints at a potential bullish breakout soon. The projected move could lead to an impressive gain of around 40% to 50% once the price breaks above
BICOUSDT Forming Bullish MomentumBICOUSDT is forming a clear bullish momentum pattern, a classic bullish wave signal that often indicates an upcoming breakout. The price has been consolidating within a narrowing range, suggesting that selling pressure is weakening while buyers are beginning to regain control. With consistent volume confirming accumulation at lower levels, the setup hints at a potential bullish breakout soon. The projected move could lead to an impressive gain of around 140% to 150% once the price breaks above t
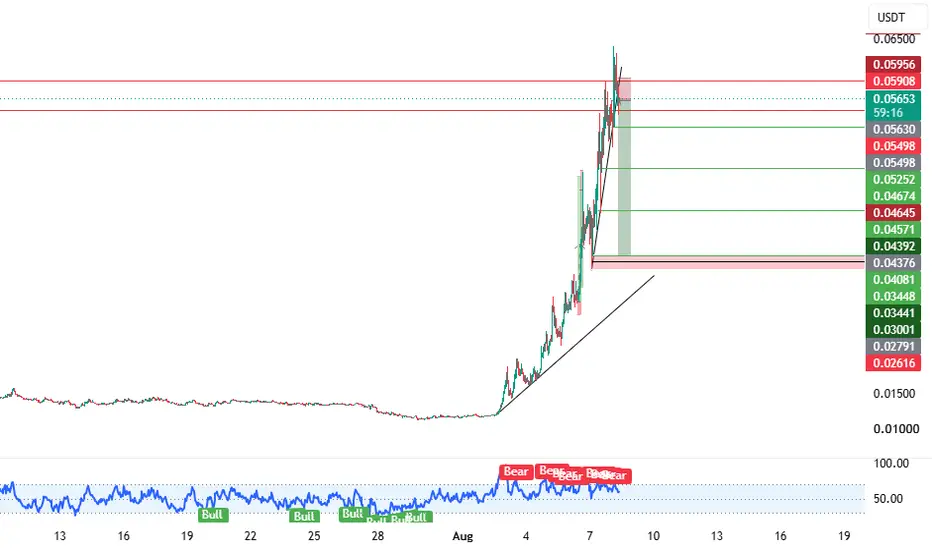
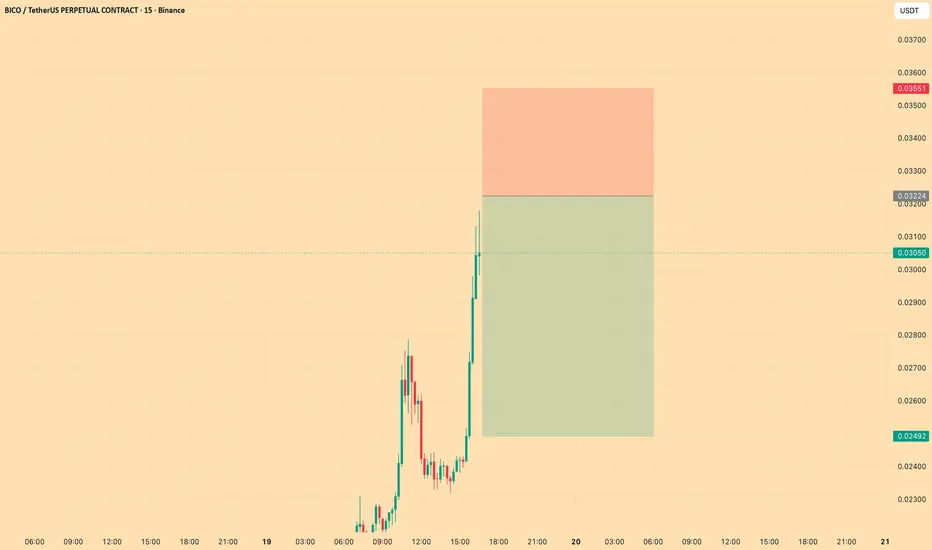
BICO USDT SHORT SIGNAL#28.bico/USDT – Trade Setup (SHORT)
📈 Position Type: SHORT
🕒 Timeframe: 1H
📊 Market: Futures
💰 Entry Zone:
0.05631
🛑 Stop-Loss:
0.05956
🎯 Take-Profit Targets:
• TP1: 0.05252
• TP2: 0.04675
• TP3: 0.04081
• TP4. 0.03441
Tp5.
⚙️ Leverage:
5*3
▫️ After TP1, move SL to Entry + 0.2%.
▪️ Exit Plan:
• 40% at TP1
• 20% at TP2
• 20% at TP3
20% at TP4
📌 Risk Management:
Risk only 1–2% of your capital per trade.
⚠️ Always check and confirm the setup on your chart before entering the
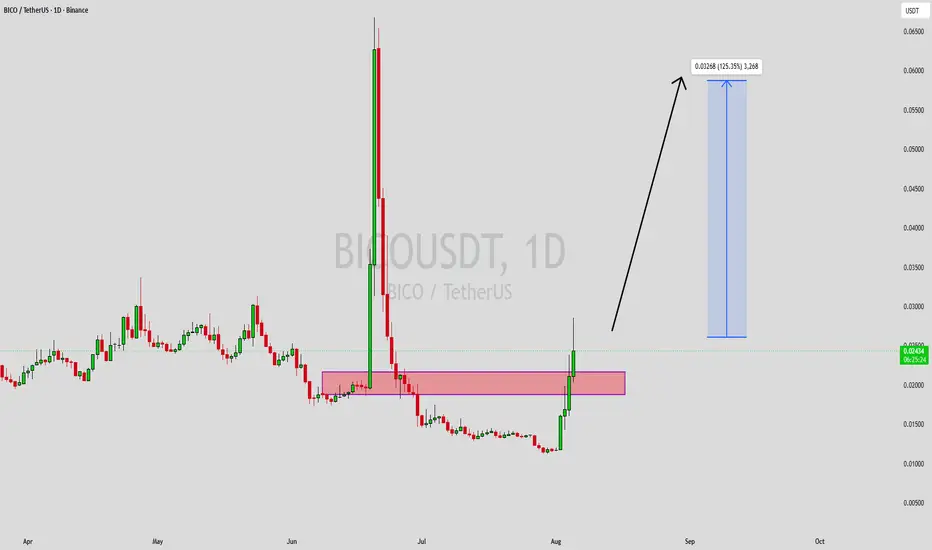
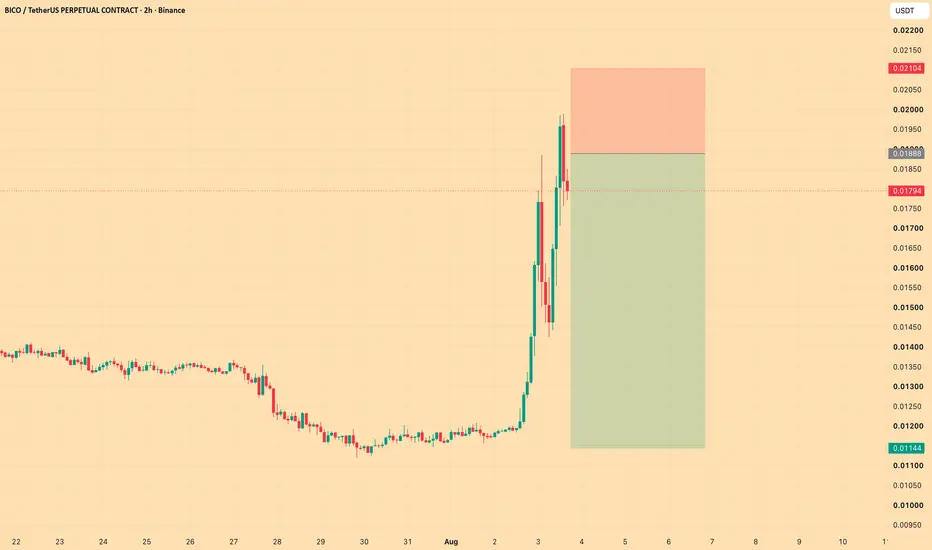
BICO PRICE SURGES AFTER ROCK BOTTOMOMXSTO:BICO surged massively on August 3, 2026, following an all-time low on July 30. The rally is attributed to a short squeeze where short positions lost $273.17K. The price is attempting to break out of a descending channel that has been in place since mid-June. This is a technically-driven bounce that could signal a local bottom, but the sustainability is questionable. The move is fueled by leveraged positions unwinding, not fundamental improvement, making a quick reversal likely if buying
BICOUSDT Forming Bullish MomentumBICOUSDT is forming a clear bullish momentum pattern, a classic bullish wave signal that often indicates an upcoming breakout. The price has been consolidating within a narrowing range, suggesting that selling pressure is weakening while buyers are beginning to regain control. With consistent volume confirming accumulation at lower levels, the setup hints at a potential bullish breakout soon. The projected move could lead to an impressive gain of around 90% to 100% once the price breaks above th
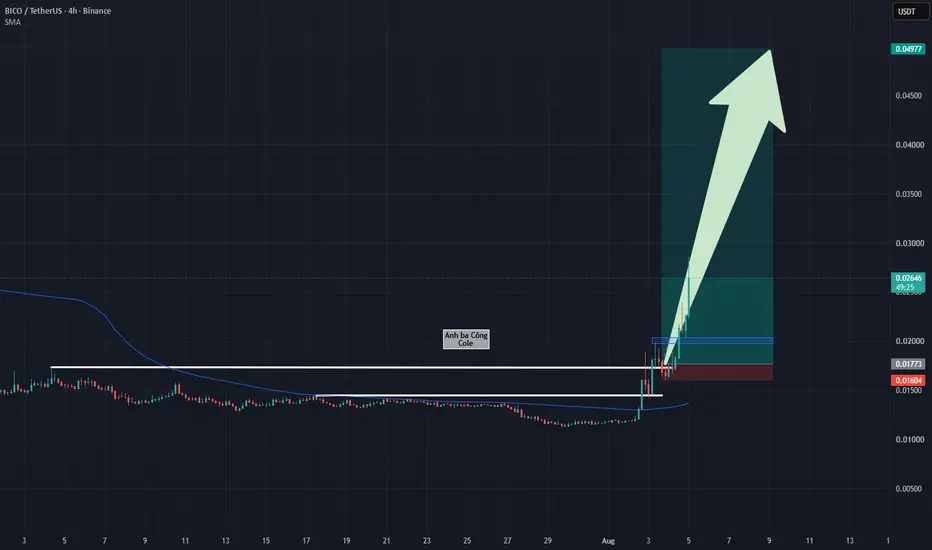
BICO: Explosive Rally Reaches 4R TargetBICO: Explosive Rally Reaches 4R Target – Chasing Risk Warning and Safe Pullback Execution Setup
BICO has officially confirmed a decisive expansion surge in exact alignment with our prior technical outlook, yielding an impressive 4R profit milestone for early Long entries. Overwhelming buy-side momentum successfully propelled price candles well beyond long-term accumulation ranges, proving that bulls maintain absolute structural control over the market framework.
Observing the visual data fr
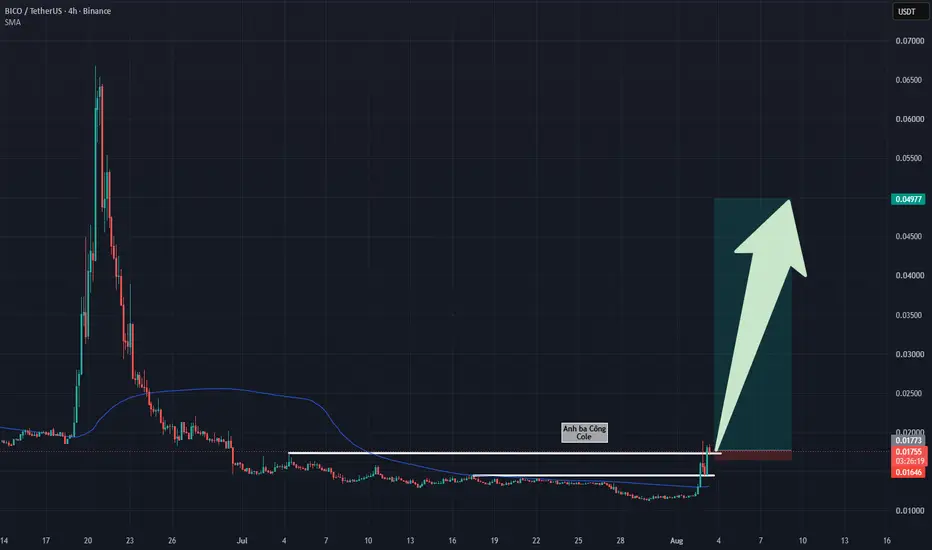
BICO: Sequential Breakouts Above Key Resistance FloorsBICO: Sequential Breakouts Above Key Resistance Floors – Bullish Surge Targets the $0.05 Round Number Baseline
BICO has just flashed a decisive trend breakout signal, officially confirming an explosive expansion wave following a prolonged bottoming phase near the $0.01 level. Overwhelming buying demand swiftly propelled the price action past successive overhead barriers. After an initial push sliced through immediate resistance and printed a brief fakebreak at the secondary level, price action
Biggest rug pull after FTXBiconomy is the biggest rug pull.
Its market cap fell from half a billion to mere 20million. The founders made money by shorting it to 99.80% from the top.
So what is the technicals?? The answer is no technical, no fundamentals, no value and no new updates from the Indian and Saudi Founders.
The next question is when it will be delisted?
Be safe and Binance needs to delist these coins earlier.
BICO — Why This Is One of the Most Attractive Risk-to-Reward Set
Over the past few days, I have been comparing several opportunities across the market, including both BICO and SIREN.
While technical analysis is always my primary focus, I also like to understand what sits behind a project before committing capital. When a technical setup aligns with a project that appears credible and actively developed, the opportunity becomes far more attractive.
Why I Prefer BICO Over SIREN
One of the biggest differences between BICO and SIREN is transparency.
BICO (Bi
Biconomy: 20-30X possible long-term, altcoins already hit bottomThis one looks like an interesting chart with huge growth potential. It seems it will be big.
BICOUSDT started its decent in December 2021 and this one ended late 2022. The market went through a long-term bottom process and there was some growth between 2023 and early 2024. Then we have an even bigger descent, the one shown on this chart. So far, two years long.
The previous one lasted one year and the ensuing bullish phase was a small one, short-lived. This one lasted two years and it seems t
Biconomy: 2,400% Long-Term Target Mapped—Altcoins Bull MarketThe bull market starts in 2026 but it doesn't end in 2026, 2026 is only the start.
Should we call it the 2026 bull market? Normally the year used tends to be the end year. We never say the 2018 bull market nor the 2020 bull market but 2017 (new ATH), 2021 (new ATH), etc.
The 2028-2029 bull market starts now, from a major low in early 2026.
Good morning my fellow Cryptocurrency trader, I hope you are having a wonderful day.
BICOUSDT started its decent in December 2021 and this one ended late
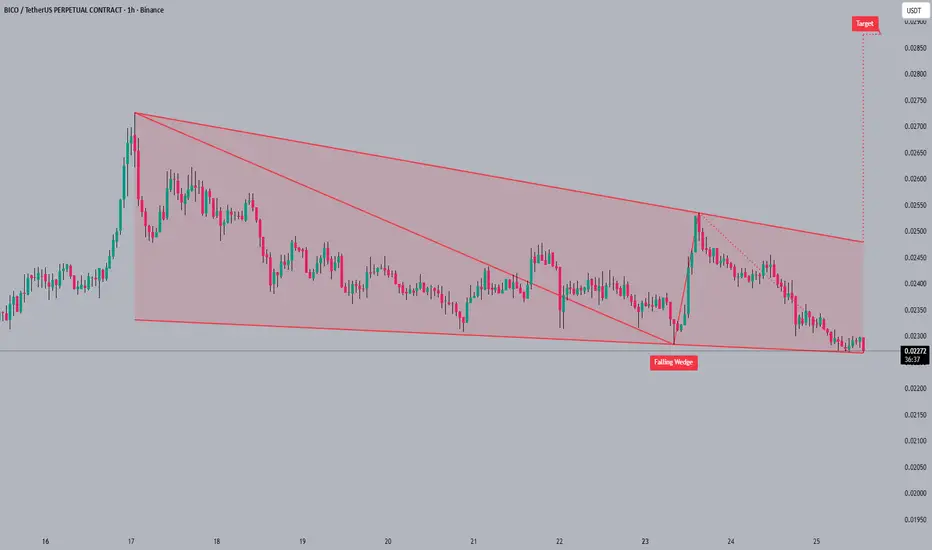
#BICO#BICO is currently testing the lower trendline 🧐 of a falling wedge pattern. The falling wedge is typically a bullish pattern 🐂 suggesting a potential breakout. The next target after a breakout would be around 0.02900 🎯.
Patience is key 🧘 when waiting for confirmation of a breakout before entering a trade.
#BICO #crypto #trading #altcoin
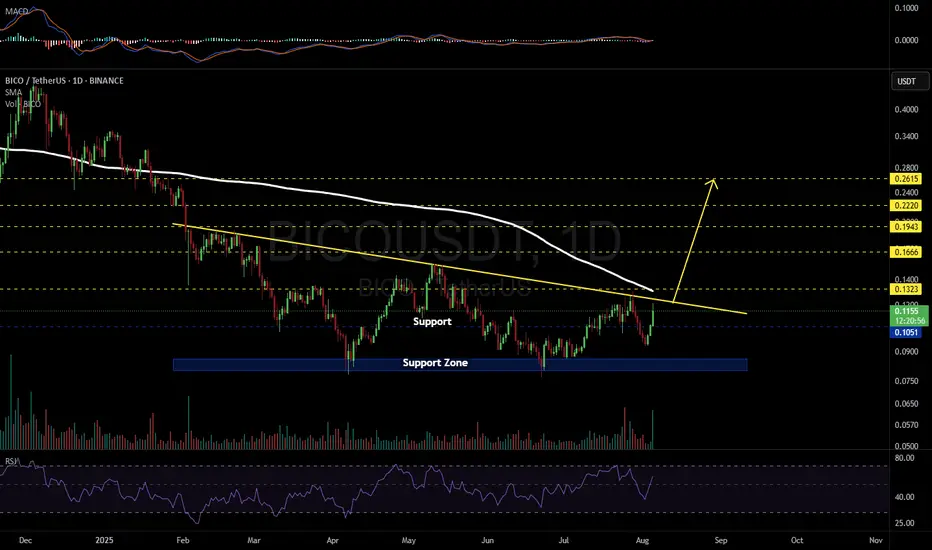
BICOUSDT 1D#BICO has formed a descending triangle on the daily timeframe.
📌 Consider buying at the current price and near the support level at $0.1051.
In case of a breakout above the triangle resistance and the daily SMA200, the potential upside targets are:
🎯 $0.1323
🎯 $0.1666
🎯 $0.1943
🎯 $0.2220
🎯 $0.2615
⚠️ As always, use a tight stop-loss and apply proper risk management.