BIGTIME / BIGTIMEUSDT Long Setup | Breaker Block ReclaimMARKET ANALYSIS
BIGTIME is currently reacting from a key technical area highlighted on the chart.
As long as the protected support zone remains intact, the bullish market structure remains valid and higher liquidity targets may continue to attract price action.
A breakdown below the invalidation level would weaken the current bullish scenario and require a reassessment of market conditions.
📍 Entry, Stop Loss and Take Profit levels are marked directly on the chart.
━━━━━━━━━━━━━━
⚠️ DI
In-depth trading ideas
BIGTIME / BIGTIMEUSDT Long Setup | Breaker Block ReclaimMARKET ANALYSIS
BIGTIME is currently reacting from a key technical area highlighted on the chart.
As long as the protected support zone remains intact, the bullish market structure remains valid and higher liquidity targets may continue to attract price action.
A breakdown below the invalidation level would weaken the current bullish scenario and require a reassessment of market conditions.
📍 Entry, Stop Loss and Take Profit levels are marked directly on the chart.
━━━━━━━━━━━━━━
⚠️ DI
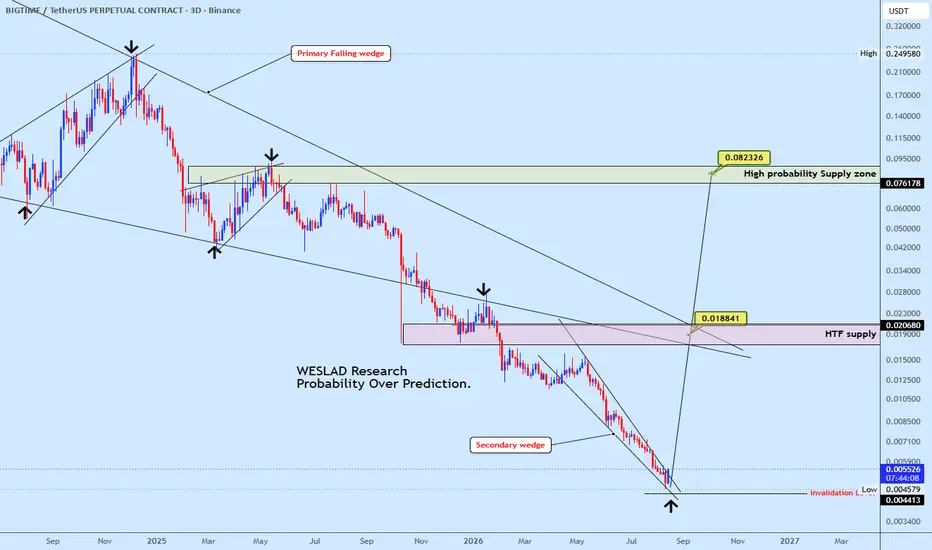
BIGTIME Testing a Critical SupportBIGTIME remains in a prolonged downtrend but has now reached an important support zone, with price attempting to break out of the secondary falling wedge after previously breaking down from the primary falling wedge.
A successful breakout could trigger a relief rally toward the HTF supply zone around $0.01884, where price must reclaim and hold to confirm stronger bullish continuation. Above this zone, the next major target sits around $0.08233, the high-probability supply area.
However, failur
BIGTIME/USDT - Ready To Explode? Major Trendline Breakout?BIGTIME/USDT is starting to show signs of recovery after experiencing a long-term downtrend over the past several months. 🔥
On the 1D timeframe, price is currently testing a major descending trendline that has acted as strong resistance for a long time. Right now, the market is sitting at a critical area that could determine the next major direction. ⚡
━━━━━━━━━━━━━━━━━━
📉 Chart Structure & Pattern
🔻 Descending Trendline (Long-Term Downtrend)
Since the previous peak, BIGTIME has consistentl
BIGTIMEUSDT Forming Bullish MomentumBIGTIMEUSDT is forming a clear bullish momentum pattern, a classic bullish reversal signal that often indicates an upcoming breakout. The price has been consolidating within a narrowing range, suggesting that selling pressure is weakening while buyers are beginning to regain control. With consistent volume confirming accumulation at lower levels, the setup hints at a potential bullish breakout soon. The projected move could lead to an impressive gain of around 70% to 80% once the price breaks ab
BIGTIMEUSDT 1DConsider buying a small bag of #BIGTIME. In case of a breakout above the resistance cluster, which includes the descending resistance, the Ichimoku Cloud, and the daily SMA50, the potential upside targets are:
🎯 $0.01474
🎯 $0.01666
🎯 $0.01822
🎯 $0.01978
🎯 $0.02199
🎯 $0.02481
⚠️ Always remember to use a tight stop-loss and maintain proper risk management.
BIGTIMEUSDT UPDATEBIGTIME Technical Setup Pattern: Falling Wedge Breakout Current Price: $0.01300 Target Price: $0.01940 Target % Gain: 50.72% BIGTIME is breaking out of a falling wedge on the 1D timeframe with price pushing above resistance and showing early bullish momentum, structure suggests reversal after prolonged downtrend with potential continuation if volume sustains Time Frame: 1D
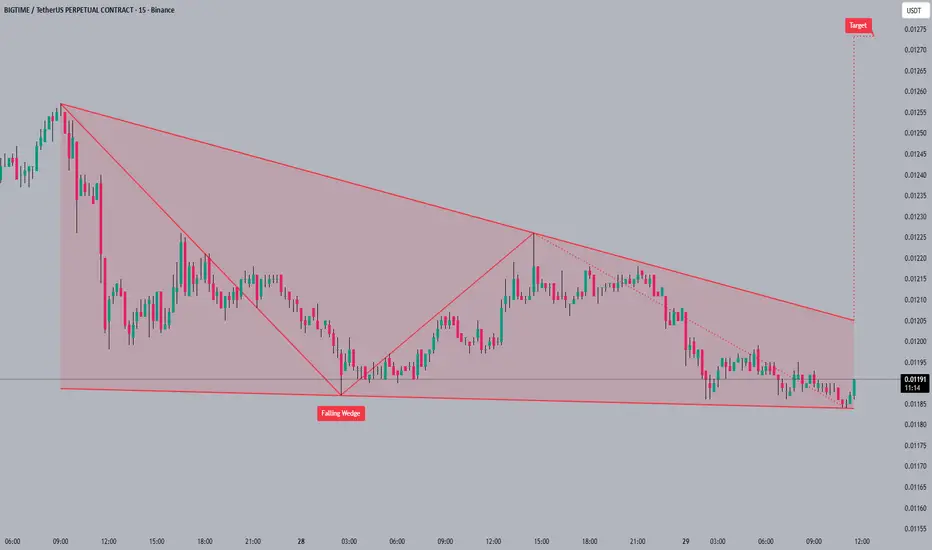
#BIGTIME#BIGTIME is currently trading at the bottom of a falling wedge pattern 📉. The falling wedge is a bullish pattern 🐂 that typically indicates a potential breakout to the upside. The next target for #BIGTIME after breaking out of the wedge is around 0.01275 🚀.
It's important to be patient and wait for confirmation before entering a trade 👍.
#BIGTIME #crypto #trading #altcoins
BIGTIME is on the verge of a price explosion (4H)The price has broken an important trendline, formed a bullish CH, and swept the liquidity pool at the bottom of the chart.
On the pullback to the two entry points we’ve marked, the position can be entered using DCA.
The targets are shown on the chart.
targets: 0.01406$ _ 0.01455$ _ 0.01501
A daily candle closing below the invalidation level will invalidate this analysis.
If you would like us to analyze a coin or altcoin for you, first like this post, then comment the name of your altcoin belo
BIGTIME Buy/Long Signal (4H)Considering that a large portion of the previous long shadow has been filled on the chart (the extended lower line marks the bottom of the previous long shadow), the chart is expected to move toward equilibrium, and we may see recovery moves.
Additionally, the strong bearish candle has been engulfed, and we have a bullish CH on the chart.
On a pullback to the support zones, we can look to enter buy/long positions.
The targets have been marked on the chart.
In any case, this is a light and vo
BIGTIMEUSDT — Descending Triangle Nearing Breakout or Breakdown?Full Analysis
The BIGTIME/USDT chart on the 4D timeframe (OKX) shows a prolonged downtrend with consistent lower highs, capped by a strong descending trendline (yellow). At the same time, price has been holding within a major support zone between 0.038 – 0.055 USDT (yellow box).
This structure forms a Descending Triangle — a classic pattern that often signals bearish continuation, but in some cases, it can also mark the final stage before a strong bullish reversal. Price is now approaching the
#BIGTIME #BIGTIMEUSD #BIGTIMEUSDT #Analysis #Eddy#BIGTIME #BIGTIMEUSD #BIGTIMEUSDT #Analysis #Eddy
A reversal structure has formed on the weekly and daily time frames, and the necessary confirmations have been given on the weekly time frame. Considering the structure formed on the above time frame, as well as the behavior of this currency in the past chart, it is expected that this currency will perform a good pump.
I have identified the important supply and demand zones of the higher timeframe for you.
This analysis is based on a combinat
BIGTIME – Dual Breakout Unfolding Across Timeframes $BIGTIME is stepping into the spotlight with back-to-back breakout signals across multiple charts 🚀.
On the 12-hour timeframe, price is breaking out of a round bottom formation—a classic accumulation pattern shifting into momentum mode 🔄. This kind of structure often precedes strong moves if follow-through volume kicks in.
Meanwhile, the 4-hour chart adds more fuel to the setup with an ascending channel breakout 📈. If the current breakout levels hold on retest, this could trigger the next leg
BIGTIME current chart and possible indicators (daily)MEXC:BIGTIMEUSDT is not the easiest chart to analyze - due to it's short story and thus lack of information. BIGTIME had a huge ralley to 1 dollar back in December 2023 and was, since then, in an downtrend.
That downtrend found its bottom in August 2024 at around 5 cent and consolidated out of the downtrend (bottomed out) at that time. Since then (or at least since september) we can see a steady climb with higher highs and higher lows towards the VAH (value area high) of the whole market at
BIGTIME/USDT Ready to Explode! End of a Long Downtrend? Breakout🧠 Chart Pattern & Technical Structure:
✅ Main Pattern: Descending Triangle Breakout Setup
A Descending Triangle has formed from the 2023 high to mid-2025, indicating consolidation after a strong downtrend.
Strong horizontal support between $0.05266 – $0.06550 has been tested multiple times, showing strong accumulation in this zone.
The downtrend resistance line is being squeezed, suggesting a potential breakout is imminent if price closes strongly above it.
📈 Bullish Scenario:
If the price
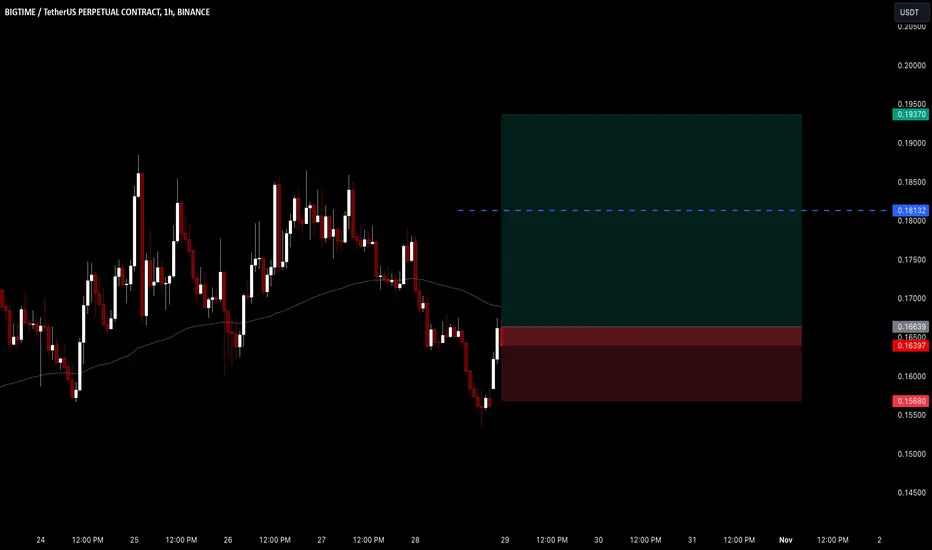
$BIGTIME LONG TRADE
**🎯 Entry:** 0.1625 – Entering at a strategic level for potential upside.
**📈 Targets:** 0.1694, 0.181, 0.1937 – Key levels to watch for profit-taking.
**🛑 Stop Loss:** 0.1568 – Manage risk by sticking to this stop to limit downside.
💡 *Always manage your risk and adjust your position size accordingly to protect capital.*
BIGTIME/USDT Analysis (1H Timeframe)Price has successfully broken the descending trendline, signaling a trend reversal from bearish to bullish. The market is now testing a key supply zone around $0.07450 – $0.07550.
Trend Shift: A bullish breakout from the downtrend line indicates buyers are gaining control.
Support: Previous resistance near $0.07370 may now act as strong support on any pullback.
Resistance: Price is currently at resistance; if broken, next key zones are around $0.07650 and $0.07850.
Bias: Bullish, as long as
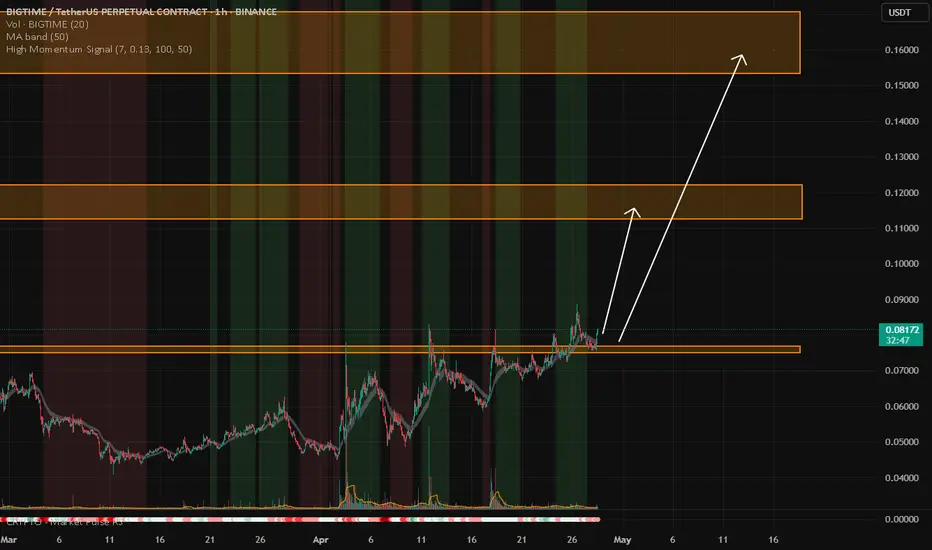
BIGTIME/USDTKey Level Zone: 0.07500 - 0.07690
HMT v8.1 detected. The setup looks promising, supported by a previous upward/downward trend with increasing volume and momentum, presenting an excellent reward-to-risk opportunity.
HMT (High Momentum Trending):
HMT is based on trend, momentum, volume, and market structure across multiple timeframes. It highlights setups with strong potential for upward movement and higher rewards.
Whenever I spot a signal for my own trading, I’ll share it. Please note that co
$BIGTIME LONG TRADE
**🎯 Entry:** 0.1625 – Entering at a strategic level for potential upside.
**📈 Targets:** 0.1694, 0.181, 0.1937 – Key levels to watch for profit-taking.
**🛑 Stop Loss:** 0.1568 – Manage risk by sticking to this stop to limit downside.
💡 *Always manage your risk and adjust your position size accordingly to protect capital.*