XDC | 26' Q2 May | Day ChartDigital Ledger Technology
XDC | XINFIN
engages in the design, development and service of critical digital, decentralized infrastructure technology.
Master, Protector & observer Nodes require 10,000,000 xdc to set up and mine blocks / receive rewards
2,000+ TPS
Created in: Japan
----------------
Compare with XDC/USD
Key stats
Crypto info
Open interest
Open interest
Price
Liquidations
Long
Short
Price
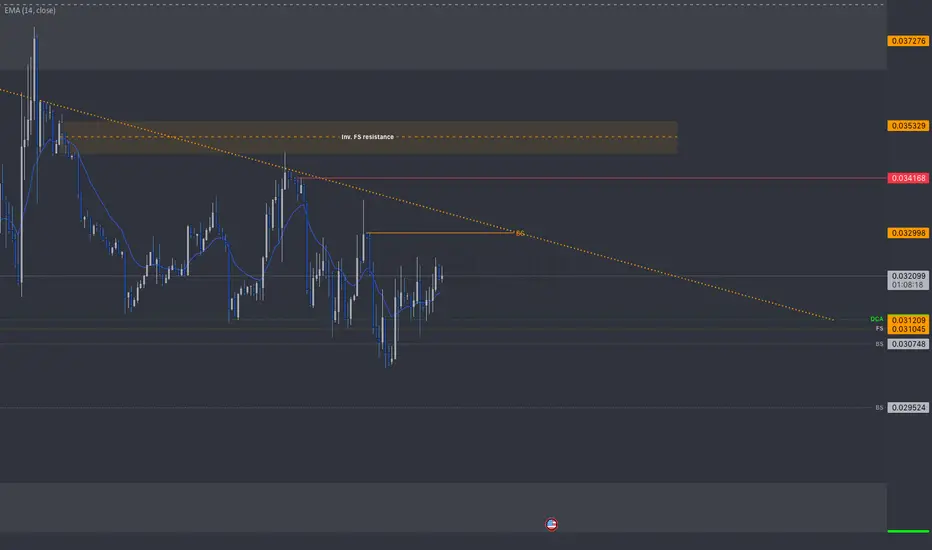
XDC | Week 20 | 1hr Chart** T.A explained **
Multiple Time-Frame Analysis; Color Code | Strength favors the higher timeframe.
Yearly timeframe = black
Monthly timeframe = pink
weekly = grey
daily = red
4hr = orange
1hr = yellow
15min = blue
5min = green if they are shown. (Level visibility on intervals is set to timeframe
XDC | 4hr Chart
** T.A explained **
Multiple Time-Frame Analysis; Color Code | Strength favors the higher timeframe.
Yearly timeframe = black
Monthly timeframe = pink
weekly = grey
daily = red
4hr = orange
1hr = yellow
15min = blue
5min = green if they are shown. (Level visibility on intervals is set to timeframe
XDC | updated 4hr chartupdated chart. tested levels changed from dashed to single point dotted lines.
New levels added @ $0.026 which are the final levels support the low angle accumulation trend.
If price is a good entry at 0.026 then what would get price down to that zone?
There is are a few 4hr areas of resistance l
XDC | week 8 | 1hr chartI left last last weeks grey box and adapted the distribution trend to the 4hr swingHigh
added some 4hr levels and 2 1hr levels
Monthly timeframe is color pink
weekly grey
daily is red
4hr is orange
1hr is yellow
15min is blue
5min is green if they are shown.
strength favors the higher timeframe.
XDC / USD — Bullish Trend Pullback Within ExpansionThis chart shows XDC maintaining a broader bullish structure while undergoing a short-term pullback following a multi-day advance. After a strong upside sequence marked by higher highs and higher lows, price has rotated lower toward reclaimed daily structure.
Despite the recent red candle, price re
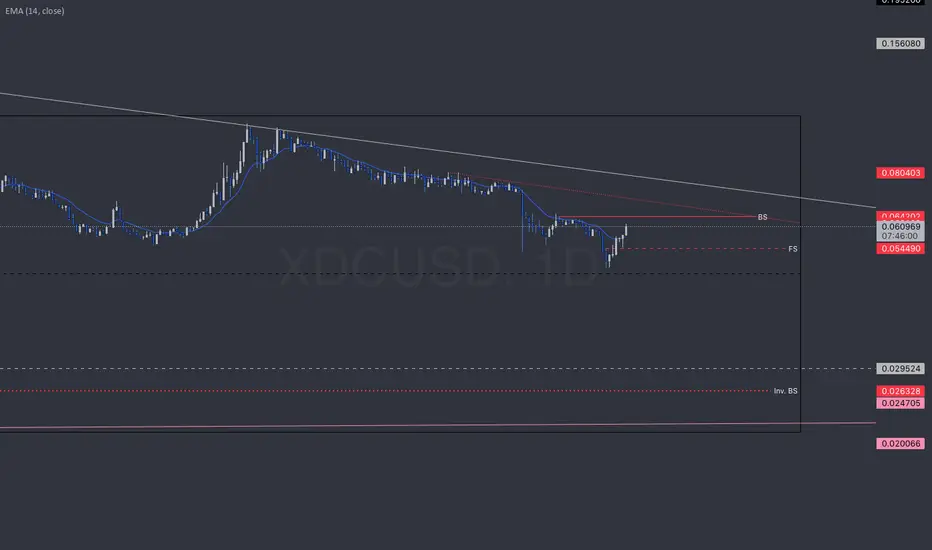
XDC - Daily chartNothing to see here
just a chart about XDC
maybe you know about R3, Corda Settler, XRPL, the lawsuit with ripple once upon a time or maybe you just asked Grok to find connections for fundamental research.
nothing to see here. though. just a chart illustrating a story that might never happen.
Wyckoff Accumulation + Cup & Handle | XDCUSD DailyClassic accumulation structure in play after months of channeling, with textbook Wyckoff signals: SC (Selling Climax), AR (Automatic Rally), and successful creek breakout. The current move shows a powerful expansion candle off a rounded “cup” base, with early FOMO buyers piling in.
DO NOT CHASE.
Bes
See all ideas
Summarizing what the indicators are suggesting.
Oscillators
Neutral
Oscillators
Neutral
Summary
Neutral
Summary
Neutral
Summary
Neutral
Moving Averages
Neutral
Moving Averages
Neutral
Displays a symbol's price movements over previous years to identify recurring trends.
Frequently asked questions
The current price of XDC Network (XDC) is 0.030580 USD.
For broader market analysis, dive into the technicals on the XDC price chart and read the latest XDC Network news:
– XDC Network: SBI and Shinhan Card sign payment MOU - 21 Oct 2026
– XDC Network selects Concordium as identity verification layer for AI agents
– XDC Network Pushes Blockchain-Based Cross-Border Trade Efficiency Drive
For broader market analysis, dive into the technicals on the XDC price chart and read the latest XDC Network news:
– XDC Network: SBI and Shinhan Card sign payment MOU - 21 Oct 2026
– XDC Network selects Concordium as identity verification layer for AI agents
– XDC Network Pushes Blockchain-Based Cross-Border Trade Efficiency Drive
Markets don't sleep, here's what's going on with XDC Network at the moment:
– XDC Network: SBI and Shinhan Card sign payment MOU - 21 Oct 2026
– XDC Network selects Concordium as identity verification layer for AI agents
– XDC Network Pushes Blockchain-Based Cross-Border Trade Efficiency Drive
See more updates in real-time with our News Flow.
– XDC Network: SBI and Shinhan Card sign payment MOU - 21 Oct 2026
– XDC Network selects Concordium as identity verification layer for AI agents
– XDC Network Pushes Blockchain-Based Cross-Border Trade Efficiency Drive
See more updates in real-time with our News Flow.
The current circulating supply of XDC Network (XDC) is 38.11 B, representing all coins available for trading.
Circulating supply differs from total supply (the number of coins that currently exist, including those not actively traded) and max supply (the maximum number of coins that will ever exist), and is used to calculate market capitalization.
To get a wider picture of the market, check out coins with the highest circulating supply. Also, check the list of coins with the lowest number of tokens in circulation.
Circulating supply differs from total supply (the number of coins that currently exist, including those not actively traded) and max supply (the maximum number of coins that will ever exist), and is used to calculate market capitalization.
To get a wider picture of the market, check out coins with the highest circulating supply. Also, check the list of coins with the lowest number of tokens in circulation.
It's worth checking XDC price change for various periods to get the full picture:
– 1 day — −2.51%
– 1 week — −10.40%
– 1 month — −6.97%
XDC Network's all-time low was 0.000157 USD (Jun 20, 2019), and its highest price is 0.195200 USD (Aug 21, 2021). Find more dynamics in the Crypto Heatmap and on the XDC price chart.
– 1 day — −2.51%
– 1 week — −10.40%
– 1 month — −6.97%
XDC Network's all-time low was 0.000157 USD (Jun 20, 2019), and its highest price is 0.195200 USD (Aug 21, 2021). Find more dynamics in the Crypto Heatmap and on the XDC price chart.
XDC Network is a volatile asset, and investing in it carries both potential risks and rewards. It may not be suitable for every investor. Before investing, consider the following:
– Volatility: Cryptocurrency prices can change rapidly. Conduct technical analysis, review fundamental and market information before making a decision.
– Security: Use reputable exchanges and secure wallets to help protect your assets. Explore reliable brokers and research any service provider before using it.
– Trading strategy: Different approaches carry different levels of risk. Learn how spot and derivatives markets work, follow crypto news, explore the Crypto Screener, and review community trading ideas.
– Diversification: Spreading investments across multiple assets may help reduce concentration risk.
– Long-term perspective: Some investors choose to hold cryptocurrencies for the long term to weather short-term price fluctuations.
– Volatility: Cryptocurrency prices can change rapidly. Conduct technical analysis, review fundamental and market information before making a decision.
– Security: Use reputable exchanges and secure wallets to help protect your assets. Explore reliable brokers and research any service provider before using it.
– Trading strategy: Different approaches carry different levels of risk. Learn how spot and derivatives markets work, follow crypto news, explore the Crypto Screener, and review community trading ideas.
– Diversification: Spreading investments across multiple assets may help reduce concentration risk.
– Long-term perspective: Some investors choose to hold cryptocurrencies for the long term to weather short-term price fluctuations.
Sentiment around XDC Network means the overall market mood — whether traders are feeling bullish, bearish, or neutral.
Here's what you can explore to better understand XDC sentiment:
– Volume, 26.81 M USD: Higher volume often signals strong interest and conviction behind price moves
– Social sentiment: Community discussions and tone can reflect retail trader expectations
– News Flow: Positive or negative headlines can quickly shift market sentiment
No single metric defines sentiment — it's a combination of stats. See more of them in our Crypto Coins Screener.
Here's what you can explore to better understand XDC sentiment:
– Volume, 26.81 M USD: Higher volume often signals strong interest and conviction behind price moves
– Social sentiment: Community discussions and tone can reflect retail trader expectations
– News Flow: Positive or negative headlines can quickly shift market sentiment
No single metric defines sentiment — it's a combination of stats. See more of them in our Crypto Coins Screener.
XDC Network (XDC) reached its highest price of 0.195200 USD on Aug 21, 2021.
View more XDC Network dynamics on the XDC price chart and scan other coins to find out what crypto hits its all-time high.
The current market capitalization of XDC Network is 657.04 M USD.
Here are a few numbers to better understand XDC dynamics:
– XDC current price — 0.030580 USD
– XDC circulating supply — 38.11 B
– XDC daily trading volume — 26.81 M USD
Check out our crypto market cap charts and large-cap crypto coins to make more informed decision on crypto market.
Here are a few numbers to better understand XDC dynamics:
– XDC current price — 0.030580 USD
– XDC circulating supply — 38.11 B
– XDC daily trading volume — 26.81 M USD
Check out our crypto market cap charts and large-cap crypto coins to make more informed decision on crypto market.
XDC Network (XDC) trading volume over the past 24 hours is 26.81 M USD. This reflects the total amount traded across major exchanges.
Higher trading volume typically indicates stronger market activity and can confirm price trends, while lower volume may suggest weaker momentum. Comparing current volume to recent averages can help assess whether market interest is increasing or declining.
Stay on top of the market by exploring the most traded cryptocurrencies and following the latest crypto news.
Higher trading volume typically indicates stronger market activity and can confirm price trends, while lower volume may suggest weaker momentum. Comparing current volume to recent averages can help assess whether market interest is increasing or declining.
Stay on top of the market by exploring the most traded cryptocurrencies and following the latest crypto news.
Buying XDC Network depends on your goals, risk tolerance, and understanding of the market. Crypto markets are famous for their volatility, that's why we always recommend you studying all the available stats before adding crypto assets to your portfolio. One of them is technical ratings — a score that suggests buying or selling an asset.
XDC Network's ratings are:
– Today: sell
– 1-week: sell
– 1-month: sell
Worth considering before buying
– Investment horizon
– Risk tolerance
– Overall portfolio fit
Potential market scenarios
– Price growth during strong demand
– Declines during corrections or negative news
– Short-term volatility
Find inspiration in XDC Network trading ideas and keep track of what's moving crypto markets with our crypto news feed.
XDC Network's ratings are:
– Today: sell
– 1-week: sell
– 1-month: sell
Worth considering before buying
– Investment horizon
– Risk tolerance
– Overall portfolio fit
Potential market scenarios
– Price growth during strong demand
– Declines during corrections or negative news
– Short-term volatility
Find inspiration in XDC Network trading ideas and keep track of what's moving crypto markets with our crypto news feed.
Sentiment around XDC Network varies and changes with market conditions, news, and price trends.
How to gauge trader sentiment:
– Trading ideas: See how traders analyze XDC, including bullish and bearish setups
– Minds: Follow real-time opinions, reactions, and discussions
– Crypto Coins Screener: Set up the Sentiment filter to see traders' attitudes across the market
What to look for:
– Common trends in sentiment (bullish vs bearish)
– Key price levels and scenarios traders are watching
– Reactions to news or market events
How to gauge trader sentiment:
– Trading ideas: See how traders analyze XDC, including bullish and bearish setups
– Minds: Follow real-time opinions, reactions, and discussions
– Crypto Coins Screener: Set up the Sentiment filter to see traders' attitudes across the market
What to look for:
– Common trends in sentiment (bullish vs bearish)
– Key price levels and scenarios traders are watching
– Reactions to news or market events
The safest way to buy XDC Network is through a well-known and reliable crypto exchange. Create an account, fund it, and place a buy order.
You can trade XDC Network directly from TradingView:
– Choose an exchange: Explore our supported trading partners and pick one that fits your needs
– Compare options: View available exchanges side by side to evaluate fees and features
– Connect your account: Open Supercharts, click "Trade", select your exchange, and log in
– Start trading: Place orders directly from the chart
Tip: If you're new to trading, try paper trading first — it lets you practice strategies in real market conditions without risking funds.
You can trade XDC Network directly from TradingView:
– Choose an exchange: Explore our supported trading partners and pick one that fits your needs
– Compare options: View available exchanges side by side to evaluate fees and features
– Connect your account: Open Supercharts, click "Trade", select your exchange, and log in
– Start trading: Place orders directly from the chart
Tip: If you're new to trading, try paper trading first — it lets you practice strategies in real market conditions without risking funds.