USDC Treasury Mints $250 Million in New TokensThe USDC Treasury has minted $250 million in new tokens, a move highlighted by the CryptoTwitter commentator @whale_alert. This significant minting event reflects growing demand for stablecoins amid shifting market dynamics. As stablecoins play a central role in liquidity provision, this could enhan
Peers for comparison
Key stats
Crypto info
USD Coin (USDC) is a stablecoin pegged to USD on a 1:1 basis, meaning each coin can be redeemed for $1. Fully backed by highly liquid cash and cash-equivalent assets, USDC basically operates as a digital dollar. Launched in September 2018, USDC was designed to offer a reliable, stable asset in times of volatility, which cryptomarkets are known for. It operates as an ERC-20 token, and as of 2024, the coin is managed by Circle, a peer-to-peer payment services company.
Open interest
Open interest
Price
Liquidations
Long
Short
Price
Circle Stablecoin holding the $1 peg — small intraday LONG setupCurrent Price: 1.00
Direction: LONG
Confidence level: 40%(Limited trader commentary and no explicit price levels from professional traders. Slightly bullish bias comes from positive social positioning and typical stablecoin liquidity drift above the peg.)
Targets
Target 1: 1.002
Target 2: 1.004
USDC Holding the Peg: Small Upside Trade Toward $1.002 This WeeCurrent Price: 0.99993 (Analysis was generated on Monday Morning)
Direction: LONG
Confidence level: 45%(Mostly social sentiment data showing bullish bias toward peg stability with limited multi-source confirmation; stablecoin structure limits volatility)
Targets
Target 1: 1.0010
Target 2: 1.0020
USDC Holding Support Near $1 — Short‑Term Long Toward Peg PremiCurrent Price: 0.99972 (Analysis was generated on Monday Morning)
Direction: LONG
Confidence level: 58%(Price is close to widely discussed support near 0.9995 while X sentiment is overwhelmingly bullish and traders expect mean reversion toward the $1 peg.)
Targets
Target 1: 1.00030
Target 2: 1.00
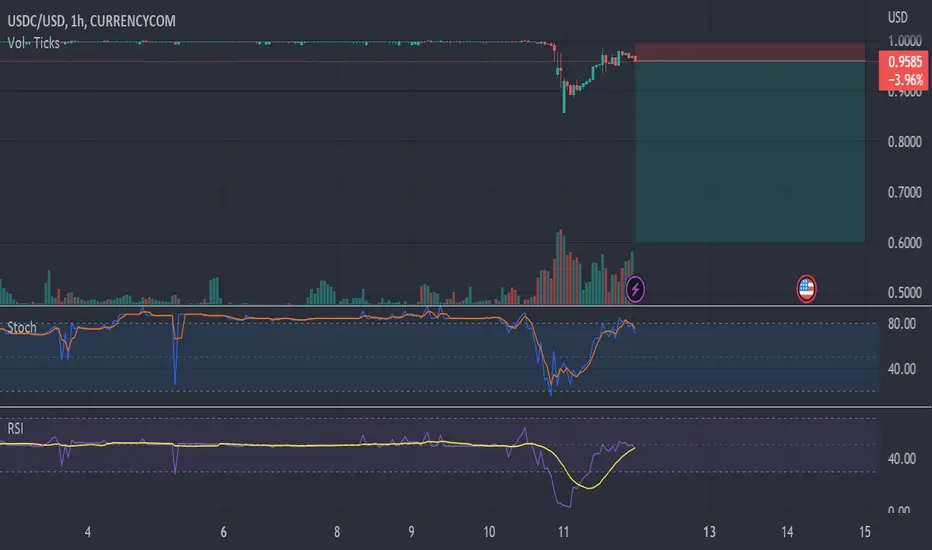
USDC De-peg could Crash DAI, USDD, & FraxI want to share my thoughts on the current situation with stablecoins, specifically USDC, DAI, and FRAX. It is my belief that if USDC were to collapse, DAI and FRAX would follow suit, causing a significant crash in the entire crypto market.
Recent developments support this concern. Binance has paus
See all ideas
Summarizing what the indicators are suggesting.
Oscillators
Neutral
Oscillators
Neutral
Summary
Neutral
Summary
Neutral
Summary
Neutral
Moving Averages
Neutral
Moving Averages
Neutral
Displays a symbol's price movements over previous years to identify recurring trends.
Frequently asked questions
The current price of USDC (USDC) is 0.99997 USD.
For broader market analysis, dive into the technicals on the USDC price chart and read the latest USDC news:
– Circle CEO Backs Binance Despite $6.3 Billion Hack: ‘Remains an Extraordinarily Powerful Platform’ With 'Incredibly Strong' Reach
– Kaia's KIP Expands Yield8 RWA Investments Into EV Finance, Adds ONiON Mobility Loan
– Stripe Expands Stablecoin Payouts for US Businesses to More Than 160 Markets
For broader market analysis, dive into the technicals on the USDC price chart and read the latest USDC news:
– Circle CEO Backs Binance Despite $6.3 Billion Hack: ‘Remains an Extraordinarily Powerful Platform’ With 'Incredibly Strong' Reach
– Kaia's KIP Expands Yield8 RWA Investments Into EV Finance, Adds ONiON Mobility Loan
– Stripe Expands Stablecoin Payouts for US Businesses to More Than 160 Markets
Markets don't sleep, here's what's going on with USDC at the moment:
– Circle CEO Backs Binance Despite $6.3 Billion Hack: ‘Remains an Extraordinarily Powerful Platform’ With 'Incredibly Strong' Reach
– Kaia's KIP Expands Yield8 RWA Investments Into EV Finance, Adds ONiON Mobility Loan
– Stripe Expands Stablecoin Payouts for US Businesses to More Than 160 Markets
See more updates in real-time with our News Flow.
– Circle CEO Backs Binance Despite $6.3 Billion Hack: ‘Remains an Extraordinarily Powerful Platform’ With 'Incredibly Strong' Reach
– Kaia's KIP Expands Yield8 RWA Investments Into EV Finance, Adds ONiON Mobility Loan
– Stripe Expands Stablecoin Payouts for US Businesses to More Than 160 Markets
See more updates in real-time with our News Flow.
The current circulating supply of USDC (USDC) is 70.79 B, representing all coins available for trading.
Circulating supply differs from total supply (the number of coins that currently exist, including those not actively traded) and max supply (the maximum number of coins that will ever exist), and is used to calculate market capitalization.
To get a wider picture of the market, check out coins with the highest circulating supply. Also, check the list of coins with the lowest number of tokens in circulation.
Circulating supply differs from total supply (the number of coins that currently exist, including those not actively traded) and max supply (the maximum number of coins that will ever exist), and is used to calculate market capitalization.
To get a wider picture of the market, check out coins with the highest circulating supply. Also, check the list of coins with the lowest number of tokens in circulation.
It's worth checking USDC price change for various periods to get the full picture:
– 1 day — +0.02%
– 1 week — +0.02%
– 1 month — −0.01%
USDC's all-time low was 0.87512 USD (Jan 1, 2023), and its highest price is 1.08646 USD (Nov 6, 2022). Find more dynamics in the Crypto Heatmap and on the USDC price chart.
– 1 day — +0.02%
– 1 week — +0.02%
– 1 month — −0.01%
USDC's all-time low was 0.87512 USD (Jan 1, 2023), and its highest price is 1.08646 USD (Nov 6, 2022). Find more dynamics in the Crypto Heatmap and on the USDC price chart.
USDC is a volatile asset, and investing in it carries both potential risks and rewards. It may not be suitable for every investor. Before investing, consider the following:
– Volatility: Cryptocurrency prices can change rapidly. Conduct technical analysis, review fundamental and market information before making a decision.
– Security: Use reputable exchanges and secure wallets to help protect your assets. Explore reliable brokers and research any service provider before using it.
– Trading strategy: Different approaches carry different levels of risk. Learn how spot and derivatives markets work, follow crypto news, explore the Crypto Screener, and review community trading ideas.
– Diversification: Spreading investments across multiple assets may help reduce concentration risk.
– Long-term perspective: Some investors choose to hold cryptocurrencies for the long term to weather short-term price fluctuations.
– Volatility: Cryptocurrency prices can change rapidly. Conduct technical analysis, review fundamental and market information before making a decision.
– Security: Use reputable exchanges and secure wallets to help protect your assets. Explore reliable brokers and research any service provider before using it.
– Trading strategy: Different approaches carry different levels of risk. Learn how spot and derivatives markets work, follow crypto news, explore the Crypto Screener, and review community trading ideas.
– Diversification: Spreading investments across multiple assets may help reduce concentration risk.
– Long-term perspective: Some investors choose to hold cryptocurrencies for the long term to weather short-term price fluctuations.
USDC dominance is 2.80% — it's the percentage of the total cryptocurrency market capitalization that USDC accounts for. You can look at it in detail on the dominance chart.
How to interpret it:
– Rising dominance: USDC is outperforming other cryptocurrencies or attracting more capital
– Falling dominance: USDC is weakening, other coins are gaining market share
Why it matters:
– Indicates overall market trends (e.g. Bitcoin-led vs altcoin-led markets)
– Helps assess where capital is flowing within crypto
– Often used to gauge risk appetite among investors
How to interpret it:
– Rising dominance: USDC is outperforming other cryptocurrencies or attracting more capital
– Falling dominance: USDC is weakening, other coins are gaining market share
Why it matters:
– Indicates overall market trends (e.g. Bitcoin-led vs altcoin-led markets)
– Helps assess where capital is flowing within crypto
– Often used to gauge risk appetite among investors
USDC transaction number is 10.26 M transactions over time, showing how many transfers were processed on the network.
What does it mean?
– High number: Indicates increased network activity and usage
– Low number: May signal reduced activity or fewer transfers
Remember: transaction count shows activity, but not the value being moved. For a more complete picture, consider:
– Transaction volume (USDC): 115.98 B USDC
– Transaction volume (USD): $115.91 B
– Average transaction value: $6.26 K
– Active addresses: 198.04 K
Explore more USDC data in our Crypto Coins Screener.
What does it mean?
– High number: Indicates increased network activity and usage
– Low number: May signal reduced activity or fewer transfers
Remember: transaction count shows activity, but not the value being moved. For a more complete picture, consider:
– Transaction volume (USDC): 115.98 B USDC
– Transaction volume (USD): $115.91 B
– Average transaction value: $6.26 K
– Active addresses: 198.04 K
Explore more USDC data in our Crypto Coins Screener.
Sentiment around USDC means the overall market mood — whether traders are feeling bullish, bearish, or neutral.
Here's what you can explore to better understand USDC sentiment:
– Volume, 14.32 B USD: Higher volume often signals strong interest and conviction behind price moves
– Transaction volume, $115.91 B: Shows how much value is being transferred across the network
– Active addresses, 198.04 K: Rising activity can indicate growing usage and engagement
– Social sentiment: Community discussions and tone can reflect retail trader expectations
– News Flow: Positive or negative headlines can quickly shift market sentiment
No single metric defines sentiment — it's a combination of stats. See more of them in our Crypto Coins Screener.
Here's what you can explore to better understand USDC sentiment:
– Volume, 14.32 B USD: Higher volume often signals strong interest and conviction behind price moves
– Transaction volume, $115.91 B: Shows how much value is being transferred across the network
– Active addresses, 198.04 K: Rising activity can indicate growing usage and engagement
– Social sentiment: Community discussions and tone can reflect retail trader expectations
– News Flow: Positive or negative headlines can quickly shift market sentiment
No single metric defines sentiment — it's a combination of stats. See more of them in our Crypto Coins Screener.
USDC (USDC) reached its highest price of 1.08646 USD on Nov 6, 2022.
View more USDC dynamics on the USDC price chart and scan other coins to find out what crypto hits its all-time high.
The current market capitalization of USDC is 70.87 B USD.
Here are a few numbers to better understand USDC dynamics:
– USDC current price — 0.99997 USD
– USDC circulating supply — 70.79 B
– USDC daily trading volume — 14.32 B USD
Check out our crypto market cap charts and large-cap crypto coins to make more informed decision on crypto market.
Here are a few numbers to better understand USDC dynamics:
– USDC current price — 0.99997 USD
– USDC circulating supply — 70.79 B
– USDC daily trading volume — 14.32 B USD
Check out our crypto market cap charts and large-cap crypto coins to make more informed decision on crypto market.
USDC (USDC) trading volume over the past 24 hours is 14.32 B USD. This reflects the total amount traded across major exchanges.
Higher trading volume typically indicates stronger market activity and can confirm price trends, while lower volume may suggest weaker momentum. Comparing current volume to recent averages can help assess whether market interest is increasing or declining.
Stay on top of the market by exploring the most traded cryptocurrencies and following the latest crypto news.
Higher trading volume typically indicates stronger market activity and can confirm price trends, while lower volume may suggest weaker momentum. Comparing current volume to recent averages can help assess whether market interest is increasing or declining.
Stay on top of the market by exploring the most traded cryptocurrencies and following the latest crypto news.
Buying USDC depends on your goals, risk tolerance, and understanding of the market. Crypto markets are famous for their volatility, that's why we always recommend you studying all the available stats before adding crypto assets to your portfolio. One of them is technical ratings — a score that suggests buying or selling an asset.
USDC's ratings are:
– Today: strong buy
– 1-week: buy
– 1-month: buy
Worth considering before buying
– Investment horizon
– Risk tolerance
– Overall portfolio fit
Potential market scenarios
– Price growth during strong demand
– Declines during corrections or negative news
– Short-term volatility
Find inspiration in USDC trading ideas and keep track of what's moving crypto markets with our crypto news feed.
USDC's ratings are:
– Today: strong buy
– 1-week: buy
– 1-month: buy
Worth considering before buying
– Investment horizon
– Risk tolerance
– Overall portfolio fit
Potential market scenarios
– Price growth during strong demand
– Declines during corrections or negative news
– Short-term volatility
Find inspiration in USDC trading ideas and keep track of what's moving crypto markets with our crypto news feed.
USDC activity can be viewed through several address metrics:
– Active addresses: 198.04 K (sent or received USDC in a given period)
– Addresses with balance: 29.79 M (currently holding USDC)
– Newly funded addresses: 41.06 K (recently received USDC for the first time)
Note that one user can control multiple addresses, so this does not equal the number of users.
Active addresses are often used as an indicator of network activity — higher numbers can suggest increased usage, while lower activity may indicate reduced demand.
For active trading, you may want to explore coins with the most daily active addresses and most transactions.
– Active addresses: 198.04 K (sent or received USDC in a given period)
– Addresses with balance: 29.79 M (currently holding USDC)
– Newly funded addresses: 41.06 K (recently received USDC for the first time)
Note that one user can control multiple addresses, so this does not equal the number of users.
Active addresses are often used as an indicator of network activity — higher numbers can suggest increased usage, while lower activity may indicate reduced demand.
For active trading, you may want to explore coins with the most daily active addresses and most transactions.
Sentiment around USDC varies and changes with market conditions, news, and price trends.
How to gauge trader sentiment:
– Trading ideas: See how traders analyze USDC, including bullish and bearish setups
– Minds: Follow real-time opinions, reactions, and discussions
– Crypto Coins Screener: Set up the Sentiment filter to see traders' attitudes across the market
What to look for:
– Common trends in sentiment (bullish vs bearish)
– Key price levels and scenarios traders are watching
– Reactions to news or market events
How to gauge trader sentiment:
– Trading ideas: See how traders analyze USDC, including bullish and bearish setups
– Minds: Follow real-time opinions, reactions, and discussions
– Crypto Coins Screener: Set up the Sentiment filter to see traders' attitudes across the market
What to look for:
– Common trends in sentiment (bullish vs bearish)
– Key price levels and scenarios traders are watching
– Reactions to news or market events
USDC transaction volume is 115.98 B, with a total value of $115.91 B.
What does it mean?
– High volume: Indicates stronger network usage and market activity
– Low volume: May signal reduced demand or quieter conditions
Remember: transaction volume doesn't reflect the number of users or transactions. For a comprehensive analysis you'll need more numbers:
– Number of transactions for USDC: 10.26 M
– Average transaction in USD: $6.26 K
– Active USDC addresses: 198.04 K
Explore more USDC stats in our Crypto Coins Screener.
What does it mean?
– High volume: Indicates stronger network usage and market activity
– Low volume: May signal reduced demand or quieter conditions
Remember: transaction volume doesn't reflect the number of users or transactions. For a comprehensive analysis you'll need more numbers:
– Number of transactions for USDC: 10.26 M
– Average transaction in USD: $6.26 K
– Active USDC addresses: 198.04 K
Explore more USDC stats in our Crypto Coins Screener.
USDC average transaction value is $6.26 K, showing the typical size of a single transfer on the network.
What does it mean?
– High average: May indicate larger transfers or institutional activity
– Low average: Often reflects smaller, more frequent transactions
Remember: average transaction value shows size, but not overall activity. For a fuller picture, consider:
– Transaction volume (USDC): 115.98 B USDC
– Transaction volume (USD): $115.91 B
– Number of transactions: 10.26 M
– Active addresses: 198.04 K
Explore more in our Crypto Coins Screener.
What does it mean?
– High average: May indicate larger transfers or institutional activity
– Low average: Often reflects smaller, more frequent transactions
Remember: average transaction value shows size, but not overall activity. For a fuller picture, consider:
– Transaction volume (USDC): 115.98 B USDC
– Transaction volume (USD): $115.91 B
– Number of transactions: 10.26 M
– Active addresses: 198.04 K
Explore more in our Crypto Coins Screener.
The safest way to buy USDC is through a well-known and reliable crypto exchange. Create an account, fund it, and place a buy order.
You can trade USDC directly from TradingView:
– Choose an exchange: Explore our supported trading partners and pick one that fits your needs
– Compare options: View available exchanges side by side to evaluate fees and features
– Connect your account: Open Supercharts, click "Trade", select your exchange, and log in
– Start trading: Place orders directly from the chart
Tip: If you're new to trading, try paper trading first — it lets you practice strategies in real market conditions without risking funds.
You can trade USDC directly from TradingView:
– Choose an exchange: Explore our supported trading partners and pick one that fits your needs
– Compare options: View available exchanges side by side to evaluate fees and features
– Connect your account: Open Supercharts, click "Trade", select your exchange, and log in
– Start trading: Place orders directly from the chart
Tip: If you're new to trading, try paper trading first — it lets you practice strategies in real market conditions without risking funds.