CX | Continued stock growth- Timeframe: Weekly
- Trade type: Buy stop order
- Price: 12.55
- Take Profit: Open
- Stop Loss: 11.84 (-5.60 %)
Idea: Long on a breakout above last week's high - bullish momentum continuation.
Entry: Buy stop above last week’s high.
Stop-loss: Below the low of the same candle.
If the weekly candle closes below this level, the trade is invalidated.
Take Profit: Trailing stop following the lows of new weekly candles.
In-depth trading ideas
Concrete Momentum: Strength in CemexCemex SAB de CV ADR (CX) has been in a nice steady uptrend over the last year, and we are currently observing a bit of a small pullback / consolidation phase following these consistent gains. After pulling back to test its intermediate support levels, the stock is showing signs of stabilizing, making this an interesting chart to watch for potential trend continuation.
Fundamentally, the company appears to be capitalizing on improved operational efficiency and regional strength. With a reported 19% jump in EBITDA and expanding margins in its recent Q3 results, CX is demonstrating solid financial health. The stock has outperformed many benchmarks, driven partly by the resilience of Mexican financial assets and a strategic shift towards sustainable building solutions. Investors are watching closely to see if this "value-meet-momentum" dynamic can sustain higher valuations compared to industry peers.
Technically, the long-term trend remains bullish, with the price action holding firmly above the 50-day , 100-day , and 200-day SMAs . The 50-day SMA at 10.68 has acted as a dynamic floor during the recent dip. The RSI at 58.11 has reset from overbought levels, offering room for upside if buyers step in. While the MACD shows a flattening histogram typical of consolidation, the lower volume on the pullback suggests that selling pressure is drying up.
CX might be one to keep an eye on.
--------------------------------------
About Me: Global TradingView Moderator (English) and full-time trader. I focus on top-performing stocks worldwide, trading momentum and clean trend continuations after pullbacks. I use a trailing stop system customised for each stock to manage risk, lock in gains, and exit when the trend ends. Nothing I post is trading advice. I simply highlight interesting companies from around the world that may be worth a closer look. Please give this idea a BOOST if you found it interesting, and FOLLOW ME to discover more standout stocks and businesses from global markets.
--------------------------------------
CX | Long | Triangle Breakout & Value Entry | (May 2025)CX | Long | Watching for Triangle Breakout & Value Entry | (May 2025)
1️⃣ Short Insight Summary:
CX has been stuck in a long-term consolidation pattern since 2008, but now it’s approaching a key decision point. We’re seeing signs of potential breakout movement, especially as price compresses within a triangle formation.
2️⃣ Trade Parameters:
Bias: Long
Entry: Watching for retracement into $5.95–$5.75 zone (near value area high)
Stop Loss: $5.33
TP1: $6.70
TP2: $7.91
Final TP: $9.00
3️⃣ Key Notes:
✅ Daily and 4H charts show upward momentum, but 1H and 2H charts suggest short-term selling pressure (money flowing out).
✅ Weekly timeframe shows money inflow—bullish signal.
❌ Monthly chart shows money flowing out, signaling caution for long-term holders.
📉 Fundamentals show mixed signals: strong free cash flow ($1.6B), low P/E (6.3), and solid market position—but future EPS forecasts are trending lower, which could weigh on sentiment.
🏗️ CX operates globally in construction materials (cement, concrete, aggregates) with exposure across U.S., Mexico, Europe, and Asia.
4️⃣ Optional Follow-up Note:
This setup is worth watching closely. If the triangle breaks upward with volume, I’ll update the post and potentially scale into the trade further.
Please LIKE 👍, FOLLOW ✅, SHARE 🙌 and COMMENT ✍ if you enjoy this idea! Also share your ideas and charts in the comments section below! This is best way to keep it relevant, support us, keep the content here free and allow the idea to reach as many people as possible.
Disclaimer: This is not a financial advise. Always conduct your own research. This content may include enhancements made using AI.
CEMEX/CPO - Buying OpportunityCEMEX/CPO - Buying Opportunity.
TF analysis: 4H.
According to technical analysis, we can observe that we are in an uptrend channel, in which the price is gaining greater inclination by making higher lows. The projection of the possible upward movement is located up to the upper end of the channel.
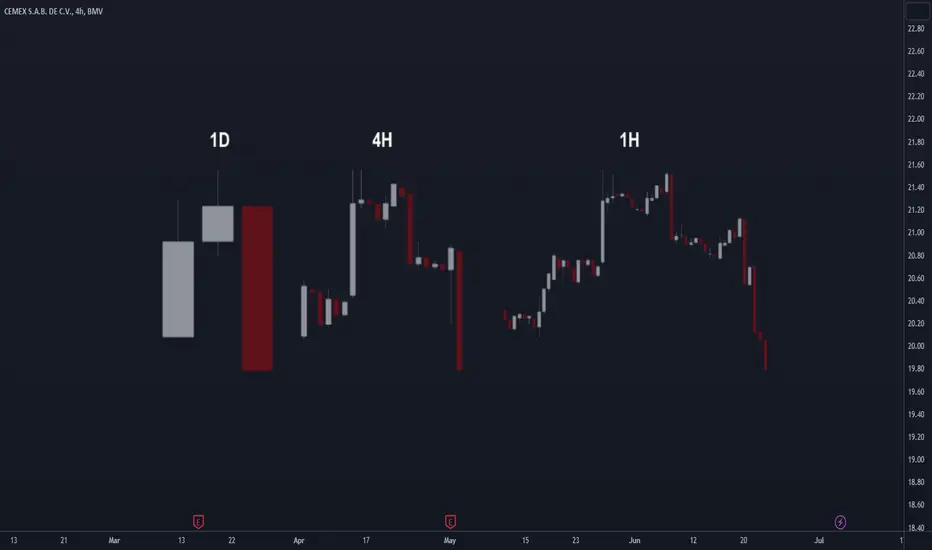
The importance of using different TimeframesWhen visualizing the market and conducting technical analysis, it is crucial to interpret different timeframes.
Multi-timeframe analysis can enhance the probability of success in our trading by utilizing support and resistance levels from higher timeframes than our base timeframe.
It is also useful for identifying candlestick patterns in other timeframes and assessing their alignment with other signals observed in our analysis.