This is one of the biggest opportunities in the stock market Under Armou r has corrected sharply in recent years and is currently trading at very low prices—which presents an excellent opportunity for long-term investors.
In the following I will walk you through the Elliott Wave structure and explain why we think this stock is such a good opportunity
Hig
Under Armour, Inc. Class A
No trades
No trades
−20.28 MXN
−8.89 B MXN
89.50 B MXN
188.22 M
Next report date
—
Report period
—
EPS estimate
—
Revenue estimate
—
Company info
Sector
Industry
CEO
Kevin A. Plank
Website
Headquarters
Baltimore
Founded
1996
IPO date
Nov 18, 2005
ISIN
US9043111072
CUSIP
904311107
FIGI
BBG000W6NKY3
Identifiers
ISIN US9043111072
Under Armour, Inc. engages in the development, marketing, and distribution of branded performance apparel, footwear, and accessories for men, women, and youth. It operates through the following geographical segments: North America, EMEA, Asia-Pacific, Latin America, and Other. The company was founded by Kevin A. Plank in 1996 and is headquartered in Baltimore, MD.
Under Armour Uptrend Remains IntactPrimary Scenario
Currently, we see UAA in a corrective rally that is likely to end well below resistance at $8.15 and then shift into a downward move. We expect the low of this correction to occur within our blue Long-Term Entry Range ($4.68–$1.97). After that, the stock is likely to transition int
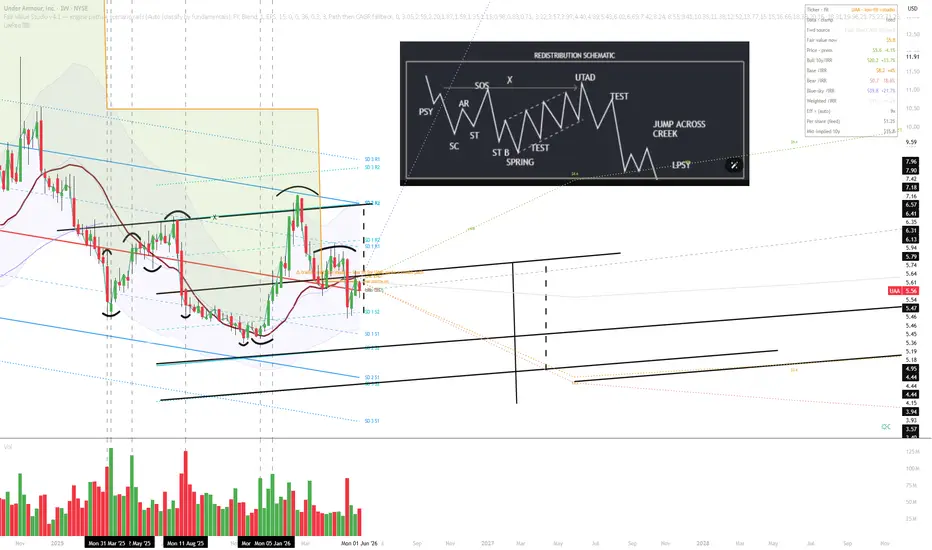
$UAA UndeR(e)distribution Schematic shoulda stuck to their guns in specialized sporting apparels instead of trying to do a bunch of things like the competition to gain market share.
shrinking assets, shrinking margins, negative free cash flow, looming weakness in economy (albeit they are more of a "low cost" apparel brand (re:shrink
Under Armour: weak results and pressure on marginsUnder Armour: weak results and pressure on margins amid ongoing restructuring
Ion Jauregui – Analyst at ActivTrades
Under Armour once again disappointed the market after reporting quarterly results below forecasts and warning of a further deterioration in margins, in a context marked by weak co
A Sanyaku Kouten that MoonedI had a young fellow from Belgium contact me here recently. He's keen on learning Ichimoku, and I used this chart of UAA to illustrate an absolutely textbook Sanyaku Kouten (Three-Condition Turn for the Better). I thought I'd share it with a broader audience.
Ichimoku isn't simply an indicator-
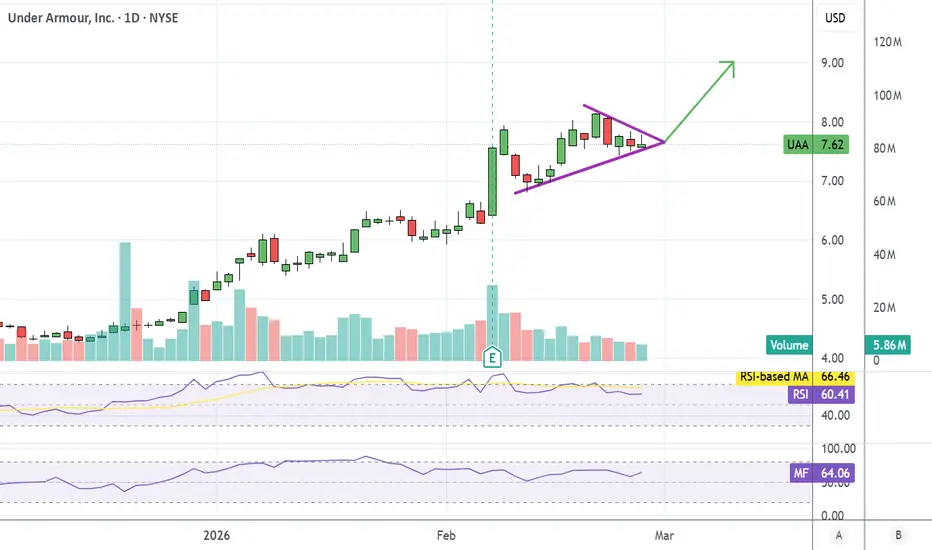
UAA UpdateMade some money on this one the runup to earnings then again on the runup to tariff decision, looks to me like it's consolidating and getting ready for another run.
Chart shows a pennant pattern which can break either way, if it goes up tomorrow and holds the gain, I'll probably buy some March 8 ca
Under Armour | UA | Long at $6.74Under Armour $NYSE:UA. Price may break my historical simple moving average area/lines and dip into the low $6s, but the convergence of price with these lines often means a future price increase. Fundamentally, the stock continues to surprise with earnings beat after earnings beat. While economic hea
See all ideas
Summarizing what the indicators are suggesting.
Neutral
Neutral
Neutral
An aggregate view of professional's ratings.
Neutral
Neutral
Neutral
Displays a symbol's price movements over previous years to identify recurring trends.
Maturity dateJul 15, 2030
Coupon7.25% (Fixed)
See all UAA bonds
Frequently asked questions
The current price of UAA is 83.25 MXN — it hasn't changed in the past 24 hours. Watch Under Armour, Inc. Class A stock price performance more closely on the chart.
Depending on the exchange, the stock ticker may vary. For instance, on BMV exchange Under Armour, Inc. Class A stocks are traded under the ticker UAA.
We've gathered analysts' opinions on Under Armour, Inc. Class A future price: according to them, UAA price has a max estimate of 152.96 MXN and a min estimate of 67.98 MXN. Watch UAA chart and read a more detailed Under Armour, Inc. Class A stock forecast: see what analysts think of Under Armour, Inc. Class A and suggest that you do with its stocks.
UAA stock is 2.41% volatile and has beta coefficient of 1.53. Track Under Armour, Inc. Class A stock price on the chart and check out the list of the most volatile stocks — is Under Armour, Inc. Class A there?
Today Under Armour, Inc. Class A has the market capitalization of 35.30 B, it has decreased by −2.09% over the last week.
Yes, you can track Under Armour, Inc. Class A financials in yearly and quarterly reports right on TradingView.
Under Armour, Inc. Class A is going to release the next earnings report on Nov 5, 2026. Keep track of upcoming events with our Earnings Calendar.
UAA earnings for the last quarter are 0.88 MXN per share, whereas the estimation was 0.30 MXN resulting in a 191.97% surprise. The estimated earnings for the next quarter are −0.08 MXN per share. See more details about Under Armour, Inc. Class A earnings.
Under Armour, Inc. Class A revenue for the last quarter amounts to 19.22 B MXN, despite the estimated figure of 19.41 B MXN. In the next quarter, revenue is expected to reach 21.17 B MXN.
UAA net income for the last quarter is 9.54 M MXN, while the quarter before that showed −778.14 M MXN of net income which accounts for 0.00% change. Track more Under Armour, Inc. Class A financial stats to get the full picture.
No, UAA doesn't pay any dividends to its shareholders. But don't worry, we've prepared a list of high-dividend stocks for you.
As of Sep 22, 2026, the company has 14.1 K employees. See our rating of the largest employees — is Under Armour, Inc. Class A on this list?
EBITDA measures a company's operating performance, its growth signifies an improvement in the efficiency of a company. Under Armour, Inc. Class A EBITDA is 2.44 B MXN, and current EBITDA margin is 4.71%. See more stats in Under Armour, Inc. Class A financial statements.
Like other stocks, UAA shares are traded on stock exchanges, e.g. Nasdaq, Nyse, Euronext, and the easiest way to buy them is through an online stock broker. To do this, you need to open an account and follow a broker's procedures, then start trading. You can trade Under Armour, Inc. Class A stock right from TradingView charts — choose your broker and connect to your account.
Investing in stocks requires a comprehensive research: you should carefully study all the available data, e.g. company's financials, related news, and its technical analysis. So Under Armour, Inc. Class A technincal analysis shows the strong sell today, and its 1 week rating is sell. Since market conditions are prone to changes, it's worth looking a bit further into the future — according to the 1 month rating Under Armour, Inc. Class A stock shows the sell signal. See more of Under Armour, Inc. Class A technicals for a more comprehensive analysis.