This is one of the biggest opportunities in the stock market Under Armou r has corrected sharply in recent years and is currently trading at very low prices—which presents an excellent opportunity for long-term investors.
In the following I will walk you through the Elliott Wave structure and explain why we think this stock is such a good opportunity
Higher Timeframe:
Here we can see the initial impulse and the subsequent correction, which we now consider to be potentially complete. We completed the first wave I in September 2015, and the subsequent correction lasted over a decade—unfolding as a complex wxyz correction, the structure of which we can examine more closely on lower time frames.
Based on the assumption of the first “one-two,” we can also determine an initial target zone on a multi-year timeframe. This would range between $87.45 and $139.11, representing a minimum percentage target of 1240%.
Lower Timeframe:
Here, we can now take a closer look at the composition of wxyz. The last wave z formed within another wxyz pattern (red count), with the last z itself forming within an ABC pattern (light blue).
We now consider this correction pattern to be complete and are seeing the first signs of an emerging impulse (green count). We have likely already seen waves 1 and 2 and are therefore in wave 3, which already offers good profit potential on short-term time frames.
What are your thoughts about this stock?
Under Armour, Inc. Class A
No trades
No trades
In-depth trading ideas
Under Armour Uptrend Remains IntactPrimary Scenario
Currently, we see UAA in a corrective rally that is likely to end well below resistance at $8.15 and then shift into a downward move. We expect the low of this correction to occur within our blue Long-Term Entry Range ($4.68–$1.97). After that, the stock is likely to transition into an upward trend and eventually break through the previously mentioned resistance.
Alternative Scenario
ADJUSTMENTS: Alternatively, there is a chance the stock continues its rise immediately and breaks through resistance at $8.15 without reaching another low in our blue Long-Term Entry Range ($4.68–$1.97) (probability: 38%).
Long-Term Outlook
The daily chart continues to highlight the stock’s long-term upside potential: Our overarching target remains the red zone ($85.92–$94.81), where we expect the ongoing impulse wave to complete. However, resistance at $27.28 is a key level to watch. If this resistance isn’t broken, the correction—already considered complete in the primary scenario—could still be in progress, and new lows could be targeted again (probability: 38%).
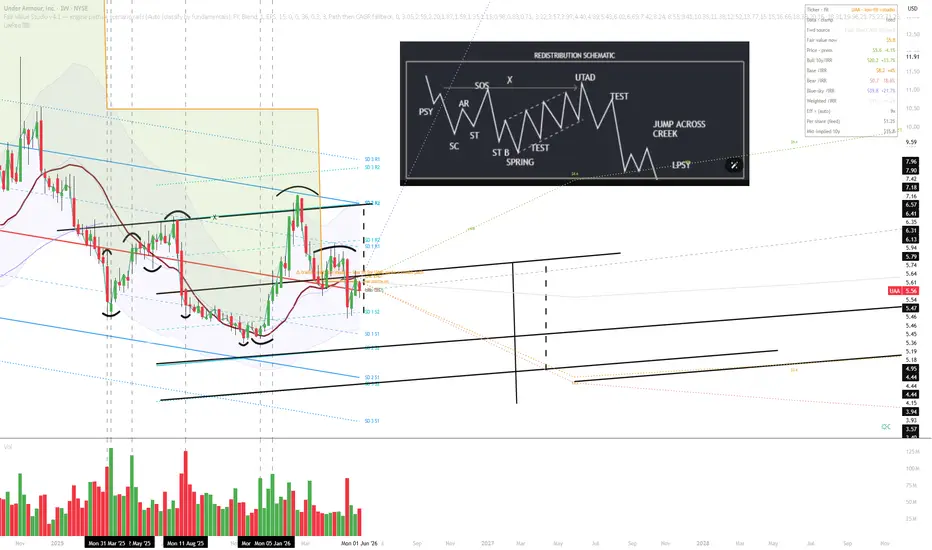
$UAA UndeR(e)distribution Schematic shoulda stuck to their guns in specialized sporting apparels instead of trying to do a bunch of things like the competition to gain market share.
shrinking assets, shrinking margins, negative free cash flow, looming weakness in economy (albeit they are more of a "low cost" apparel brand (re:shrinking margins)
also, like have you seen their shoes? and their logo? hello, get a rebrand.
9 of the last 20 years have been cash flow negative.
you can find better investments.
Under Armour: weak results and pressure on marginsUnder Armour: weak results and pressure on margins amid ongoing restructuring
Ion Jauregui – Analyst at ActivTrades
Under Armour once again disappointed the market after reporting quarterly results below forecasts and warning of a further deterioration in margins, in a context marked by weak consumer demand in the United States and the impact of tariffs on its supply chain.
The U.S. company recorded revenue of $1.134 billion in the first fiscal quarter of 2026, representing a year-on-year decline of 4.2%. Adjusted earnings per share stood at 2 cents, below the 3 cents expected by the analyst consensus.
The deterioration of the business was mainly concentrated in the footwear segment, which fell 14%, and in the e-commerce channel, with a contraction of 12%, reflecting the loss of momentum of the brand in two of its key growth areas within the sports sector.
Tariffs and margin pressure
Under Armour also warned that new tariffs could add approximately $100 million in additional costs during the second quarter, implying a deterioration in gross margin of between 340 and 360 basis points.
The group, once again led by Kevin Plank, remains immersed in a restructuring process aimed at repositioning the brand and reducing its dependence on aggressive promotions. However, the company continues to operate in a complex environment, driven by weak discretionary consumption, rising logistics costs, and increasingly intense competition from Nike and Adidas, as well as new players in the “premium running” segment.
Under Armour’s high exposure to suppliers in Asia, particularly Vietnam and Indonesia, further increases its sensitivity to trade tensions, at a time when the textile sector is once again facing tariff pressures.
Technical analysis Under Armour (Ticker: UAA)
From a technical perspective, Under Armour maintains a clearly bearish structure. The stock reached highs of around $11.89 in November 2024, before entering a corrective phase that led it to trade below $8 during 2025, with a key bottom around $4.13 in November of the same year.
After a subsequent rebound towards February highs at $8.15, the stock has resumed downward pressure. It is currently trading below the 50-, 100-, and 200-day moving averages, with a bearish gap associated with the results released on May 12, reinforcing the sequence of lower highs and lower lows and confirming weak buying momentum.
The key support level is located at $4.13, as previously mentioned. A sustained break below this level could intensify selling pressure. On the upside, the first relevant resistance is around $5, while the next control zone is between $6.20 and $6.50, a level that could mark a potential short-term structural shift.
The RSI has moved into an oversold condition, around 31.31%, with signs of a possible reversal. The MACD has shown an average around the mid-zone of a histogram in a clearly bearish trend. Meanwhile, the ActivTrades US Market Pulse indicator signals a neutral risk zone throughout most of May.
US: signs of slowdown
Investors will continue to monitor margin trends and the company’s ability to stabilize sales in the coming quarters, in an environment where discretionary consumption in the United States continues to show signs of slowdown.
*******************************************************************************************
The information provided does not constitute investment research. The material has not been prepared in accordance with the legal requirements designed to promote the independence of investment research and such should be considered a marketing communication.
All information has been prepared by ActivTrades ("AT"). The information does not contain a record of AT's prices, or an offer of or solicitation for a transaction in any financial instrument. No representation or warranty is given as to the accuracy or completeness of this information.
Any material provided does not have regard to the specific investment objective and financial situation of any person who may receive it. Past performance and forecasting are not a synonym of a reliable indicator of future performance. AT provides an execution-only service. Consequently, any person acting on the information provided does so at their own risk. Political risk is unpredictable. Central bank actions can vary. Platform tools do not guarantee success.
A Sanyaku Kouten that MoonedI had a young fellow from Belgium contact me here recently. He's keen on learning Ichimoku, and I used this chart of UAA to illustrate an absolutely textbook Sanyaku Kouten (Three-Condition Turn for the Better). I thought I'd share it with a broader audience.
Ichimoku isn't simply an indicator--it's a holistic trading system. Learn all the nuts and bolts of time and wave theory, kairi, geometry, etc., and you've got something. Ichimoku dovetails perfectly with Western modalities like trend line analysis.
I change the default colors on something like LuxAlgo's Ichimoku Theories as follows: Chikou Span yellow, Tenkan-sen red, and Kijun-sen blue. Let's look at this chart to see what went right.
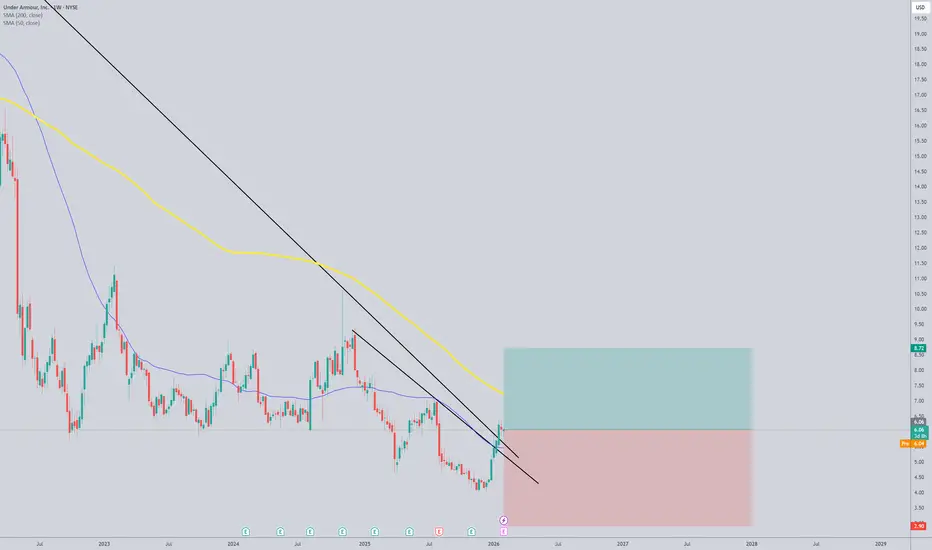
In August of last year, UAA missed earnings. To say the market reacted badly is an understatement. It gapped down, and Mr. Market gave it the boots for months afterwards. This, however, created a wonderful down-sloping trend line. Price broke above this trend line and confirmed above in late December.
Uncle Itchy here didn't pull the trigger until the Sanyaku Kouten was confirmed at the end of the year. It was an absolutely perfect setup: a Chikou Span breakout in which it was immediately disentangled from past price 26 bars to its left to satisfy the Open Space Rule, then the Tenkan-sen crossed above the Kijun-sen for a golden cross, then the Kumo breakout.
After this, it was simply a matter of watching price ride Tenkan-sen up. Some very conservative traders would have gotten out shortly after the huge impulse candle on 6 Feb. A lot would have gotten out as price dropped through Tenkan-sen. Most everybody would have been out at the Kijun-sen cross.
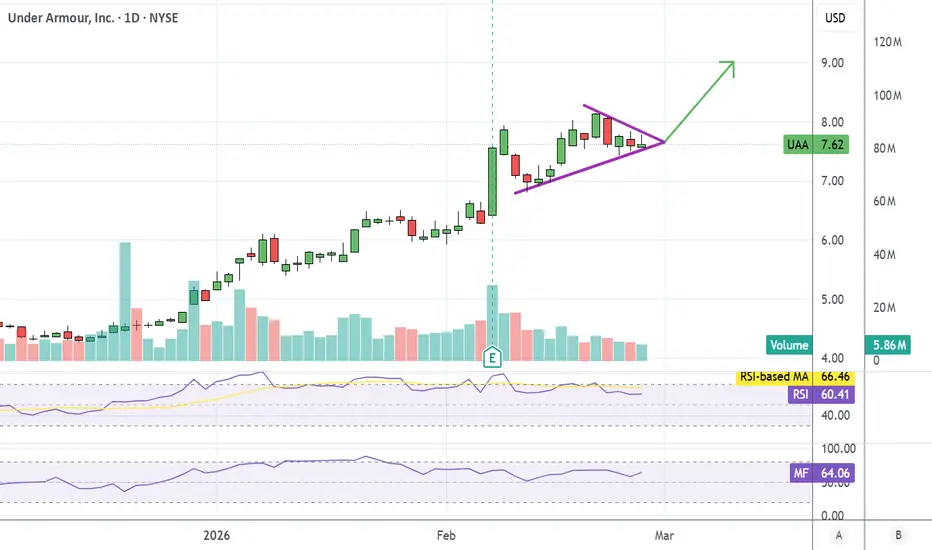
UAA UpdateMade some money on this one the runup to earnings then again on the runup to tariff decision, looks to me like it's consolidating and getting ready for another run.
Chart shows a pennant pattern which can break either way, if it goes up tomorrow and holds the gain, I'll probably buy some March 8 calls. Looked a little too bearish to buy today.
We'll see what happens the next couple of days.
Under Armour | UA | Long at $6.74Under Armour $NYSE:UA. Price may break my historical simple moving average area/lines and dip into the low $6s, but the convergence of price with these lines often means a future price increase. Fundamentally, the stock continues to surprise with earnings beat after earnings beat. While economic headwinds are likely ahead in the retail market, global exposure may ease the likely troubles. Starter position entered at $6.74.
Targets
$7.50
$8.00
UAA - Will Under Armour Survive?Sell Thesis for Under Armour (UAA) – A Compilation of Concerns
The consensus view, supported by the financial metrics and recent performance, suggests Under Armour is a "Sell" or "Avoid." The risks appear to outweigh the potential rewards at the current valuation.
1. Stagnant Growth & Market Share Erosion
The Core Problem: The "weak constant currency growth over the past two years" is the most critical red flag. In the competitive athleisure market, where Nike, Lululemon, and Adidas are fighting for wallet share, a lack of growth implies Under Armour is losing relevance. Consumers are not connecting with the brand's performance-focused identity as strongly as they do with competitors' blend of performance, lifestyle, and fashion.
Broader Context: This isn't just a post-pandemic hangover; it reflects deeper issues in brand positioning, product innovation, and marketing effectiveness.
2. Deteriorating Profitability and Poor Capital Allocation
A Vicious Cycle: The "diminishing returns on capital from an already low starting point" is a severe indictment of management's strategy. It indicates that investments (in marketing, new product lines, retail stores, or technology) are not generating adequate profits. This erodes shareholder value and limits funds available for future, more productive investments.
Questionable Strategy: This metric suggests past bets (e.g., heavy investment in connected fitness with the MapMyFitness acquisition era, or a push into broader lifestyle categories) have not paid off, and the current turnaround plan under new CEO Kevin Plank (who returned in 2024) has yet to demonstrate traction.
3. A Dangerous Debt Load
Financial Vulnerability: A "high net-debt-to-EBITDA ratio of 7×" is alarming for a retailer. It severely limits strategic and financial flexibility. In a high-interest-rate environment, servicing this debt is costly. If sales weaken further or margins contract, the company could face a liquidity crisis.
Potential Outcomes: As noted, this could force distressed asset sales (potentially selling valuable intellectual property or divisions at a discount) or highly dilutive equity financing (issuing new shares at low prices, hurting existing shareholders), both of which would be negative catalysts for the stock.
4. Unsustainable Valuation
Trading on Hope, Not Results: A forward P/E of 51.3x is extraordinarily high for a company with no growth and significant financial risk. For comparison, mature, profitable companies with steady growth typically trade in the 15x-25x range. This multiple implies investors are pricing in a dramatic and immediate turnaround that, given the points above, seems highly uncertain.
Downside Risk: The consensus price target of $6.19 (-2.2% implied return) suggests analysts see minimal upside and significant potential for a valuation contraction if growth and profits fail to materialize. The stock could easily re-rate to a lower multiple, leading to a steep decline.
The Counterargument (The "Hold" or "Speculative Buy" Case)
A contrarian view would hinge on:
CEO Kevin Plank's Return: The founder's return could refocus the brand on its performance roots and improve execution.
Cost-Cutting Initiatives: Ongoing restructuring could boost margins in the medium term.
Deep Value Play: If the turnaround succeeds, the stock could rebound sharply from a multi-year low.
However, the preponderance of evidence—stagnant growth, poor profitability, high debt, and a sky-high valuation—makes the bear case far more compelling. The current stock price appears to discount a successful turnaround that is not yet visible in the company's financials.
In summary, Under Armour presents a high-risk profile with multiple fundamental headwinds and an unjustifiably rich valuation. The prudent action, based on this analysis, is to avoid or sell the stock until concrete evidence of a sustainable operational and financial turnaround emerges.
$UA under armour looks bullishUnder Armour has bullish setup here. RSI looks very strong too buyer showing interest. Price making bullish move on strong volume gapped up and broke the trendline resistance. There was inverse H&S breakout too neckline was broken with a gapped up candle. There is still upside gap that has to be filled. Apparel sector as a whole is showing strength lately. Bullish overall for me.
UAA in BUY ZONEMy trading plan is very simple.
I buy or sell when at either of these events happen:
* Price tags the top or bottom of parallel channel zones
* Money flow volume spikes beyond it's Bollinger Bands
So...
Here's why I'm picking this symbol to do the thing.
Price in buying zone at bottom of channel
Money flow momentum is spiked negative and under at bottom of Bollinger Band
Entry at $4.53
Target is upper lower channel around $4.75
Buying 11/21 $5 Call @ $0.20
$UA NYSE:UA (Under Armour) is Poised for a Reversal!
Classic technical analysis pattern spotted: a "Falling Wedge" forming within the current downtrend. This setup is a high-probability signal for a major Bullish Reversal!
A strong bounce off support (Point 5) and a crucial breakout above the upper trendline (resistance) of the wedge is anticipated. This could mark the start of a new uptrend.
Under Armor is full of cash in the basementUnder Armour (UAA) is a buy, trading at a dirt-cheap $4.80 after a 90% drop, but it's poised for a comeback with a rock-solid balance sheet and massive upside potential. Analysts see it hitting over $1 EPS long-term, fueled by Kevin Plank’s turnaround plan to streamline products, boost premium branding, and dominate with athletes like Steph Curry. With $911M in cash (42% of its $2.15B market cap) and a low-low price-to-gross-profit ratio under 1, you’re getting a premium brand for pennies. Here’s the bull case:
Insane Value: Price-to-sales at 0.43 and enterprise value of $2.92B – way below peers.
Cash Powerhouse: Nearly $1B in cash to fund growth, buybacks, or dividends without stress.
EPS Rocket: Analysts project 300% earnings growth by 2027, with $1+ EPS in sight.
Brand Reboot: Plank’s cutting SKUs by 25%, pushing premium gear, and ramping marketing in 2025.
Global Edge: International markets growing, ready to steal share from Nike and Adidas.
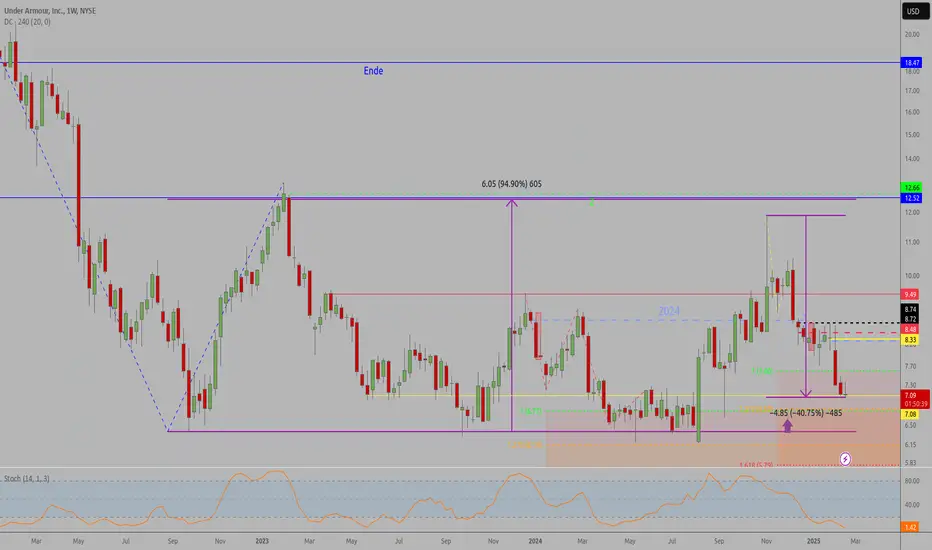
"Multiresisupport"The current levelhas been serving as support and resistance multiple times beginning May 2023.
As we had our peak in November and lost over 40 % since then we may now build a bottom here and start recovering.
However it is not excluded yet that we may test the quadrupel bottom which we have tested since September 2022 again. In this case we may be stopped out and have to re-enter a bit later at this lower level again.