Head and shoulder pattern on BNB UsdtBnb hit 14xx usd. its really a huge blow of top price action .
with all the other new exchanges and binance strick kyc rules . binanace has less
and less traders everyday.
anyway the head and shoulder pattern is starting to appear.
this is not a trade . its just to watch it and if this plays out.
just an idea
In-depth trading ideas
๏ปฟBinance Coin (BNB): Time to do a Breakdown?The price is currently around $760, with the chart allowing a potential topping scenario at $806.
That level is marked as the potential top of the current structure and would also complete the developing right shoulder.
But the bearish setup doesn't become actionable simply because price reaches $806.
The key level is lower.
The levels that matter
$806.29 โ potential top / right-shoulder area
$569.51 โ bearish confirmation
$451.69 โ first major downside target
$333.57 โ deeper target
If BN
Bye,nance.CZ and crew have had a good run so far. Even prior to its recent legal news, the structure for BNB's chart has pointed to a macro bear quickly approaching. I've mentioned the exact same sentiment months ago.
Recently parked near the lows of $555, we've seen Binance make a quick splurge of a wave; pending destination of near $770. This 44% increase in value currently has BNB's RSI at the same identical level it last sat before 2025's -60% (-$800) drop.
Having printed a macro fractal that leaves
BNB โ $800 First, Then a Bigger Move?๐ก BNB has recovered strongly from the lower demand zone, building a clear bullish structure with consecutive higher highs and higher lows.
Price is now approaching the upper resistance zone around $777โ$790, making this a critical decision point. A confirmed breakout could open the way toward the next major upside areas.
๐ This is our first analysis of BNB.
๐ Bullish scenario
The recent recovery has been impressive, with buyers pushing BNB from the lower zone toward the top of the range.
BNB: Weekly Breakout Above $714.64 Opens the Road Toward $793.46Quick overview
BNB has successfully broken above the $714.64 key-resistance, with the move now confirmed on the Weekly timeframe.
The breakout materially strengthens the bullish market structure and shifts $714.64 from an overhead barrier into the pivotal level supporting the next phase of the advance.
BNB is currently trading around $722.45, already beginning to operate above the former resistance ceiling.
Our official bullish profit target is now $793.46, representing the next significant tech
BNB | The Next Wave?โฑ๏ธ Reading Time: ~3 minutes
The weekly BNB chart, shown on a Linear scale rather than a logarithmic scale, is at a point where the larger structure still does not give us a definitive answer. However, two very different paths can be followed from the structure currently developing.
The key question here is not simply whether BNB will go up or down. The more important question is whether the current move is building a new impulsive wave or is still part of a larger corrective structure.
๐ฆ Scen
Binance (BNB): When Head & Shoulders Meets Elliott WaveMarket Overview
BNB's 1D chart offers an interesting example of how classical chart patterns and Elliott Wave analysis can complement each other.
The potential Head & Shoulders structure is developing within a larger Elliott Wave correction.
Two Methods, One Structure
The Head & Shoulders gives us the visual structure:
Left Shoulder โ Head โ Right Shoulder
BNB's 2025 peak forms the Head, while the current recovery is potentially developing the Right Shoulder around $801.
Elliott Wave p
BNB is above the channel & jsut goldencrossed; $900 seems likelyIf alts are finally having the beginning of a real alt season(which is debateable after so many alt season fakeouts) then the $900 target for the descending channel it is currently closing multiple consecutive daily candles above seems quite probable. It is also the perfect target zone for BNB to then begin forming the right shoulder of an invh&s pattern. If it were to do that and then also breakout of that pattern and head to its full target as well, bnb could revisit its current ath after only
BNB - Next Phase Of Altcoin Pops?BNB
Bitcoin still holding in a fairly tight descent and now BNB is printing a fast pop on the 4H chart.
BNB is breaking up from a tight channel.
This could be the next wave up.
Perhaps we will see some pops from other coins in similar positions - LINK, THETA... ๐คจ
Not advice
BNB bullish signs of growth๐ BULLS ARE WATCHING CLOSELYโฆ ๐
๐บ Triangles are in playโฆ
๐ฉ The flag is flyingโฆ
๐ฏ But will these patterns actually make their targets? ๐
ORโฆ
๐ฐ Will the bulls bank the profits, momentum dries up and the whole thing fizzles out? ๐ซ ๐
๐ Breakout or fakeout?
Letโs see what the market gives usโฆ ๐โ๏ธ๐ป
Binance Coin Wave Analysis โ 31 August 2026
โ Binance Coin reversed from pivotal resistance level 720.00
โ Likely to fall to support level 650.00
Binance Coin today reversed from the combined resistance area set between the pivotal resistance level 720.00 (which stopped the previous intermediate correction (2) at the end of May), 50% Fibonacci correction of the downward impulse from January the upper daily Bollinger Band.
The downward reversal from this resistance zone stopped the previous short-term ABC correction 2 from the start of
BNBAlways use 2xโ3x leverage. We build positions in stages, both long and short.
Max 4% of your account as margin per position. Split that 4% into 3โ6 entries.
Example: $100 account โ max $4 margin per position. Split it as $0.5, then $1, then $1.5. So $0.5 ร 3x = $1.5 position size.
Don't get greedy.
Only add when your ROI is above -100%. Better: wait a few days between add-ons. Sleep on it โ you might end up adding from higher.
Keep half your account in cash as a reserve. Balanced.
In a sho
$BNB $1401ok so first of all congratualtions to all who kept the faith and am assuming have made a nice chunk on this move
zoom out the alts have just kicked off and should be genius season for a while.
big green candles may not retrace immediately so hold the nerve hold on till you start sending pics to friends of your portfolio
BNBAlways use 2xโ3x leverage. We build positions in stages, both long and short.
Max 4% of your account as margin per position. Split that 4% into 3โ6 entries.
Example: $100 account โ max $4 margin per position. Split it as $0.5, then $1, then $1.5. So $0.5 ร 3x = $1.5 position size.
Don't get greedy.
Only add when your ROI is above -100%. Better: wait a few days between add-ons. Sleep on it โ you might end up adding from higher.
Keep half your account in cash as a reserve. Balanced.
In a sho
BNB/USD Buy-the-Dip Setup | Bulls Eye Key Resistance at $630๐ฐ๐ฅ BNB/USD โ "THE VAULT TOKEN vs U.S. DOLLAR" ๐ฅ๐ฐ
Capital Flow Blueprint Plan | Day/Swing Trade | Thief Trader Edition ๐ต๏ธโโ๏ธ๐
โ ๏ธ Correction Note: Original draft mislabeled this pair as "Ethereum vs U.S. Dollar." BNB (Binance Coin) is a distinct asset from ETH โ corrected below. โ
โโโโโโโโโโโโโโโโโโโโโโโโโโโโโโโโโโโโโโ
๐ฏ THE PLAN โ Bullish Blueprint
Setup: Bullish continuation confirmed via smooth moving average pullback structure ๐
Vault Entry Zone: Flexible โ any price level within current st
BNB: Watching the $600 Breakout After Months of AccumulationThe biggest market moves rarely begin from overextended rallies.
They usually begin after long periods of consolidation, when volatility contracts and the market quietly transfers ownership from impatient traders to stronger hands.
That is exactly what has caught my attention on BNB.
After several months of sideways price action, the market is now approaching one of the most important resistance levels on the chart.
For me, the opportunity doesn't come from buying inside the range.
It comes
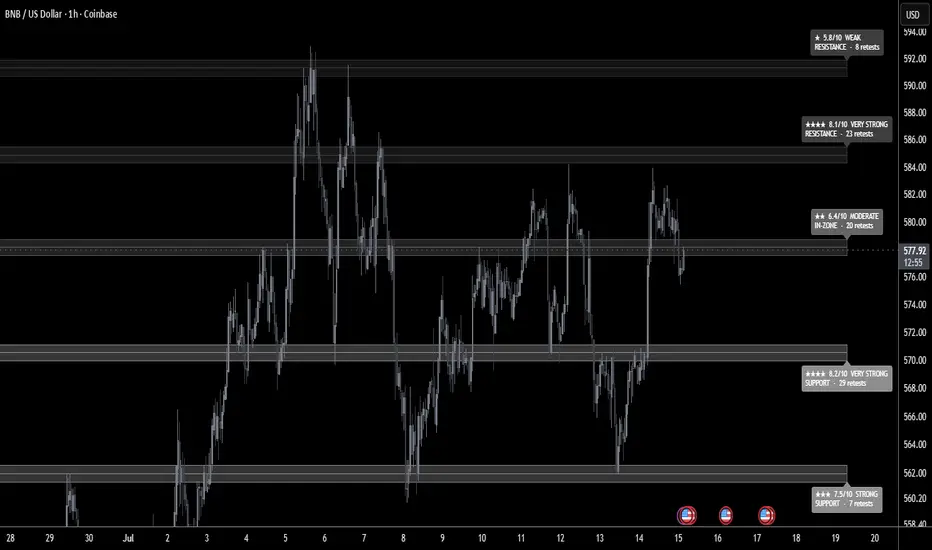
BNB Pinned Between 570 & 585: The Break 591-562โช๏ธ BNBUSD H1 SNAPSHOT โ EXECUTIVE SUMMARY
โช๏ธ BNB is coiling in the middle of its range near 577.75, capped by overhead supply and holding above a defended demand shelf. Structure is consolidating, squeezed between a strong floor and a stacked ceiling.
โช๏ธ Primary outlook is neutral โ the reaction at 570.50 is the key tell. While sellers defend above, rallies stay vulnerable; a reclaim shifts the bias bullish, while losing 570.50 tilts momentum lower.
โช๏ธ Key resistance zone: 585.00, where selle
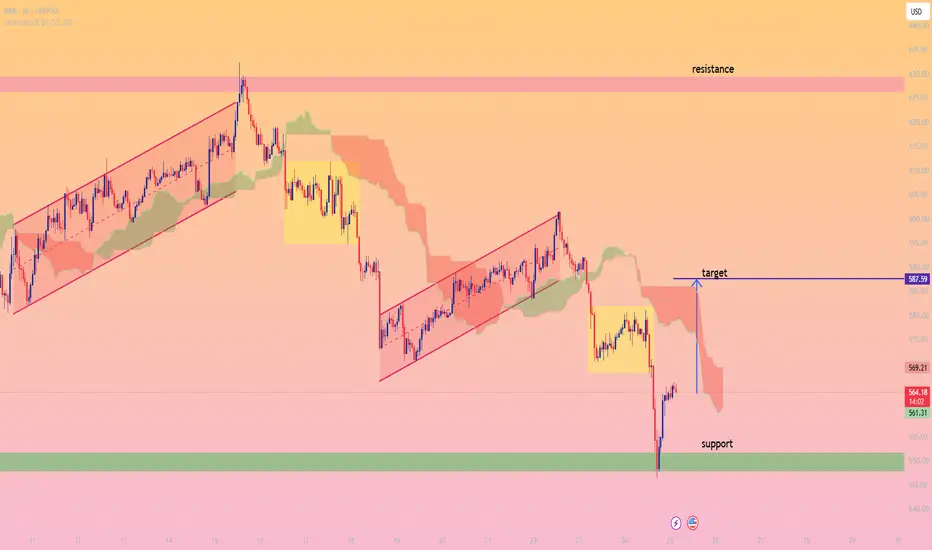
BNB/USD Bullish Rebound from Key SupportBNB/USD has experienced a sharp sell-off after breaking below a consolidation range and falling into a major support zone around **$550**. The strong bullish reaction from this support suggests buyers are defending the area, increasing the probability of a short-term recovery.
Price is currently attempting to reclaim levels above the Ichimoku cloud base after bouncing from support. If bullish momentum continues, BNB could target the nearby resistance zone at **$587.50โ$590.00**, which aligns wi
BNB 1D/1W Analysis!!!Looking Bnb for taking the below pending liquidity.
if given a berish pattern confirmation here on 2hr/4hr then can take a swing downside. it can also test above line before falling so its just an analysis which can give good returns over the time.
Waiting for heavy confirmations before taking any step as its against the trend on lower timeframe.
all updates will be shared on notes.
BNBUSD โ Daily Timeframe Technical AnalysisBNBUSD โ Daily Timeframe Technical Analysis
Price has printed a Lower Low (LL) after breaking the previous swing low, confirming that the broader market structure remains bearish.
However, the latest bullish impulse from the LL shows strong buying momentum, pushing price back into the previous supply/resistance zone near the Lower High (LH).
Key observations:
โ
Market structure: Bearish (LL still intact).
โ
Current move: Bullish retracement within a bearish trend.
โ ๏ธ Price is approaching a criti
# BNB 4H Chart: The Correction Continues โ But Which Scenario Wi# BNB 4H Chart: The Correction Continues โ But Which Scenario Will Prevail?
Following the two primary scenarios discussed on the daily timeframe, the 4-hour chart offers a closer look at the internal structure of BNB's ongoing correction.
## Aggressive Scenario: Wave (IV) Still in Progress
The current decline continues to support the view that **wave (IV)** has not yet completed. The recent break below the corrective channel strengthens the probability that the market is developing the final