Compare with Adani Energy Solutions Ltd
24.30 INR
22.83 B INR
275.88 B INR
333.59 M
Next report date
—
Report period
—
EPS estimate
—
Revenue estimate
—
Company info
Sector
Industry
CEO
Kandarp Suryakant Patel
Website
Headquarters
Ahmedabad
Founded
2013
IPO date
Jul 31, 2015
ISIN
INE931S01010
FIGI
BBG008396QC2
Identifiers
ISIN INE931S01010
Adani Energy Solutions Ltd. engages in establishing, commissioning, setting up, operating, and maintaining electric power transmission systems. It operates through the following segments: Transmission, Distribution Business, Trading, and Others. The Transmission segment manages the transmission line for power transmission. The Distribution Business refers to the transmission and distribution of power business for Mumbai City and Mundra Distribution. The Trading segment offers trading activity of goods and services. The Others segment includes smart metering business and EPC activities. The company was founded by Gautambahi Shantilal Adani on December 9, 2013 and is headquartered in Ahmedabad, India.
Adani Group: The 3-Year HVF Funnel Breakout is LIVEThe wait is over.
After 36 months of intense compression and volatility digestion, the Adani Group Combined Index (ENT + POWER + GREEN + PORTS + ENSOL + ATGL) has officially cleared its Hunt Volatility Funnel (#HVF) trigger at 7,360.20.
@TheCryptoSniper
While the broad market is struggling with
#ADANIENSOL Good Retracement Levels to Enter.
#Adaniensol is at good retracement levels. Trades can use this pullback to make fresh entries, add further towards 1400 levels. Stop can be placed below 1350.
Overall broader market structure is turning positive. Adani Group Stocks have seen good run up in last few weeks. This is the strongest s
BULLISH VIEW IN ADANIENSOL-- EDUCATIONAL PURPOSEStock crashed from 4236 to 631 (-85%) from Sept 2022- to Feb 2023. After that stock entered into consolidation zone and now saucer pattern breakout is seen after 2 years.
Long position can be initiated on re test level near 1260
TARGET : 2835 (221%) -(PREVIOUS RESISTANCE)
STOPLOSS : WEEKLY CLOSIN
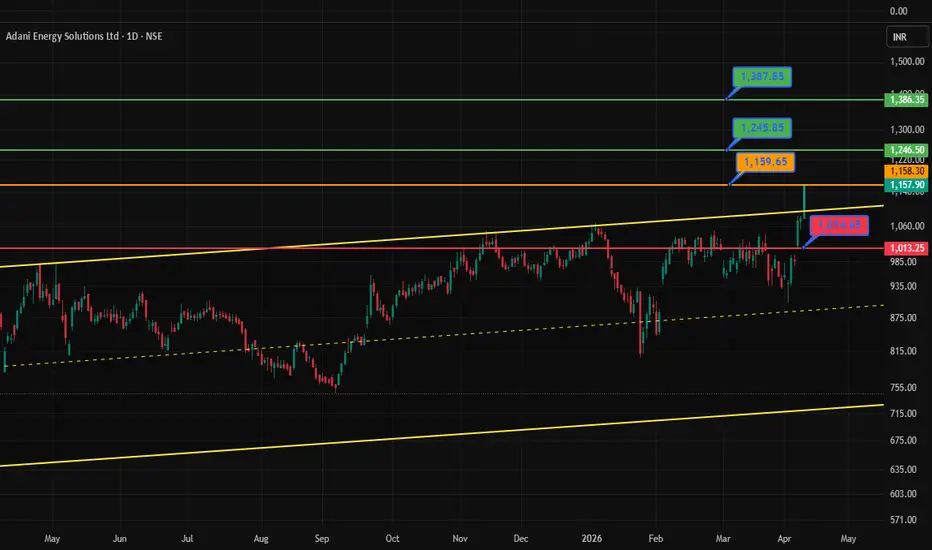
ADANIENSOLStock name : Adani Energy Solutions Ltd.
Bullish setup.
Time frame : Daily.
This chart explain everything (entry , resistance , support ).
This chart setup is for just 2 or 4 weeks.
This chart is shared for for educational and informational purpooses only and should not be considered as financial or
Adani Energy Solutions Ltd - Swing Trade IdeaChart Structure
CMP: ~₹1019
EMA 100: ~₹965 (trend support)
Primary Resistance: ₹1075
Stop Support: ₹980
Major Support: ₹924
Long-term target: ₹1348
Price is currently above the 100 EMA, which confirms medium-term bullish structure.
1️⃣ Trend
Stock reclaimed EMA-100 after a sharp correction.
Higher
ADANI ENERGY SOLUTIONSADANI ENSOL-coz of recent news related to summon from USA has caused panic selling in whole Adani pack.
Adaniensol has reached its imp support, though it has slightly breached the trendline downside but it is imp to watch for Tuesday closing before initiating buying/avging in this
See all ideas
Summarizing what the indicators are suggesting.
Neutral
Neutral
Neutral
An aggregate view of professional's ratings.
Neutral
Neutral
Neutral
Displays a symbol's price movements over previous years to identify recurring trends.
Maturity dateFeb 12, 2030
Coupon3.95% (Fixed)
Maturity dateJul 22, 2031
Coupon3.87% (Variable)
Maturity dateMay 21, 2036
Coupon4.25% (Fixed)
See all ADANIENSOL bonds
Frequently asked questions
The current price of ADANIENSOL is 1,376.60 INR — it has decreased by −0.93% in the past 24 hours. Watch Adani Energy Solutions Ltd stock price performance more closely on the chart.
Depending on the exchange, the stock ticker may vary. For instance, on BSE exchange Adani Energy Solutions Ltd stocks are traded under the ticker ADANIENSOL.
ADANIENSOL stock has risen by 1.13% compared to the previous week, the month change is a −10.20% fall, over the last year Adani Energy Solutions Ltd has showed a 43.85% increase.
We've gathered analysts' opinions on Adani Energy Solutions Ltd future price: according to them, ADANIENSOL price has a max estimate of 2,060.00 INR and a min estimate of 1,434.00 INR. Watch ADANIENSOL chart and read a more detailed Adani Energy Solutions Ltd stock forecast: see what analysts think of Adani Energy Solutions Ltd and suggest that you do with its stocks.
ADANIENSOL reached its all-time high on Sep 16, 2022 with the price of 4,238.55 INR, and its all-time low was 25.25 INR and was reached on Sep 21, 2015. View more price dynamics on ADANIENSOL chart.
See other stocks reaching their highest and lowest prices.
ADANIENSOL stock is 1.38% volatile and has beta coefficient of 1.56. Track Adani Energy Solutions Ltd stock price on the chart and check out the list of the most volatile stocks — is Adani Energy Solutions Ltd there?
Today Adani Energy Solutions Ltd has the market capitalization of 1.72 T, it has increased by 5.05% over the last week.
Yes, you can track Adani Energy Solutions Ltd financials in yearly and quarterly reports right on TradingView.
Adani Energy Solutions Ltd is going to release the next earnings report on Nov 11, 2026. Keep track of upcoming events with our Earnings Calendar.
ADANIENSOL earnings for the last quarter are 9.60 INR per share, whereas the estimation was 6.75 INR resulting in a 42.22% surprise. The estimated earnings for the next quarter are 12.20 INR per share. See more details about Adani Energy Solutions Ltd earnings.
Adani Energy Solutions Ltd revenue for the last quarter amounts to 97.11 B INR, despite the estimated figure of 78.88 B INR. In the next quarter, revenue is expected to reach 75.85 B INR.
ADANIENSOL net income for the last quarter is 11.49 B INR, while the quarter before that showed 6.84 B INR of net income which accounts for 0.00% change. Track more Adani Energy Solutions Ltd financial stats to get the full picture.
No, ADANIENSOL doesn't pay any dividends to its shareholders. But don't worry, we've prepared a list of high-dividend stocks for you.
As of Sep 23, 2026, the company has 8.13 K employees. See our rating of the largest employees — is Adani Energy Solutions Ltd on this list?
EBITDA measures a company's operating performance, its growth signifies an improvement in the efficiency of a company. Adani Energy Solutions Ltd EBITDA is 97.78 B INR, and current EBITDA margin is 33.28%. See more stats in Adani Energy Solutions Ltd financial statements.
Like other stocks, ADANIENSOL shares are traded on stock exchanges, e.g. Nasdaq, Nyse, Euronext, and the easiest way to buy them is through an online stock broker. To do this, you need to open an account and follow a broker's procedures, then start trading. You can trade Adani Energy Solutions Ltd stock right from TradingView charts — choose your broker and connect to your account.
Investing in stocks requires a comprehensive research: you should carefully study all the available data, e.g. company's financials, related news, and its technical analysis. So Adani Energy Solutions Ltd technincal analysis shows the sell today, and its 1 week rating is neutral. Since market conditions are prone to changes, it's worth looking a bit further into the future — according to the 1 month rating Adani Energy Solutions Ltd stock shows the buy signal. See more of Adani Energy Solutions Ltd technicals for a more comprehensive analysis.