Bullish View On BATA # Bata India – Business Model
## 1. Company Overview
Bata India Limited is one of India's leading footwear companies and is part of the global Bata Shoe Organization. The company operates primarily in the **footwear and accessories** segment and serves consumers across men's, women's and children's categories. Bata India is also one of India's largest footwear retailers. ( )
Its business model combines **manufacturing, branded retail, franchising, wholesale/distribution, institutional sales a
Bata India Ltd
No trades
No trades
In-depth trading ideas
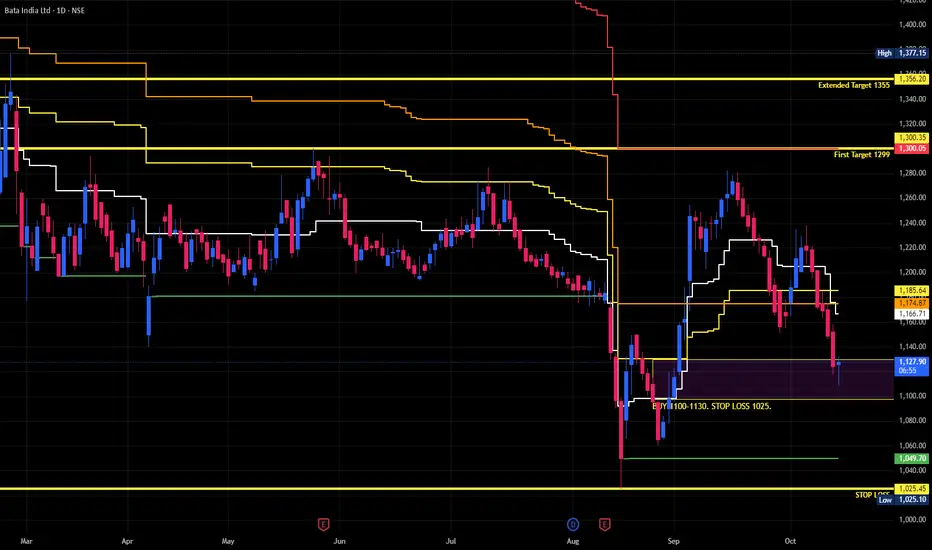
bata india : healthy risk reward 1. Retest of the Mother Candle Demand Zone
The sharp rally triggered by the new CEO announcement failed to sustain, but the subsequent decline found support almost exactly at the low of the impulsive "mother candle." This successful retest suggests institutional demand remains active, with buyers defending a proven accumulation zone rather than allowing a fresh breakdown.
2. Higher Lows Signal Accumulation
Price has started forming a series of higher lows while repeatedly finding support around
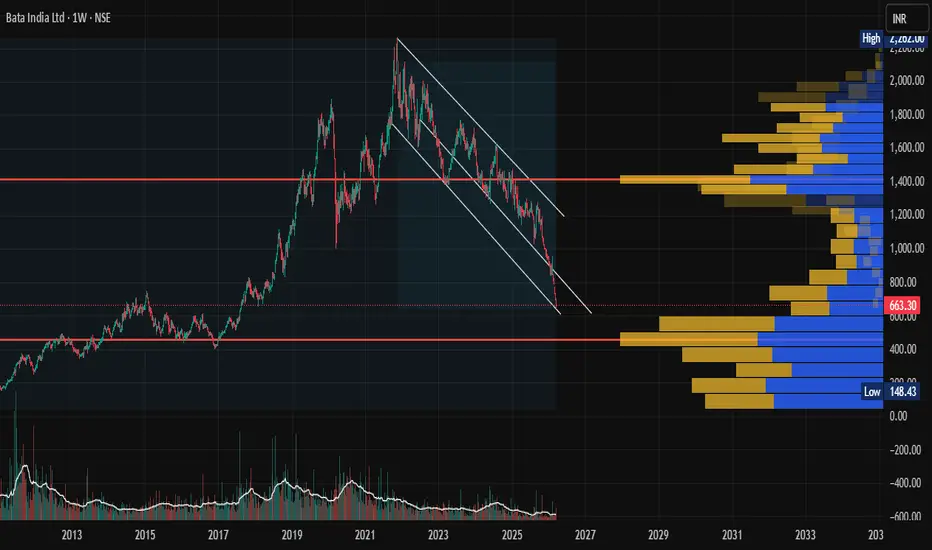
BATA INDIA at Strong Support ZoneBATA india is having very strong support zone of 622-610 INR. also almost touches downward channel support area, expected strong rebound towards 1400 INR. This is investment type of idea not for treaders and short term swing traders.
I am not a SEBI-registered Research Analyst. The information provided is for educational and informational purposes only and should not be construed as investment advice, recommendation, or solicitation to buy or sell any securities.
I do not have any financial i
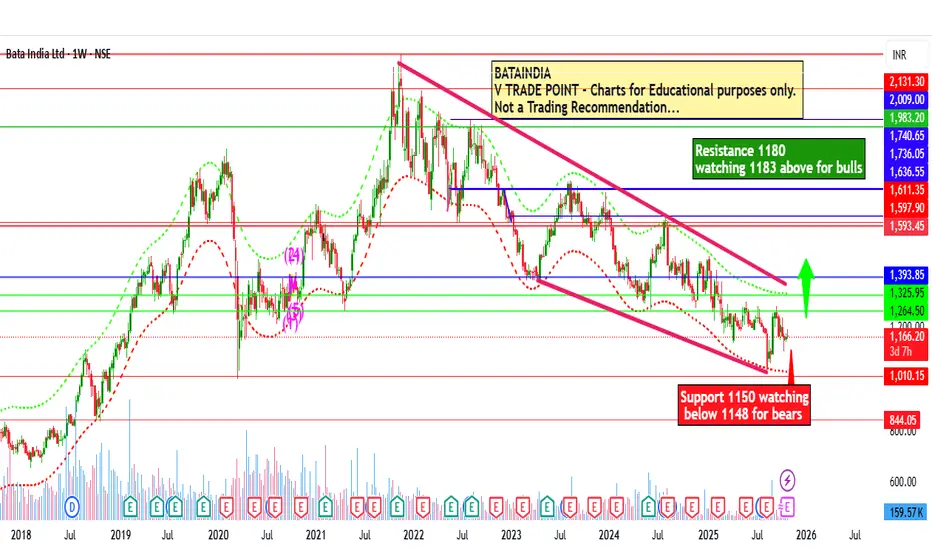
Bata India Ltd for 28th Oct #BATAINDIA Bata India Ltd for 28th Oct #BATAINDIA
Resistance 1180 Watching above 1183 for upside momentum.
Support area 1150 Below 1160-1165 gnoring upside momentum for intraday
Watching below 1143 for downside movement...
Above 1160 ignoring downside move for intraday
Charts for Educational purposes only.
Please follow strict stop loss and risk reward if you follow the level.
Thanks,
V Trade Point
Bata - Momentum + improving RSI + MA crossovers supportBata – Technical Setup
Trend Context: After a prolonged bearish phase, Bata has shown signs of reversal from a strong support zone around ₹1100.
Price Action: Recently, the stock formed a base near support and has now given a trendline/neckline breakout. On the daily chart, the inside candle breakout adds confirmation of bullish momentum.
Levels to Watch:
Entry: Above inside candle breakout (sustaining strength).
Stop Loss: ₹1200 (round level support) – keep it strict.
Targets:
T1: ₹1294
bata india
Relative Strength Index (14) 59.05
Exponential Moving Average (10) 1,235.04
Simple Moving Average (10) 1,228.87
Exponential Moving Average (20) 1,227.40
Simple Moving Average (20) 1,219.52
Exponential Moving Average (30) 1,227.40
Simple Moving Average (30) 1,220.11 Buy
Exponential Moving Average (50) 1,236.60 Buy
Bata India Ltd, Monthly TFLongterm View
It has reached the covid fall levels and is almost around 0.5 fib retracement level. looking good for long term. can buy in small small chunks between zones 1000-1300, rather than going all in at the same time.
major resistance going forward will be arnd 1660 lvls above that 1900 & 2100.
BATA INDIA LTD SWING TRADE📊 Price Action & Trend Analysis
Analyzing market trends using price action, key support/resistance levels, and candlestick patterns to identify high-probability trade setups.
Always follow the trend and manage risk wisely!
Price Action Analysis Interprets Market Movements Using Patterns And Trends On Price Charts.
👉👉👉Follow us for Live Market Views/Trades/Analysis/News Updates.
BATA INDIA: FIBONACCI TRADE SETUP ALERT!
**🚨 BATA INDIA: FIBONACCI TRADE SETUP ALERT! 🚨**
**💹 Current Price Action:**
Bata India is trading at **₹1,281.30**, holding just above a critical Fibonacci support level at **₹1,279.55** (0% retracement). The stock is currently in a **downtrend**, respecting the Fibonacci levels.
---
### **📊 Key Fibonacci Levels:**
1. **Resistance Zones:**
- **23.6% Retracement (₹1,318.85):** First key level for bullish reversal.
- **38.2% Retracement (₹1,347.50):** Strong overhead resistance if mom
Long Positional Trade Idea for Bata India Ltd Long Positional Trade Idea for Bata India Ltd.
Bata India is showing bullish momentum as it breaks above key resistance at ₹1,460. The next target lies at ₹1,547, with further potential towards ₹1,633.
Entry: Above ₹1,470 (breakout confirmation).
Stop Loss: ₹1,400 (below recent support).
Targets: ₹1,547 (short-term) and ₹1,633 (medium-term).
Indicators: RSI trending upwards and increasing volume support bullish sentiment.
BATA INDIA LTD Trade SetupHello,
Trend-Based Analysis. Buy the Dips, Sell The Rallies, Also Following the Trend. Let's see where the Price Action takes us, Riding the wave. Potential trade setups based on trend momentum.
Technical analysis based on trend identification and momentum, Looking for high-probability setups within the prevailing trend.
Analyzing the current market trend and potential future price movement. Focusing on risk management and reward-to-risk ratios.
Details is Mentioned in Chart, Read carefully.
Weekly TF Analysis - BATAINDIAWeekly chart of BATA shows a beautiful Falling Wedge pattern.
The last candle is an inside candle from the previous week, suggesting a brief pause before the up move.
Any break above 1460 can result in a good move on the upside.
Fall below 1400 may be a continuation of the falling wedge pattern.